


1. Introduction
The periodic vortex shedding from a bluff body in fluid flow is known to generate alternating pressure forces on the surfaces of the structure. These forces can lead to large-amplitude vortex-induced vibration (VIV) of the body if it is an elastic or elastically mounted rigid structure and the frequency of vortex shedding is close to the natural frequency of the structure. VIV is a source of significant concern for the integrity of the bluff structures used in many engineering applications, such as offshore risers and pipelines used in the petroleum industry, heat exchanger tubes in nuclear power plants, aircraft control surfaces in aeronautical applications, and civil engineering structures such as bridges, towers and industrial chimneys, to name a few. The ubiquity of VIV has attracted numerous experimental and computational studies over the years, as discussed in the reviews of Sarpkaya (Reference Sarpkaya2004), Gabbai & Benaroya (Reference Gabbai and Benaroya2005), Williamson & Govardhan (Reference Williamson and Govardhan2008), Nakamura & Kaneko (Reference Nakamura and Kaneko2008) and Naudascher & Rockwell (Reference Naudascher and Rockwell2012).
The current study focuses on the free vibrations of an elastically mounted rigid circular cylinder constrained to move transverse to the free-stream flow. The VIV of such a system mainly depends on the mass ratio  $({m^\ast } = {m_t}/{m_d})$, damping ratio
  $(\zeta = c/{c_{crit}})$ and reduced velocity
  $({U^\ast } = U/{f_n}D)$, where
  ${m_t}$ is the total mass of the oscillating system,
  ${m_d}$ is the mass of the displaced fluid, c is the damping of the system,
  ${c_{crit}}$ is the critical damping, U is the free-stream velocity,
  ${f_n}$ is the natural frequency of the system and D is the cylinder diameter. As shown by Khalak & Williamson (Reference Khalak and Williamson1997), the VIV of an elastically mounted cylinder with a low mass-damping parameter,
  ${m^\ast }\zeta $, is characterized by three distinct VIV amplitude branches as the reduced velocity is varied within the synchronization range, namely the initial, upper and lower branches. On the other hand, Feng (Reference Feng1968) showed that, with a high mass-damping parameter, only the initial branch and the lower response branch would exist. Brika & Laneville (Reference Brika and Laneville1993) were among the first to show a correspondence between the vortex shedding patterns and the response branches in the synchronization regime. They found that, in the initial branch, vortices are arranged in 2S mode, which involves the shedding of two single vortices in each cycle. In the lower branch, vortices pair up together, and two pairs of counter-rotating vortices are shed in each cycle, denoted as the 2P mode. Govardhan & Williamson (Reference Govardhan and Williamson2000) revealed the presence of the 2P mode of vortex formation also in the upper branch. Shortly after, Morse & Williamson (Reference Morse and Williamson2009) identified another mode for the upper branch and called it the 2Po mode. The 2Po mode is similar to the 2P mode, but the second vortex in each vortex pair is much weaker than the first vortex. They showed that, in the upper branch, the 2Po mode generates the highest oscillation amplitude within the synchronization region, and the vortex mode can switch intermittently between the 2P and 2Po modes.
Table 1 provides a summary of several previous studies on cylinders undergoing free vibrations in water facilities with small damping, which results in a small combined mass-damping parameter similar to those encountered in marine applications. While the mass-damping parameters,  ${m^\ast }\zeta $, of these studies are mostly close, the end conditions vary greatly. Notice that some of these studies considered free-ended cylinders with the end of the cylinder far from the water tunnel's boundary layer (such as Kiu, Stappenbelt & Thiagarajan Reference Kiu, Stappenbelt and Thiagarajan2011; Franzini et al. Reference Franzini, Goncalves, Meneghini and Fujarra2013), while Brankovic & Bearman (Reference Brankovic and Bearman2006) moved the cylinder closer to the wall and let the boundary layer influence the movement of the cylinder. In most studies, endplates have been utilized to eliminate the end effects and promote two-dimensional conditions across the span. In some of these cases, the endplate was attached to the cylinder (such as in Morse, Govardhan & Williamson Reference Morse, Govardhan and Williamson2008), while in others (such as Khalak & Williamson Reference Khalak and Williamson1999; Govardhan & Williamson Reference Govardhan and Williamson2000; Hover, Tvedt & Triantafyllou Reference Hover, Tvedt and Triantafyllou2001; Vaziri & Ekmekci Reference Vaziri and Ekmekci2022), the endplate was fixed to the channel floor, leaving a small gap between the cylinder and the endplate. The case of an unattached endplate and a free-ended cylinder can be characterized by the ratio of the gap left under the cylinder's end to the cylinder diameter, g* = g/D, values of which are also given for the cases in table 1.
Table 1. Previous studies involving the free vibration of cylinders in water facilities under low mass-damping conditions, and the end condition used in those studies. Here, g* is the gap between the cylinder and the endplate (in the case of an unattached endplate) or the cylinder and the channel floor (in the case of a free-ended cylinder) in non-dimensional form (g* = gap/cylinder diameter).

These studies show a wide spectrum in free-vibration response (see figure 1, where the VIV amplitudes in non-dimensional form,  ${A^\ast } = A/D$, are plotted for the experiments listed in table 1 against reduced velocity,
  ${U^\ast }$). Given the different end conditions used, such a variation in response should be expected to a certain degree, even if all other flow parameters are relatively close. The effects of other flow parameters, such as mass, damping and, more recently, the Reynolds number, on VIV have been investigated extensively (such as by Govardhan & Williamson Reference Govardhan and Williamson2006; Klamo, Leonard & Roshko Reference Klamo, Leonard and Roshko2006); however, the effects of end conditions on VIV have been mostly overlooked. As a result, there is no consensus on the appropriate end conditions. More importantly, the disparity of results from various groups comes with some level of speculation. Morse et al. (Reference Morse, Govardhan and Williamson2008) is one of the few studies that explored the effects of end conditions on the transverse oscillations of an elastically mounted rigid cylinder undergoing VIV. They conducted free-vibration tests on a cylinder with three different end conditions, which included the free-ended cylinder with no endplate, the case of an attached endplate and an unattached endplate with a small gap (g* = 4 %). They found no discernible difference between the vibration responses of the cylinder for the attached endplate and the unattached endplate with the small g* value of 4 %; however, remarkable distinctions in response plots were noticed for the free-ended cylinder in comparison with the vibration response of the cylinder with the attached endplate. The main difference was found in the lower synchronization branch, where the free-ended cylinder experienced increased vibration amplitudes (up to 40 %), although the peak amplitude in the upper branch remained almost unchanged compared with that of the cylinder with the attached endplate. In addition, with an increase in reduced velocity, the vibration amplitude for the free-ended case showed a gradual decrease from its peak value rather than a distinct upper-to-lower branch jump observed in all cases with endplates. Morse et al. (Reference Morse, Govardhan and Williamson2008) also carried out force measurements at various gap ratios on a cylinder prescribed to undergo sinusoidal transverse vibrations at a fixed amplitude and frequency, which corresponded to the free-vibration response of the cylinder with an attached endplate (i.e. with g* = 0 %) in the lower branch. They observed a jump in the measured excitation force at a critical gap ratio of around g* = 15 %. In their forced vibration tests, for gaps larger than this critical gap ratio, the fluid force remained roughly constant at a value equivalent to that of the no-endplate case. While for smaller gaps, g* < 15 %, the case of an attached and unattached endplate became effectively equivalent.

Figure 1. A comparison of the VIV response amplitude in non-dimensional form,  ${A^\ast } = A/D$, as a function of the normalized fluid velocity,
  ${U^\ast }$, between previous experimental studies for the following end conditions: (a) attached or unattached endplates with small gap ratios, (b) free-ended cylinders or unattached endplates with large gap ratios. More details about the end conditions and other parameters for each experiment are provided in table 1.
In light of these findings, some clear trends start to emerge if we divide the experiments in table 1 into two major groups: one group consisting of those having either an attached endplate or an unattached endplate with small gaps (figure 1a) and the other comprising those having an unattached endplate with large gaps or no endplates (figure 1b). As observed in figure 1(a), the free-vibration response plots of the cases with the attached endplates and the unattached endplates with a small gap from the cylinder are characterized by a sudden jump between the upper and lower branches and a relatively constant amplitude of oscillation throughout the lower branch before reducing to small values in the desynchronization region. Looking at figure 1(b), it is apparent that the experiments involving both no endplates and endplates placed at large gaps show similar behaviour compared with figure 1(a) in the initial and upper branches; however, the lower branch exhibits vastly different trends: no sign of a jump is distinguishable between the upper and lower branches, and the oscillation amplitude reduces gradually with increasing reduced velocity. It must be noted that the horizontal shift observed in the value of the reduced velocity between the response plots of different experiments is partly due to the differences in the natural frequency and Strouhal number. This shift can be reduced using a normalized velocity given by  $({U^\ast }/{f^\ast })St$, where
  $St = {f_v}D/U$ is the Strouhal number for an equivalent stationary cylinder with a vortex shedding frequency of
  ${f_v}$, diameter D and free-stream flow velocity U, and
  ${f^\ast }$ is the ratio of body oscillation frequency, f, to the natural frequency, fn. However, given that these values were not known for all studies, the results in figure 1 are illustrated based on the reduced velocity,
  ${U^\ast }$, which is more universally used.
For cylinders fitted with endplates where the flow is two-dimensional, earlier studies (such as Williamson & Roshko Reference Williamson and Roshko1988; Govardhan & Williamson Reference Govardhan and Williamson2000) have shown that the transitions between the response branches occur in conjunction with changes in the vortex shedding modes. As mentioned earlier, the initial branch is characterized by the 2S vortex shedding mode, where two single vortices are shed in each oscillation cycle. In the lower branch, two pairs of vortices with similar sizes are shed in each cycle, known as the 2P mode. The upper branch intermittently transitions between the 2P mode and a mode known as the 2Po mode, where two pairs of vortices are shed in each cycle but with a much weaker second vortex than the first. However, for cylinders without an endplate or with an endplate placed at large gaps, there are several unresolved questions, especially in the lower branch, where the effect of end conditions is most pronounced on the oscillation amplitude. Do the same vortex shedding modes seen for cylinders fitted with endplates exist for the no-endplate case or the case where an endplate is placed at large gap spacings? If so, why does the sudden transition not occur between the upper and lower branches? What is the physical reason behind the observed differences in response amplitude for different end conditions? Is there a critical gap ratio of around 15 % for the free-vibration response of cylinders, as the forced-oscillation study of Morse et al. (Reference Morse, Govardhan and Williamson2008) would suggest, that separates the two distinct trends? These unresolved questions are the main motivation that triggered this study. With an intent to address these issues, the transverse VIV of an elastically mounted, low mass-damping rigid circular cylinder is studied in a water channel in the current experimental work. While the upper end of the cylinder is kept as the free water surface in all test cases, three distinct end conditions are examined for the lower end: the free-ended cylinder with no endplate, an attached endplate and an unattached endplate with various gap ratios from g* = 2 % to 40 %.
After the description of the free-vibration test set-up in the next section, the displacement data and force estimations are scrutinized in § 3 for test cases with different end conditions, and the fundamental differences between them are discussed in detail. To provide a physical rationale behind the observed end effects, flow characteristics and vortex shedding behaviours for different cylinder end conditions are presented in § 4, which is followed by conclusions in § 5.
2. Experimental set-up
Experiments were conducted in the recirculating water channel at the University of Toronto Institute for Aerospace Studies. The test section walls of this facility are made out of Plexiglas material for clear visual access. The test section is 5000 mm long and has a cross-section of 610 mm (width) by 685 mm (height). The free-stream turbulence intensity is less than 0.5 %, and the flow uniformity is better than 0.3 % within this test section.
As shown in figure 2(a), the main cylinder was connected to a rotary step motor, which was mounted directly to a mounting block together with two supporting linear shafts. The cylinder, the rotary step motor, the mounting block and the two supporting shafts underwent oscillations altogether. The two linear shafts passed through four air bearings fixed to the channel, allowing the low-damping motion of the oscillating system in the transverse direction to the flow while eliminating inline movements. Two tension springs provided the restoring force, and a high-resolution laser distance sensor (Wenglor CP24MHT80) was used to capture the instantaneous positions of the cylinder with no contact. The oscillating cylinder pierced the free water surface (as seen in figure 2a). This was a rigid polycarbonate cylinder with a diameter D = 50.8 mm and a length L = 540 mm; hence, its aspect ratio was L/D = 10.6. The total oscillating mass of the system in all test cases was kept at 2.58 kg, corresponding to a mass ratio of 2.58. The natural frequency and the structural damping ratio of this system were fn = 0.36 Hz and  $\zeta = 0.021$, respectively, as measured with free-decay tests conducted in still water. The bottom end condition of the cylinder was manipulated to produce three commonly used end conditions:
(i) An unattached endplate fixed to the channel floor, as in figure 2(a), with a variable gap spacing between the cylinder and the endplate from g* = g/D = 2 % to 40 %.
(ii) A circular endplate attached to the bottom of the cylinder. The diameter of this endplate was four times the cylinder diameter.
(iii) Free cylinder end with no endplate at all. In this case, the distance from the end of the cylinder to the channel floor was g = 142 mm, giving a very large gap ratio of approximately g* = 280 %.
The attached circular endplate was 3D-printed with a thickness of 3 mm (0.06D) to minimize its effect on the cylinder oscillations. Counterweights were used to keep the overall oscillating mass constant between the different experimental cases with and without the attached endplate.

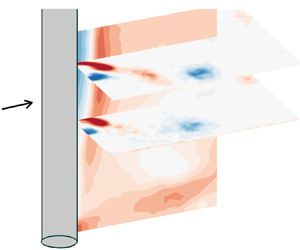
Figure 2. (a) The free-vibration test set-up where the endplate is fixed on the channel floor and is not attached to the cylinder. (b) The PIV image acquisition planes. The origin of the reference coordinate system is placed at the point where the vertical axis of the cylinder intersects with the endplate, with the x and z axes pointing downstream and upwards, respectively. In this coordinate system, the upper and lower horizontal planes of flow visualization pass from z/D = 5.25 and z/D = 3.5, respectively, and the vertical visualization plane is slightly to the side of the cylinder at y/D = −0.6.
The endplate unattached from the cylinder was made out of transparent Plexiglas material of 12.7 mm (0.25D) thickness. Its streamwise length was 7.5D, and its width covered the entire width of the channel (12D). A 23.6° full-depth bevel was put on its upstream end, with the bevel facing the channel floor to minimize disturbances to the inflow. Following the recommendations of Stansby (Reference Stansby1974), Szepessy & Bearman (Reference Szepessy and Bearman1992) and Khoury (Reference Khoury2012), the cylinder axis was situated 3D downstream of the leading edge of the endplate. This endplate was placed at a fixed height from the channel floor. Its top surface was 182 mm (3.58 D) above the water channel floor. Throughout the investigation, different values of gap spacing between the endplate and the cylinder were obtained by raising or lowering the cylinder vertically within the channel. During this process, the water level in the channel was carefully adjusted to keep the submerged length of the cylinder unchanged.
Other than the bottom end condition, all other experimental variables, such as mass and damping ratios in the set-ups, were kept constant to distinguish the effects of only the end condition in the results. Experiments were conducted over a range of free-stream velocities from U = 0.043 to 0.279 m s−1, giving a reduced velocity range of  $2 \le {U^\ast } \le 15$ and a Reynolds number range of
  $2000 \le Re \le 14\;700$ (based on the cylinder diameter). The Froude number based on the cylinder length is
  $0.015 < U/\sqrt {gL} < \; 0.117$ where g is the gravitational acceleration, within the range of reduced velocities investigated, indicating a subcritical flow in the water channel. Also, the maximum elevation changes of the water around the cylinder were observed to be very small (close to the approximations provided by Hay (Reference Hay1947) and Chaplin & Teigen (Reference Chaplin and Teigen2003) for a stationary cylinder). Therefore, the effects associated with free-surface distortions on cylinder oscillations can be neglected in accord with Gonçalves et al. (Reference Gonçalves, Rosetti, Franzini, Meneghini and Fujarra2013).
High-image-density particle image velocimetry (PIV) was utilized to capture global, quantitative information about the near-wake flow field. For this technique, the flow was seeded with neutrally buoyant, hollow-glass spherical tracer particles having a nominal diameter of 8 to 12 μm and a density of 1050 to 1150 kg m−3. Illumination of the flow field of interest was achieved using a NewWave double-pulsed Nd: YAG laser, which had a maximum energy output of 200 mJ pulse−1 at a wavelength of 532 nm and a maximum operating speed of 14.5 Hz. A series of cylindrical lenses converted the laser beam output from this laser system to a laser sheet that illuminates the planar flow region of interest. In all tests, a sequence of 2000 image pairs was recorded at a rate of 14.5 frame pairs per second via a PowerView Plus 2 MP CCD camera, which had an array size of 1600 × 1200 pixels. This sampling rate corresponded to approximately 138 seconds of sequential data acquisition, equivalent to about 50 cycles of cylinder oscillations. Throughout the investigation, the PIV and laser distance sensor data were acquired in synchronization utilizing a LaserPulse Model 610 035 synchronizer to allow accurate phase averaging of the flow field based on the cylinder displacement. The reported amplitude of cylinder oscillations was evaluated as the average of the top 10 % of the individual amplitude peaks in the same manner as in previous studies.
As shown in figure 2(b), the PIV data were acquired over three planes (two horizontal and one vertical). The horizontal planes provided the near-wake flow structures at two spanwise locations: the higher horizontal plane was located at the mid-span (at z/D = 5.25, based on the coordinate system defined in figure 2b) to capture the vortex shedding modes not influenced by the end condition, while the lower horizontal plane was positioned at z/D = 3.5 to detect the influence of the end condition on the vortex dynamics. The vertical plane at y/D = −0.6 provided supplementary information regarding the spanwise variations in the flow structure. The PIV fields of view in the horizontal planes (i.e. z/D = 5.25 and z/D = 3.5 planes) covered 6D in the streamwise direction starting from the cylinder base and had a width of 4.4D in the cross-stream direction. The vertical plane (i.e. y/D = −0.6 plane) covered 4.55D downstream of the cylinder base and 6.2D upwards from the endplate. During image processing, the interrogation window size was set to  $32 \times 32$ with an overlap of 50 %, producing a total of 7227 velocity vectors with a vector resolution of 0.06D to 0.062D for all image acquisition planes.
3. Cylinder displacement and force characteristics
3.1. Cylinder displacement
Figure 3 shows the variation of the cylinder vibration amplitude in non-dimensionalized form,  ${A^\ast } = A/D$, with the reduced velocity,
  ${U^\ast }$, for the cylinder end conditions of no endplate, attached endplate and unattached endplate with varying gap ratios. Therein, the case without any endplate is marked by a gap ratio of g* = 280 % since the distance from the free-ended cylinder to the channel floor was 2.8 times the cylinder diameter, and the case with the attached endplate is marked by g* = 0 %. Also, note that the vibration amplitude was virtually the same for
  ${g^\ast } \ge 24\,\%$. Therefore, for
  ${g^\ast } \ge 24\,\%$, the variation of the amplitude with reduced velocity is shown with a single line in figure 3. For the attached endplate and the unattached endplates with gap ratios of up to 4 %, the amplitude variation shows the familiar three-branch behaviour, with a jump between the upper and lower branches and a relatively constant amplitude throughout the lower branch before reaching desynchronization. On the other hand, for larger gap ratios (g* > 4 %), while the initial and upper branches maintain nearly the same amplitude, the upper-to-lower branch transition shows a significant distinction from smaller gap ratios, such that the amplitude response of g* > 4 % gradually decreases with increasing reduced velocity from its peak value with no discrete transition to the lower branch. These results agree well with the literature presented in the introduction section and prove that the two different characteristics in amplitude response are indeed caused by the cylinder end conditions, given that all other parameters were kept the same in the current experiments.

Figure 3. Response amplitude,  ${A^\ast }$, against reduced velocity,
  ${U^\ast }$, for various end conditions. Here, g* = 0 % corresponds to the case with the attached endplate, and g* = 280 % depicts the gap ratio between the cylinder and the channel floor for the free-ended cylinder. The gap ratio
  $2\,\%\le {g^\ast } \le 40\,\%$ involves an unattached endplate. As the response lines coincided for
  ${g^\ast } \ge 24\,\%$, these cases are shown with a single line in the plot for clarity.
Another significant understanding comes from the inspection of the response data at g* = 8 % in figure 3. This gap ratio is well below the g* = 15 % threshold, which was thought previously to be the critical point where the free-vibration response characteristics in the lower branch would change from depicting a sudden jump at the upper-to-lower branch transition, similar to the case with an attached endplate, to a gradual variation, identical to the case with no endplate. This critical gap ratio value was deduced based on the sudden increase of fluid forces measured on a forced-oscillating cylinder, which was prescribed to vibrate sinusoidally with a fixed amplitude and fixed frequency corresponding to the oscillation amplitude and frequency of a comparable free-vibrating cylinder fitted with an attached endplate (Morse et al. Reference Morse, Govardhan and Williamson2008); however, this critical value was never validated for cylinders undergoing free vibrations. Considering that the oscillation amplitude varies with the value of g* in the lower branch, as seen in figure 3, as well as the oscillation frequency (as will be seen later in this section), this critical g* value, identified by prescribing a fixed amplitude and a fixed frequency to the cylinder, may not represent a critical gap ratio for free-vibrating cylinders. It can be seen from figure 3 that even a gap ratio as small as g* = 8 % can significantly alter the response amplitude of the free-vibrating cylinder. In fact, the transition between the two distinct response characteristics in the lower branch appears gradual with the gap ratio as opposed to an abrupt change believed to occur at one critical gap ratio.
To further examine the effects of the gap ratio on the vibration response of the cylinder, figure 4 is given, where the response amplitude,  ${A^\ast }$, is plotted as a function of the gap ratio, g*, at different constant values of reduced velocity,
  ${U^\ast }$, in the lower branch. Note that, in this figure, error bars are depicted on the data pertaining to the
  ${U^\ast } = 10.8$ case to show the uncertainty in oscillation amplitude measurements. This uncertainty value (around 0.025D) was the same for all test cases; therefore, it is not shown in other figures to improve readability. Several important observations can be derived from this plot. For a given
  ${U^\ast }$, when the gap between the cylinder and the endplate is small, the response amplitude of the cylinder is around that of the cylinder having an attached endplate (i.e. g* = 0 %) at the corresponding
  ${U^\ast }$. At the other end of the spectrum, once the gap is large enough, the oscillation amplitude is unaffected by the gap ratio, and the cylinder essentially behaves like a free-ended cylinder. Based on the forced-oscillation data of Morse et al. (Reference Morse, Govardhan and Williamson2008), as indicated above, the gap ratio of 15 % was previously thought to be a threshold as a sudden increase was observed in the excitation force of the forced-oscillating cylinder at that g*. Here, it can be seen that the transition for a free-oscillating cylinder is more gradual than expected. Another salient point is that the end effects are more pronounced at the beginning of the lower branch (i.e. at lower U*). As the reduced velocity increases, the gap ratio effects slowly fade away. By the end of the lower branch (
 ${U^\ast } \approx 10$ to 11), the amplitude remains roughly the same regardless of the gap ratio. The reasons for this behaviour will be investigated in the following sections.

Figure 4. Response amplitude,  ${A^\ast }$, for various end conditions as a function of gap ratio, g*. Each curve shows a constant reduced velocity,
  ${U^\ast }$, in the lower branch, as indicated in the legend. In the plot, g* = 0 % corresponds to the case with the attached endplate, and g* = 280 % depicts the gap ratio between the cylinder and the channel floor for the free-ended cylinder. The gap ratios of
  $2\,\%\le {g^\ast } \le 40\,\%$ involve an unattached endplate. The uncertainty in amplitude measurements is the same for all test cases and is only shown for the case with U* = 10.8.
The end conditions also affect the frequency of oscillations, as can be seen in figure 5, where the oscillation frequency of the cylinder,  ${f^\ast } = f/{f_n}$, is plotted as a function of reduced fluid velocity,
  ${U^\ast }$, for different gap ratios, g*. The oscillation frequency generally decreases with an increase in gap ratio, and, similar to the trend observed for the response amplitude, the difference in frequency between the different gap ratios fades away at higher reduced velocities in the lower synchronization branch. It must be noted that only a subset of the gap ratios investigated in this study is shown in figure 5 for better clarity; however, all other gap ratios investigated in the present work follow the same trends.

Figure 5. Variation of the cylinder's oscillation frequency,  ${f^\ast } = f/{f_n}$, against reduced velocity,
  ${U^\ast }$, for various gap ratios. In the lower branch, larger gaps lead to a lower oscillation frequency.
Other than the vibration amplitude and frequency, the response of the cylinder can be further characterized by observing the time traces of its displacement, which are shown in figure 6 for three reduced velocities representing the three response branches. In this figure, the plots on the left have an unattached endplate with a very small gap ratio of g* = 2 %, while those on the right have the unattached endplate placed with a large gap ratio of g* = 40 %. Here, the former represents the typical oscillation patterns observed when an attached endplate or an unattached endplate with a small gap ratio is used, and the latter is representative of the cylinder displacements encountered when no endplate or an unattached endplate with a large gap is used. There is no discernible difference in the time traces of cylinder displacements between the two end conditions in the initial or upper branches. For both gap ratios, the initial branch is characterized by the beating motion, which is expected to be the result of the 2S vortex shedding mode, and the upper branch shows large modulations in response amplitude due to the intermittency of the 2P and 2PO vortex shedding modes, which is known to be encountered in this range of reduced velocities. Hence, it can be observed that the end conditions have limited influence on the initial and upper branches, but they notably alter the cylinder's movement in the lower branch. The markedly larger-amplitude and undulated cylinder oscillations observed in the lower branch in the case of a very large gap ratio (g* = 40 % in figure 6) are replaced by relatively lower-amplitude and steadier oscillations in the presence of an endplate placed very close to the cylinder end (the case with g* = 2 % in figure 6). It has been apparent from figures 3 and 4 that the changes in cylinder response occur gradually rather than abruptly as the gap ratio varies. Therefore, in the upcoming sections, the focus will be placed on the gap ratios of g* = 2 % and 40 % as the two end points of the existing spectrum.

Figure 6. Comparison of the typical time traces of cylinder displacement between unattached endplates with small and large gap ratios (g* = 2 % on the left and g* = 40 % on the right) in different response branches. In the lower branch, the higher gap ratio results in larger oscillation amplitudes with more modulation. (a,c,e) Unattached endplate (g* = 2 %) and (b,d,f) unattached endplate (g* = 40 %).
3.2. Force analysis
To gain physical insight into the cylinder's movement, it is essential to investigate the lift force and its relationship with the cylinder displacement. While there was no direct measurement of force data in this investigation, the following equation of motion for a body undergoing transverse oscillations can be leveraged to give an accurate estimation of the transverse force component acting on the cylinder:
 \begin{equation}m\ddot{y} + c\dot{y} + ky = F(t),\end{equation}
where F(t) is the instantaneous force imparted to the body by the fluid, y(t) is the instantaneous cylinder displacement and m, c and k are the system's mass, structural damping and spring stiffness, respectively, which are known properties of the experimental set-up. Measuring the instantaneous displacement, y(t), one can evaluate the left side of the equation and find the instantaneous fluid force,  $F(t)$, acting on the cylinder. Here, a sixth-order Butterworth filter with a cutoff frequency of 4 Hz was applied after each differentiation to eliminate the measurement noise enhanced by the numerical differentiation of a digitized signal. This cutoff frequency was carefully selected to be small enough to filter out most of the noise while still being sufficiently far from the frequencies of interest. The body oscillation is synchronized with the periodic vortex shedding in the synchronization range, where a reasonable approximation to the motion and force are often provided by the following sinusoidal functions:
 \begin{gather}y(t) = A\sin (2{\rm \pi} ft),\end{gather}
 \begin{gather}F(t) = {F_0}\sin (2{\rm \pi} ft + \; \varphi ).\end{gather}
Here, f is the body oscillation frequency, and  $\varphi $ is the phase angle between the fluid force and the body displacement. This phase difference,
  $\varphi $, is a key factor in determining the energy transfer between the fluid and the cylinder. Therefore, the precise value of the phase difference significantly affects the amplitude of oscillations. We note that, for free oscillations, while the cylinder displacement is close to a sinusoidal motion, the forcing on the cylinder may differ slightly from a sinusoidal signal. If the fluid force is decomposed into its Fourier components as
 \begin{equation}F(t) = \{ {F_1}\sin (2{\rm \pi} {f_1}t + {\varphi _1}) + {F_2}\sin (2{\rm \pi} {f_2}t + {\varphi _2}) + \cdots \} ,\end{equation}
then the force component of interest is the one closest to the frequency of oscillation f as this is the only component making a lasting contribution to the energy transfer between the fluid and the cylinder. In this investigation, the short-time Fourier transformation method is utilized to find the instantaneous phase difference between the fluid force and the body displacement corresponding to the oscillation frequency.
For stable oscillations of a free-oscillating body, the energy transfer from the fluid to the oscillating system  $({E_{in}})$ in each cycle is balanced by the dissipation of energy through structural damping
  $({E_{out}})$
 \begin{equation}{E_{in}} = {E_{out}}.\end{equation}
Integrating over each cycle of oscillation with non-dimensionalization of parameters gives the following amplitude equation, provided by Khalak & Williamson (Reference Khalak and Williamson1999), which is used in various studies to successfully estimate the amplitude of free oscillations using force measurements from forced-oscillation experiments:
 \begin{equation}{A^\ast } = \frac{1}{{4{{\rm \pi} ^3}}}\frac{{{C_y}\sin \varphi }}{{({m^\ast } + {C_A})\zeta }}{\left( {\frac{{{U^\ast }}}{{{f^\ast }}}} \right)^2}{f^\ast }.\end{equation}
 Here,  ${C_A}$ is the potential added-mass coefficient (equal to 1 for circular cylinders) and
  ${C_y}$ is the transverse force coefficient found by normalizing the amplitude of the force component corresponding to the frequency of body oscillation by
  $({\textstyle{1 \over 2}})\rho {U^2}DL$, where
  $\rho $ is the fluid density, L is the cylinder length and D is the cylinder diameter. As only the end conditions are altered between the different test cases studied in this work, parameters related to the experimental set-up in (3.6) (mass ratio,
  ${m^\ast }$, damping coefficient,
  $\zeta $, reduced velocity,
  ${U^\ast }$, and potential added-mass coefficient,
  ${C_A}$) remain constant. Hence, the following relation is valid for the present study:
 \begin{equation}{A^\ast } \propto \frac{{{C_y}\sin \varphi }}{{{f^\ast }}}.\end{equation}
The term  ${C_y}\sin (\varphi )$, which is known as fluid excitation, combines the effects of the magnitude of the transverse force component corresponding to the frequency of body oscillation with its phase difference,
  $\varphi $, relative to body motion, and directly influences the oscillation amplitude. It should also be noted that the frequency ratio,
  ${f^\ast }$, has a reverse relation with amplitude. When considering the effects of a single change in the experimental conditions, such as the change in the end condition, all of the parameters on the right side of (3.7) must be examined.
To better understand the force exerted on the cylinder, it is also useful to examine the concept of the vortex force. Following the analysis of Lighthill (Reference Lighthill1986), the total transverse force  $({F_{tot}})$ acting on the cylinder can be decomposed into a potential force
  $({F_{pot}})$ due to the inertia of the fluid being accelerated by the cylinder's motion and a vortex force component
  $({F_{vor}})$ due to vortex shedding
 \begin{equation}{F_{tot}} = {F_{pot}} + {F_{vor}}.\end{equation}
The instantaneous potential added-mass force,  ${F_{pot}}(t)$, acting on the cylinder is given by the inertial resistance of the mass being displaced by the cylinder's movement
 \begin{equation}{F_{pot}}(t) ={-} {C_A}{m_d}\ddot{y}(t),\end{equation}
where  ${m_d} = \rho ({\rm \pi} {D^2}L/4)$ is the displaced fluid mass. Assuming a sinusoidal motion
  $(y = A\sin (2{\rm \pi} ft))$ and normalizing this force by
  $({\textstyle{1 \over 2}})\rho {U^2}DL$ gives the instantaneous potential force coefficient
 \begin{equation}{C_{pot}}(t) = 2{{\rm \pi} ^3}\frac{{y(t)/D}}{{{{({U^\ast }/{f^\ast })}^2}}}.\end{equation}
It can be seen from the equation above that the instantaneous potential force remains always in phase with the cylinder's motion. It is only due to the vortex force component that there can be a phase difference between the total transverse force and the body motion. The vortex force coefficient can be found by subtracting the potential force coefficient from the total force coefficient:
 \begin{equation}{C_{vor}}(t) = {C_{tot}}(t) - {C_{pot}}(t).\end{equation}
 Typical time traces of cylinder displacement, y/D, in the initial and upper branches are given in figure 7, along with the total transverse force coefficient,  ${C_{tot}}$, its breakdown into the potential added-mass force and the vortex force coefficients,
  ${C_{pot}}$ and
  ${C_{vor}}$, respectively, and the phase difference,
  $\varphi $, between the total transverse force and the body motion. In the initial and upper branches, there were no observed differences in results among the different end conditions considered; therefore, only the results for the unattached endplate at a gap ratio of g* = 2 % are shown in figure 7. In the initial branch, which is known to have two single vortices shed in each cycle (i.e. the 2S mode), both the potential and vortex force components are virtually in phase with the body motion. As a result, the phase difference,
  $\varphi $, between the total force component and the body motion fluctuates around a small value, alternating between positive and negative values. As this phase difference becomes positive or negative, the flux of energy into the body also changes sign (from (3.5) and (3.6)). This results in the repeated increase and decrease of the oscillation amplitude and the beating motion observed in the initial branch (figure 6). In the upper branch, as the vortex shedding mode is 2P/2PO mode, the vortex force goes against the potential force component that remains in phase with the body motion. Ultimately, the phase of the total force with respect to the body motion is determined by the relative strength of these two force components. In the upper branch, as mentioned earlier, the vortex shedding alternates between the 2P mode, during which two pairs of similar-strength vortices are shed in each cycle, and the 2PO mode, during which the second vortex in each pair is weaker than the first. These vortex modes will be discussed in detail in the next section, where vorticity contours in the wake are examined, but the effects of these modes are also apparent from the force diagram in figure 7. At times when the vortex shedding is in 2P mode where strong vortex pairs shed (for example, during t* = 60–70), the vortex force dominates the potential force, and the phase difference between the total force and the cylinder's motion becomes close to 180°. In contrast, when the vortex shedding is in 2PO mode and hence the second vortex of each vortex pair is weaker (for example, during t* = 40–60), the effects of the vortex and potential forces balance each other, resulting in a much lower phase difference between the total force and the cylinder's motion.

Figure 7. (a,b) Typical time traces of body motion, y/D, and transverse force coefficient,  ${C_{tot}}$, (c,d) comparison of the total transverse force coefficient,
  ${C_{tot}}$, potential added-mass force coefficient,
  ${C_{pot}}$, and vortex force coefficient,
  ${C_{vor}}$ and, (e,f) the phase difference,
  $\varphi $, between the total transverse force and the body motion for the initial and upper branches shown in the first and second columns, respectively. The diagrams show examples from the unattached endplate at g* = 2 %, but all other gap ratios yield similar results.
As discussed in the previous section, the oscillation response in the lower synchronization branch shows a clear dependency on the gap ratio, and the reason starts to reveal itself when one looks at the force data provided in figure 8. The case with a small gap ratio (g* = 2 %) is shown in the left column of figure 8. In this case, the total force follows the dominant vortex force component resulting from a strong 2P vortex shedding, which is shown to persist for this case in the next section. Therefore, the total force maintains a constant phase difference of around  $\varphi = 180^\circ $ relative to the body motion. In contrast, the case with a gap ratio of g* = 40 %, shown in the right column, demonstrates a vortex force that becomes intermittently dominant, similar to what was observed for the upper branch, because sometimes the vortex force is larger than the potential force and dominates the movement, the phase difference is around 180°, but other times, the vortex force gets weaker, and as a result, the phase difference reduces significantly. This can be further corroborated by observing the phase angle variations between the total force and the oscillatory motion at various reduced velocities, given in figure 9. In the upper branch, shown in the first row of figure 9, a similar alternating phase difference between the total force and the cylinder's motion exists for both the small and large gap ratios. In this branch, the vortex shedding alternates between the 2P and 2PO modes, as will be shown in the next section. As a result of this, as discussed above, at times of 2P vortex shedding, with the second vortex of each vortex pair being as strong as the first vortex, the vortex force dominates, resulting in a phase difference of around 180° between the total force and the cylinder's motion. However, at times of 2PO, as the vortex shedding has a weaker second vortex in each pair, the vortex and potential forces approach each other in strength, resulting in a much lower phase difference between the total force and the body motion. When the reduced velocity is increased and the lower branch is entered (U* > 7), the case with the small gap ratio (g* = 2 %), which is shown in the left column of figure 9, starts to show a phase difference of around 180°, and this same phase difference persists throughout the entire lower branch (i.e. for all U* in the lower branch). As the flow patterns given in the next section will show, this is related to the immediate switch of the wake mode to the steady 2P mode. In contrast, for the case with the larger gap ratio (g* = 40 %), shown in the right column of figure 9, the transition to the lower branch is pushed to higher reduced velocities, and this transition occurs gradually rather than with an immediate shift. These observations explain the gradual decrease of amplitude with increasing reduced velocity, seen in the lower branch at large gap ratios, rather than an abrupt change (in figure 3).

Figure 8. (a,b) Typical time traces of body motion, y/D, and transverse force coefficient,  ${C_{tot}}$, (c,d) comparison of the total transverse force coefficient,
  ${C_{tot}}$, potential added-mass force coefficient,
  ${C_{pot}}$, and vortex force coefficient,
  ${C_{vor}}$, (e,f) and the phase difference,
  $\varphi $, between the total transverse force and the body motion for the lower branch. Results for the case with the unattached endplate at g* = 2 % and 40 % are shown in the first and second columns, respectively.

Figure 9. Typical time traces of the phase difference  $\varphi $, between the total transverse force and the body motion for various reduced velocities, values of which are given on the left. The first and second columns show the results for the unattached endplate at g* = 2 % and 40 %, respectively.
By returning to (3.7)  $({A^\ast } \propto {C_y}\sin \varphi /{f^\ast })$, the increased amplitudes of oscillation for large gap ratios in the early parts of the lower branch compared with those of lower gap ratios, and then the gradual decrease of the amplitude with increasing reduced velocity toward the amplitudes of lower gap ratios (all of which were observed in figure 3) can be explained. First, as detected in figure 5, the vortex shedding frequency, thereby
  ${f^\ast }$ in (3.7), decreases at a given reduced velocity as the gap gets larger in the initial parts of the lower branch. Second, as seen in figure 9, the average phase difference at a given reduced velocity also decreases from being around 180° at the lower gap ratios to a much lower value with increasing gap in the initial parts of the lower branch (such as at
  ${U^\ast } = 7.01$ or 7.44 in figure 9), which leads to an increase in the excitation force,
  ${C_y}\sin (\varphi )$, for larger gaps compared with smaller gaps. In accordance with (3.7), these changes in
  ${f^\ast }$ and
  ${C_y}\sin (\varphi )$ both tend to increase the oscillation amplitude with increasing gap ratio compared with that of a smaller gap in the early parts of the lower branch. However, as the reduced velocity is increased, and thereby the later parts of the lower branch are entered, these effects of the gap ratio on
  ${f^\ast }$ and
  ${C_y}\sin (\varphi )$ start to fade (as seen in figures 5 and 9), and as a result, the oscillation amplitudes of larger gap ratios get closer to that of the lower gap ratio.
4. Flow structure
So far, the force analyses presented in the previous section could partially explain the reason behind the observed differences in cylinder oscillations for various end conditions mainly by looking at the lift force relative to the body motion. However, one could further ask why the lift force changes the way it does. To gain further insight into the physical reason behind end effects, it is necessary to examine the wake flow structures and the vortex shedding patterns associated with each branch for different end conditions. As explained by Williamson & Roshko (Reference Williamson and Roshko1988), the transverse acceleration of the cylinder during each half-cycle leads to the roll-up of two shear layers close to the body. These vortices initially remain attached to the body, convecting around it until they reach the area from where they ultimately shed downstream. These vorticity regions interact with each other, merging, splitting and forming pairs as they separate from the body, leading to the familiar vortex shedding modes. Among the major factors influencing these interactions are the timing and spacing between these vorticity regions, which can be characterized by
 \begin{equation}\frac{U}{{{f_d}D}} = \frac{\lambda }{D}.\end{equation}
The left-hand side of (4.1) should not be confused with the reduced velocity, U*, where the natural frequency, fn, of the oscillator is used. Here,  ${f_d}$ is the displacement frequency of the cylinder, which is equal to the vortex shedding frequency,
  ${f_v}$, in VIV, and
  $\lambda $ can be regarded as the wavelength of the cylinder's trajectory as if the cylinder is dragged in still water, similar to what is done in a towing tank facility. As
  $\lambda $ increases, the vortices effectively have more time to reach the wake region, either because the trajectory is longer or the vortices separate more slowly. Figure 10 gives the variation of
  $\lambda /D$ with U* for different endplate gap ratios. As the free-stream velocity (and thereby U*) increases and the cylinder response moves from the initial branch to the upper branch and then to the lower branch,
  $\lambda $ constantly increases because the oscillation frequency,
  ${f_d}$, does not grow at the same rate as the free-stream velocity, U (in accord with (4.1)). This increase in wavelength,
  $\lambda $, effectively gives the shear layer rolling out of the cylinder more time to reach the wake region. This, in turn, leads to a shift in the timing and spacing between vortices, resulting in different vortex shedding modes in different oscillation branches, which will be examined closely within this section.

Figure 10. Variation of the non-dimensional wavelength of the cylinder's trajectory,  $\lambda /D$, against reduced velocity,
  ${U^\ast }$, for varying gap ratios. Here, g* = 0 % corresponds to the case with the attached endplate, and g* = 280 % depicts the gap ratio between the cylinder and the channel floor for the free-ended cylinder. The gap ratios in the range of
  $2\,\%\le {g^\ast } \le 40\,\%$ involve an unattached endplate. As the variation of
  $\lambda /D$ with
  ${U^\ast }$ coincided for
  ${g^\ast } \ge 24\,\%$, these cases are shown with a single line in the plot for clarity.
In the first part of this section, PIV data obtained in the near wake of the cylinder at its midspan plane are discussed to identify the main vortex shedding modes for each end condition. In the second part, the three-dimensional effects of the cylinder end conditions that lead to the differences seen so far in the oscillation response of the cylinder for different gap ratios are discussed by examining the near-wake PIV data along the span of the cylinder.
4.1. Wake modes
First, the case of an unattached endplate with a small gap ratio of g* = 2 % is assessed here for wake modes in each response branch. As observed from the amplitude response data in figure 3, there is no significant difference in cylinder oscillations between this end condition (i.e. g* = 2 %) and the end condition with an attached end plate, which is the most studied case in the literature. Thus, the unattached endplate with g* = 2 % will serve as a baseline scenario with which the higher gap ratios can be compared. Figures 11, 12 and 14 show contours of phased-averaged vorticity,  ${\langle \omega \rangle _p}D/U$, in the wake of the free-oscillating cylinder for the unattached endplate condition with the small gap ratio of g* = 2 % in the initial, upper and lower branches, respectively. In each of these figures, (a) depicts the reference time,
  ${t_0}$, which corresponds to the time when the cylinder passes the centreline (i.e. y/D = 0 location), moving in the positive y direction, while (b–d) correspond to the subsequent quarter periods in the oscillation cycle, where the symbol T denotes the full period of the body oscillation. The extent of the displacement of the cylinder's centre is marked by a thick dashed line on the vertical axis in each plot, and the direction of the cylinder's movement is illustrated by an arrow placed on the image of the cylinder when appropriate.

Figure 11. Phase-averaged contours of vorticity,  ${\langle \omega \rangle _p}D/U$, in the initial branch
  $({U^\ast } = 4.05,\; Re = 4000)$ for the cylinder end condition of the unattached endplate placed at the small gap ratio of g* = 2 %. The patterns indicate the 2S vortex shedding mode. Here,
  ${t_0}$ is the time when the cylinder passes the centreline (i.e. y/D = 0 location) in the positive y direction, and each consecutive plot is separated by a quarter period in the oscillation cycle; (a) t = t 0, (b) t = t 0 + T/4, (c) t = t 0 + T/2 and (d) t = t 0 + 3T/4.

Figure 12. Phase-averaged contours of vorticity,  ${\langle \omega \rangle _p}D/U$, in the upper branch
  $({U^\ast } = 5.74,\; Re = 5660)$ for the cylinder end condition of the unattached endplate placed at the small gap ratio of g* = 2 %. The patterns correspond to intermittently switching 2PO/2P vortex shedding modes. Here,
  ${t_0}$ is the time reference point when the cylinder passes the centreline (i.e. y/D = 0 location) in the positive y direction, and each consecutive plot is separated by a quarter period in the oscillation cycle; (a) t = t 0, (b) t = t 0 + T/4, (c) t = t 0 + T/2 and (d) t = t 0 + 3T/4.
In figure 11(a), as the cylinder moves up, two vortices, marked as vortex A and B, are distinguishable near the cylinder. Vortex A is a remnant of the previous cycle, fully formed and separated at time  ${t_0}$, while vortex B is newly forming by the clockwise vorticity convecting around the cylinder. As the cylinder accelerates downward from figure 11(b,c), the clockwise vorticity convecting from the cylinder continues to get fed into vortex B, resulting in a stronger vorticity region in figure 11(c). Meanwhile, the counterclockwise vortex from the cylinder forms a new vortex, marked as vortex C in figure 11(c). As the cylinder moves to figure 11(d), vortex B separates, while the newly forming vortex C remains attached to the cylinder. Similarly, as the cylinder accelerates in the +y direction from figure 11(d) back to figure 11(a), vortex C grows in size with the counterclockwise vorticity shedding from the cylinder, resulting in a stronger vorticity region (marked as vortex A in figure 11a), which ultimately separates from the cylinder when the cylinder passes the centreline. Over this entire oscillation cycle, two single vortices per cycle appear in the wake, producing the narrow vortex street known as the 2S mode.
In the upper branch given in figure 12, with an increase in the wavelength of the cylinder's trajectory,  $\lambda $, the vortices convect to the wake region much sooner in the oscillation cycle than they do in the initial branch. Therefore, at the y/D = 0 location in figure 12(a), the vortex A from the previous cycle is already convected further downstream, while the newly forming vortex B is right behind the cylinder. As the cylinder moves up (from figure 12a,b), the shear layer with counterclockwise vorticity keeps rolling directly into vortex B, creating a stronger region of vorticity. This vortex is separated as the cylinder reaches its maximum displacement in figure 12(b). Notice that, in comparison, the separation of the first new vortex of the cycle (vortex B) happens much later in the initial branch (i.e. it occurs in figure 11(c), which is a quarter cycle later than that in the upper branch). Likewise, the vortex forming from the opposite side of the cylinder, vortex C, convects around the cylinder more efficiently in the upper branch compared with the initial branch due to two effects. First,
  $\lambda $ is larger, giving the shear layer vorticity effectively more time to convect, and secondly, the large vorticity of vortex B essentially pulls it towards the wake. Again, as the cylinder goes down (from figure 12c,d), the shear layer with counterclockwise vorticity from the cylinder rolls into vortex C, which separates at the maximum negative displacement point in figure 12(d). In comparison, this separation does not happen until the cylinder returns to its y/D = 0 position in the initial branch (figure 11a).
After a first glance at figure 12, one might think the overall vortex shedding mode of the upper branch seems similar to the 2S mode of the initial branch observed previously in figure 11, only that the vortex street is much wider as the cylinder displacement is significantly larger and the vortices are shed at the displacement extrema rather than the centreline (around y/D = 0). However, the phased-averaged results presented in figure 12 cannot depict the complete picture for the upper branch as the vortex shedding mode in this branch is known to alternate between the 2P and 2Po modes (Morse & Williamson Reference Morse and Williamson2009). Previously, in figure 7, the phase difference between the total transverse force and the body oscillations in the upper branch was observed to alternate between being around 180° and much lower values, which is a result of this alternation. Therefore, figure 13 is provided, which shows the contours of instantaneous vorticity,  $\omega D/U$, for three separate instances (
 ${t_1},{t_2}$ and
  ${t_3}$). In these instances, the cylinder is at its maximum negative displacement point, just starting to move upwards in the +y direction. At time
  ${t_1}$, as seen in figure 13, a pair of vortices (marked as A and B) are shed, and another pair is formed on the opposite side of the cylinder. Hence,
  ${t_1}$ falls into the period during which 2P vortex shedding occurs. Notice also that, at this time, the phase difference between the total transverse force and the body motion is around 180°, as marked on the time history of the phase angle difference given in the same figure. As the most distinctive feature of the 2Po mode from the 2P mode, it is known that the 2Po mode exhibits a much weaker second vortex compared with the first vortex in each vortex pair (Morse & Williamson Reference Morse and Williamson2009). Times
  ${t_2}$ and
  ${t_3}$, in figure 13, show the case of 2Po vortex shedding, where the second vortex is much weaker than the first. It should be noted that, during the tests, the second weaker vortex in the 2Po mode was observed to have varying strength from cycle to cycle. Sometimes, it could be detected (such as the instant at
  ${t^\ast } = {t_2}$ in figure 13), while other times, it could not even be perceived within the PIV resolution (such as the instant at
  ${t^\ast } = {t_3}$ in figure 13). Also, a further noticeable feature of the 2Po mode is that the phase difference of the lift force from the oscillatory motion is significantly lower in these instances, as marked on the phase angle history in figure 13. A general inspection of figure 13 shows that the phase difference between the transverse force and the cylinder's motion changes between high and low values, which is related to the intermittent switching of vortex structures between the 2P and 2Po vortex shedding modes in the upper branch. As expressed earlier by (3.7), the amplitude of oscillations is proportional to the sine of the phase angle difference between the total lift force and the cylinder's motion. The varying nature of this phase angle between high and low values in the upper branch results in an average phase difference close to
  $\varphi = 90\mathrm{^\circ }$, leading to the highest oscillation amplitude for this branch, in accord with (3.7). On the other hand, the average phase difference is around
  $\varphi = 0\mathrm{^\circ }$ for the initial branch (as seen in figure 7) and
  $\varphi = 180\mathrm{^\circ }$ for the lower branch (as seen in figure 8), the sine of which results in lower oscillation amplitudes.

Figure 13. Instantaneous contours of vorticity,  $\omega D/U$, in the upper branch
  $({U^\ast } = 5.74,\; Re = 6660)$ for the cylinder end condition of the unattached endplate placed at the small gap ratio of g* = 2 % (top row) and the time history of the phase difference between the lift force and the body motion (bottom row). Here,
  ${t_1}$,
  ${t_2}$ and
  ${t_3}$ show selected instances where the cylinder is at its maximum negative displacement (i.e. the furthest position in the cycle in the -y direction). The patterns depict that the vortex shedding mode is 2P at
  ${t_1}$ and switches to 2PO at
  ${t_2}$ and
  ${t_3}$.
In the lower branch, the 2P vortex shedding is clearly distinguishable from figure 14, where the contours of phased-averaged vorticity,  ${\langle \omega \rangle _p}D/U$, are provided. In this case, the higher flow velocities mean that the rolled-up shear layers stretch and convect around the cylinder even earlier in the cycle. As a result, vortex B has already reached the opposite side of the wake in figure 14(a). In fact, as the cylinder moves upwards, part of vortex B is attached to the cylinder, and part of it is attracted by vortex A. As a result of the high strain rate within the vorticity region (Govardhan & Williamson Reference Govardhan and Williamson2000), vortex B splits. One part pairs with vortex A and moves downstream, while the other part remains connected to the cylinder, eventually causing the next vortex (vortex C) to split. This arrangement of vortices leads to the 2P mode, in which two pairs of similar-strength vortices are shed downstream in each cycle.

Figure 14. Phase-averaged contours of vorticity,  ${\langle \omega \rangle _p}D/U$, in the lower branch
  $({U^\ast } = 7.44,\; Re = 7335)$ for the cylinder end condition of the unattached endplate placed at the small gap ratio of g* = 2 %. The patterns indicate the 2P vortex shedding mode. Here,
  ${t_0}$ is the time reference point when the cylinder passes the centreline (i.e. y/D = 0 location) in the positive y direction, and each consecutive plot is separated by a quarter period in the oscillation cycle; (a) t = t 0, (b) t = t 0 + T/4, (c) t = t 0 + T/2 and (d) t = t 0 + 3T/4.
To summarize, as the cylinder accelerates in each half-cycle, the shear layers coming from the sides of the cylinder roll up and create vorticity regions, which convect around the cylinder before separating in the next half-cycle. It is the timing of these vortical structures and their interaction with the shear layers that determine the vortex shedding mode. In the initial branch, where the wavelength of the cylinder's trajectory,  $\lambda $, has a low value, each vorticity region reaches the wake later in the cycle compared with the other branches. As a result, being unaffected by the preceding vortex that has already formed and shed from the opposite side of the cylinder half a cycle ago, a newly forming vortex in the near wake continues to grow by the shear layer coming from the cylinder with same-sign vorticity and eventually separates. Thereby, in every oscillation cycle, two vortices are shed half a cycle apart, which leads to the 2S vortex shedding mode. In the upper branch, with increased wavelength, λ, the vortices reach the wake relatively sooner in the cycle. Depending on the timing of vortices, one of two bistable vortex structures forms. (i) In one case, the vortices reach downstream of the cylinder with perfect timing, meaning they arrive early enough to merge with the vorticity regions created by the cylinder acceleration and get strong enough to separate at the maxima of the cylinder's motion while still being late enough in the cycle so that they split into a weaker vortex by the previous vortex. This delicate balance in vortex timing results in the 2Po mode. (ii) The other case is when vortices arrive slightly earlier in the cycle and get split by the previous vortex, yielding the 2P vortex shedding mode. Finally, in the lower branch, where λ is much larger, every newly forming vortex reaches the wake region even sooner. Being affected by the vortex formed and shed earlier, it always splits in half, forming a stable 2P vortex street.
It was observed in figures 3 and 6 that the end condition does not have a significant effect on the initial and upper branches. Hence, as expected, the flow structures for various gap ratios also reflected this behaviour. As they were similar to what has been depicted for the case of g* = 2 %, given in figures 11–13, near-wake flow patterns in the initial and upper branches for other gap ratios are not repeated here. In the lower branch, however, the near-wake flow characteristics significantly differ when the gap ratio is altered. Figures 15 and 16 illustrate the contours of phased-averaged vorticity,  ${\langle \omega \rangle _p}D/U$, at g* = 40 % for two different points in the lower branch. The beginning of the lower branch,
  ${U^\ast } = 7.44$, is shown in figure 15, while a higher reduced velocity
  $({U^\ast } = 10.4)$ further down in the branch is given in figure 16. Interestingly, for
  ${U^\ast } = 7.44$, an intermittent 2Po/2P vortex shedding mode is observed for g* = 40 % (as apparent from the similarity of the phase-averaged vorticity patterns between figures 15 and 12), while a stable 2P mode was prominent at the same
  ${U^\ast }$ for the smaller gap ratio of g* = 2 %, as shown in figure 14. As the flow velocity is increased, the second vortex gets progressively stronger. Vorticity patterns depicting this trend were obtained but are not shown here for brevity. Towards the end of the lower branch, at
  ${U^\ast } = 10.4$ (shown in figure 16), a clear and stable 2P vortex shedding is achieved. These findings are also supported by the results from the force analysis presented earlier in figure 9, and, once again, indicate that, when the gap ratio is increased, the transition from the upper branch (with its intermittent 2Po/2P vortex shedding mode) to the lower branch (with its steady 2P mode) shifts to higher reduced velocities, and this shift occurs gradually over a range of
  ${U^\ast }$ rather than being abrupt.

Figure 15. Phase-averaged contours of vorticity,  ${\langle \omega \rangle _p}D/U$, in the lower branch
  $({U^\ast } = 7.44,\; Re = 7335)$ correspond to intermittently switching 2PO/2P vortex shedding modes for
  ${g^\ast } = 40\,\%$. Here,
  ${t_0}$ is the time reference point when the cylinder passes the centreline (i.e. y/D = 0 location) in the positive y direction, and each consecutive plot is separated by a quarter period in the oscillation cycle; (a) t = t 0, (b) t = t 0 + T/4, (c) t = t 0 + T/2 and (d) t = t 0 + 3T/4.

Figure 16. Phase-averaged contours of vorticity,  ${\langle \omega \rangle _p}D/U$, in the lower branch
  $({U^\ast } = 10.4,\; Re = 10\;258)$ indicating the 2P vortex shedding mode for
  ${g^\ast } = 40\,\%$. Here,
  ${t_0}$ is the time reference point when the cylinder passes the centreline (i.e. y/D = 0 location) in the positive y direction, and each consecutive plot is separated by a quarter period in the oscillation cycle; (a) t = t 0, (b) t = t 0 + T/4, (c) t = t 0 + T/2 and (d) t = t 0 + 3T/4.
4.2. Three-dimensional effects
In the previous section, the vortex shedding modes encountered at the mid-span of the cylinder have been established for each synchronization branch, and how these modes are affected by the end conditions has been discussed. These results showed that the gap ratio significantly influences the lower branch in particular. To investigate the cause, this section will explore the spanwise variation in flow features for the lower branch. Figure 17 shows the contours of phase-averaged vorticity,  ${\langle \omega \rangle _p}D/U$, for the vertical plane behind the cylinder at y/D = −0.6. This data acquisition plane was illustrated earlier in figure 2. In figure 17, the situation for two gap ratios (g* = 2 % and 32 %) is depicted in the lower branch for four consecutive quarter periods in the oscillation cycle, starting from the time
  ${t_0}$, which marks the time when the cylinder passes the y/D = 0 position with a positive velocity. For the small gap ratio of g* = 2 %, shown in the top row, there is a small counterclockwise vorticity near the base of the cylinder, but it is weak and dissipates quickly without much effect on the downstream flow. On the other hand, for the case of g* = 32 %, shown on the bottom row, the flow stream coming through the gap rolls up behind the cylinder and creates a much stronger vortex. This counterclockwise vortex travels downstream over the oscillation cycle, affecting a much larger area behind the cylinder. The difference in the spanwise extent of the wake region affected by the gap flow can be observed clearly in figure 18, which illustrates the contours of time-averaged streamwise velocity,
  $\langle u\rangle /U$, for various gap ratios. At the smallest gap ratio of g* = 2 %, the streamwise velocity stays constant across the span, but at higher gap ratios, there is a large-magnitude streamwise flow stream coming through the gap, indicated by the red contours, that stays close to the endplate. Furthermore, due to the formation of the strong counterclockwise vortex discussed in figure 17, there is also a sizable region of lower-magnitude streamwise velocity directly behind the cylinder, indicated by the blue contours. As the gap ratio increases, the spanwise reach of this streamwise velocity (i.e. the blue contours) increases, affecting larger portions of the span downstream of the cylinder. This low-magnitude streamwise velocity region reaches its maximum spatial extent in the spanwise direction when the gap ratio is set to g* = 32 %, where the stream caused by the gap affects around 45 % of the span.

Figure 17. Phase-averaged contours of vorticity,  ${\langle \omega \rangle _p}D/U$, in the vertical plane behind the cylinder. Here,
  ${t_0}$ is the time reference point when the cylinder passes the centreline with positive velocity, and each consecutive plot is separated by a quarter period of oscillation. The first and second rows show results for a gap ratio of
  ${g^\ast } = 2\,\%$ and 32 %, respectively, in the lower branch (at
  ${U^\ast } = 8.70$ and
  $Re = 8588$). (a,e)
  $t= t_{0}$, (b,f)
  $t= t_{0} + T_{n}/4$, (c,g)
  $t= t_{0} + T_{n}/2$, (d,h)
  $t= t_{0} + 3T_{n}/4$.

Figure 18. Time-averaged contours of the streamwise velocity component, $\langle \; u\rangle/U$, in the vertical plane behind the cylinder. The plot shows various gap ratios in the lower branch at
  ${U^\ast } = 8.70$ and
  $Re = 8588$. As the gap ratio increases, larger portions of the span are affected by the lower-velocity region (seen as blue contours) behind the cylinder. (a)
  $g^{\ast} =2 \%$, (b)
  $g^{\ast} =8 \%$, (c)
  $g^{\ast} =16 \%$, (d)
  $g^{\ast} =32 \%$
Figure 19 depicts the contour patterns of phase-averaged vorticity,  ${\langle \omega \rangle _p}D/U$, in two horizontal planes z/D = 3.5 and 5.25, along with the contours of phase-averaged streamwise velocity,
  ${\langle u\rangle _p}D/U$, in the vertical plane y/D = −0.6 for two gap ratios, g* = 2 % and 40 %, of the unattached plate. From figure 19(a), where the gap ratio is only 2 %, it is apparent that there is no spanwise variation in the streamwise flow velocity, and both horizontal planes clearly show a pair of vortices with similar strength, marked as A and B1, travelling downstream on one side of the cylinder's wake while two additional vortices, marked as B2 and C, are forming during the given phase, indicative of the 2P vortex shedding mode in both horizontal planes. In figure 19(b), however, where the gap ratio is 40 %, it can be observed from the streamwise velocity contours of the vertical plane that the increased gap ratio between the cylinder and the endplate causes an area of lower streamwise velocity to form in the lower half of the cylinder's wake. For this gap ratio of g* = 40 %, although the higher horizontal plane (z/D = 5.25) is outside of this low-magnitude streamwise velocity region and thus is unaffected by the gap flow, the lower horizontal plane (z/D = 3.5) is well within this region. Consequently, while the higher horizontal plane (z/D = 5.25) has transitioned to the lower synchronization branch and is thereby showing an equally strong pair of vortices (marked as A and B1) on one side of the wake with the other vortex pair (B2 and C) of the 2P vortex mode forming, the lower plane (z/D = 3.5) effectively sees lower streamwise velocities and, thereby, it has not transitioned to the lower branch just yet. As a result, the phase-averaged vorticity pattern in the lower horizontal plane is undergoing the 2PO vortex shedding mode with a much weaker second vortex. The overall force applied to the cylinder is the sum of the forces acting over the entire span. Hence, the spanwise wake region with the lower streamwise velocity, where the 2PO vortex shedding mode persists, reduces the overall phase difference between the force and the body motion, leading to a higher oscillation amplitude (in accord with (3.7)). Effectively, the area of lower streamwise velocity delays the transition in vortex mode for the large gap ratio of g* = 40 % because a considerable portion of the span is seeing lower velocities. Nevertheless, for higher reduced velocities, larger portions of the span will eventually transition to the lower branch due to increased flow velocities. Accordingly, the large region of lower streamwise velocity forming as a result of large cylinder-endplate gaps explains both the gradual upper-to-lower branch transition associated with large gap ratios (seen in figures 1(b) and 3) and the fact that, at high enough flow velocities, the end condition effects start to diminish (observed in figures 3 and 4).

Figure 19. Phase-averaged contours of streamwise velocity component,  ${\langle u\rangle _p}/U$, in the vertical y/D = −0.6 plane behind the cylinder and phased-averaged contours of vorticity,
  ${\langle \omega \rangle _p}/U$, at two horizontal planes z/D = 3.5 and 5.25: (a) for the gap ratio of
  ${g^\ast } = 2\,\%$ and (b)
  ${g^\ast } = 40\,\%$. The arrow placed in the -y direction on the cylinders shows the direction of movement of the cylinder at the specific phase considered. The measurements are for
  ${U^\ast } = 8.70$ and
  $Re = 8588$ in the lower branch. (a) Unattached endplate g* = 2 % and (b) unattached endplate g* = 40 %.
5. Conclusions
This study investigated the effects of end conditions on vortex-induced oscillations of a flexibly mounted cylinder. While all other experimental conditions were kept constant, three commonly used end conditions were assessed. Namely, an attached endplate, an unattached endplate fixed to the channel floor with a variable gap from the cylinder end and the free-ended cylinder with no endplate at all. All three response branches are examined, with the reduced velocity sweeping  $2 \le {U^\ast } \le 15$, resulting in a Reynolds number range of
  $2000 \le Re \le 14\;700$ based on the cylinder diameter. It is found that the cylinder oscillations in the initial and upper branches are mainly unaffected by the type of end conditions used. However, in the lower synchronization branch, the body oscillations depend heavily on the gap left between the end of the cylinder and the closest boundary (endplate or the channel floor), which is given in non-dimensional form as the gap ratio,
  ${g^\ast } = $ gap/cylinder diameter. The time traces of cylinder oscillations in the lower branch are more stable for low gap ratios, whereas they show an increase in amplitude and modulations in body motion for larger gap ratios. Furthermore, for very low gap ratios, which include cases with an attached endplate as well as an unattached endplate placed at a small distance from the cylinder end, there is a sudden decrease in the amplitude of body oscillations during the upper-to-lower branch transition, with the lower branch maintaining a near-constant amplitude throughout the lower branch as the reduced velocity is increased. However, for larger gap ratios, which include cases where the cylinder is either free ended or placed at a large distance from an endplate, the oscillation amplitude reduces gradually from its peak value as the reduced velocity is increased without any discernible sign of sudden transition to the lower branch. The shift between these two distinct upper-to-lower branch transitional behaviours for the free-oscillating cylinder appears gradually in the gap ratio range of
  $4\,\%< {g^\ast } \le 16\,\%$. In other words, for an unattached endplate to have similar effects to an attached endplate in the lower synchronization branch, the gap ratio needs to be
  ${g^\ast } \le \; 4\,\%$. On the other hand, for
  ${g^\ast } > 16\,\%$, the cylinder vibrates as if it is free ended.
The cause for the observed differences in oscillation characteristics for the lower synchronization is shown to be the three-dimensional effects of the gap region between the cylinder end and the endplate. The tip vortex forming downstream of the gap induces a large region of low-magnitude streamwise velocity behind the cylinder. While the cylinder span outside of this low-velocity region transitions to the lower branch, depicting a steady 2P vortex shedding, the spanwise region falling within this region continues to experience an intermittent 2P/2PO vortex shedding mode where the transition to the lower branch is delayed to much higher flow velocities (i.e. postponed to the later parts of the lower branch). The strength of the tip vortex and the spanwise extent of this low-velocity region heavily depend on the gap between the cylinder and the end boundary. As the gap ratio is varied, the following occurs in the lower branch:
1. In the early parts of the lower branch
1.1. As the gap ratio is increased, an increasingly larger portion of the cylinder span effectively experiences the gap-induced low streamwise velocities behind the cylinder where the intermittent 2P/2PO vortex shedding persists. The overall body motion is controlled by the sum of the lift forces acting across the entire cylinder span. As a larger spanwise portion of the cylinder sheds vortices with intermittent 2P/2PO mode, the overall phase angle difference between the fluid force and the body motion fluctuates between 180° and lower values due to the intermittency of the vortex shedding mode. This leads to a higher excitation force on average and produces larger oscillation amplitudes.
1.2. When the gap ratio is reduced, larger portions of the cylinder span fall out of the gap-induced low-velocity region, and hence, a stable 2P mode is observed over the majority of the cylinder span. Consequently, the overall phase angle difference between the total force and the body motion remains around 180°, reducing the excitation force and, thereby, the oscillation amplitude.
2. In the later parts of the lower branch
Regardless of the gap ratio, the effects of the end conditions on cylinder oscillations fade away at high enough reduced velocities, meaning when the later parts of the lower synchronization branch are entered. This is because, at increased flow velocities, larger portions of the cylinder span transition to the lower branch, experiencing a stable 2P mode that tends toward an overall phase angle difference of around 180° irrespective of the gap ratio.
The present work suggests that the end conditions should be considered carefully when investigating flow-induced vibrations in the lower branch as, in this branch, there are significant end condition effects on amplitude, frequency and the overall response characteristics. A gap less than or equal to 4 % of the cylinder diameter is recommended to eliminate the end effects on body oscillations and promote two-dimensional flow. On the other hand, for an accurate representation of free-ended cylinder applications in a laboratory environment, a gap of more than 16 % of the cylinder diameter is necessary between the cylinder and the closest boundary. On a practical level, since free-ended cylinder arrangements produce higher-amplitude vibrations in the lower branch, in VIV-based energy harvesting applications, the use of free-ended systems would enhance energy extraction.
Declaration of interests
The authors report no conflict of interest.


 Open access