1. Introduction
Ocean surface waves induce surface turbulent mixing and moderate the exchange of heat, materials and momentum between the atmosphere and the ocean (Sullivan & McWilliams Reference Sullivan and McWilliams2010). Waves can produce turbulence even without breaking, a representative process being Langmuir circulations (LCs) (Langmuir Reference Langmuir1938). LCs are roll-shaped flow structures aligned with wave direction, often turbulent, and visualised through the streaks of flotsam accumulated on the convergence zones. They are considered to arise through the instability of a vertically sheared current under the influence of the wave-associated Stokes drift. Its dynamics are described in a wave-averaged framework called the Craik–Leibovich (CL) equation (Craik & Leibovich Reference Craik and Leibovich1976), and the instability is called the CL2 mechanism (Leibovich Reference Leibovich1983). The instability condition requires that the Eulerian current shear ${\partial \bar {u}^{E}}/{\partial z }$ and the Stokes drift shear ${\partial u ^{St}}/{\partial z }$ have the same sign. Here, $\bar {u}^{E}$ is wave-averaged Eulerian current, $u^{{\textit{St}}}$ is the Stokes drift and $z$ is the vertical coordinate with positive upwards. This sheared Eulerian current is commonly considered to originate from wind stress, which is aligned with the Stokes drift direction in most cases. Belcher et al. (Reference Belcher2012) estimated the LCs’ contributions to the ocean surface mixing based on the CL theory and suggested that the Langmuir mixing plays a major role in many parts of the ocean.
Although the turbulence production by the CL2 mechanism requires the influence of wind, some studies report that waves produce turbulence even without wind, a phenomenon often termed ‘non-breaking wave-induced turbulence’. To distinguish from LCs, it is hereinafter called ‘windless’ (WL) turbulence in this article. Multiple laboratory studies support the presence of WL turbulence, demonstrating turbulence growth under waves generated by a wavemaker (Babanin & Haus Reference Babanin and Haus2009; Dai et al. Reference Dai, Qiao, Sulisz, Han and Babanin2010; Savelyev, Maxeiner & Chalikov Reference Savelyev, Maxeiner and Chalikov2012). The mechanism for this phenomenon was originally proposed to be the turbulence transition of the wave orbital motion (Babanin Reference Babanin2006), and parameterisations were developed for large-scale ocean models based on this idea (Pleskachevsky et al. Reference Pleskachevsky, Dobrynin, Babanin, Günther and Stanev2011). Wu, Rutgersson & Sahlée (Reference Wu, Rutgersson and Sahlée2015) estimated the contribution of WL turbulence to the ocean surface mixing based on this parameterisation and concluded that it has a major influence on the total turbulence production. However, the validation of the WL turbulence production mechanism has been limited in both theoretical and experimental aspects, leading to questions raised against the validity of the turbulence transition hypothesis (e.g. D'Asaro Reference D'Asaro2014). Furthermore, Villas Bôas et al. (Reference Villas Bôas2019) points out the unclarity in the distinction between WL turbulence and LCs. Clarifying the WL turbulence production mechanism is crucial for developing a parameterisation scheme widely accepted by the modelling community and integrating the two phenomena branches to accurately model wave-induced mixing.
The advancement of numerical modelling and computational resources have enabled us to directly solve the Navier–Stokes equation in free-surface configurations. In such numerical studies, we can strictly control the wind and wave conditions and analyse the three-dimensional structure of turbulence, both of which are difficult in laboratory and field measurements. Tsai et al. (Reference Tsai, Chen, Lu and Garbe2013) studied the water turbulence under wind- and wave-forced conditions and its contribution to gas exchange across the water surface, using the fully nonlinear free surface model described in Tsai & Hung (Reference Tsai and Hung2007). A similar situation is also studied by Tsai & Lu (Reference Tsai and Lu2023) with an even more sophisticated analysis of the multiscale vortex structures in the water. Yang & Shen (Reference Yang and Shen2011a) similarly developed a fully nonlinear free-surface model, and in the accompanying paper (Yang & Shen Reference Yang and Shen2011b) they proposed a method to dynamically couple multiple domains to simulate two-phase flow with a deformable interface. Xuan & Shen (Reference Xuan and Shen2019) proposed an improved scheme for the water-side simulation using flux-form formulation. Guo & Shen (Reference Guo and Shen2013, Reference Guo and Shen2014) studied the vorticity kinematics and the turbulence dynamics of turbulence produced by external forcing in the subsurface layer and its interaction with the surface wave motions. Xuan, Deng & Shen (Reference Xuan, Deng and Shen2019) also conducted a detailed dynamical analysis of Langmuir turbulence driven by the surface shear stress and wave motions. Wang & Özgökmen (Reference Wang and Özgökmen2018), Fujiwara, Yoshikawa & Matsumura (Reference Fujiwara, Yoshikawa and Matsumura2018) and Fujiwara & Yoshikawa (Reference Fujiwara and Yoshikawa2020) compared the wave-resolving simulation results with the CL equation to study the dynamics of LCs.
Among such studies, Tsai et al. (Reference Tsai, Lu, Chen, Dai and Phillips2017) and Fujiwara, Yoshikawa & Matsumura (Reference Fujiwara, Yoshikawa and Matsumura2020) have provided new insights into the connection between the mechanisms of the WL turbulence and the LCs. These studies suggest that the near-surface shear flow, known as the Eulerian mean drift, plays a central role in turbulence production. Longuet-Higgins (Reference Longuet-Higgins1953) considered the mass transport (Lagrangian) velocity of the waves under an influence of weak viscosity and demonstrated that the vertical shear of the mass transport velocity near the surface would be twice as much as the Stokes drift shear: ${\partial (\bar {u}^{E}+u^{{\textit {St}}})}/{\partial z }=2{\partial u ^{{\textit {St}}}}/{\partial z }$. This Eulerian shear formation is understood through the momentum transfer from the surface waves attenuating due to water viscosity. Consider a small-amplitude, monochromatic deep-water wave with gravitational acceleration $g$, water density $\rho _{o}$, water kinematic viscosity $\nu _{o}$, amplitude $a(t)$, wavenumber $k$ and angular frequency $\sigma$, where the viscous influence is sufficiently small that $\sigma =(gk)^{1/2}$ and $a^{-1}{\textrm {d} a}/{\textrm {d} t}\ll \sigma$. Lamb (Reference Lamb1932) showed that the amplitude attenuation rate $\gamma \equiv -a^{-1}{\textrm {d} a}/{\textrm {d} t}$ for such a wave would be
where $ {\textit {Re}}_{o}\equiv \sigma k^{-2}/\nu _{o}$ is the water-side Reynolds number based on wavenumber and wave phase speed. The potential motion of the wave conveys horizontal momentum of $M_{o}\equiv \rho _{o} g \sigma a^2/2$ per unit horizontal area. When the waves attenuate following (1.1), $-{\textrm {d} M_{o}}/{\textrm {d} t}$ per unit area must be transformed to the Eulerian current. This can be only achieved via the viscous diffusion from the surface boundary layer. Therefore, the following amount of horizontal momentum is received by the Eulerian current (e.g. Phillips Reference Phillips1966):
This viscous momentum flux was called ‘virtual wave stress’ by Longuet-Higgins (Reference Longuet-Higgins1969), providing a boundary condition for $\bar {u}^{E}$ as ${\partial \bar {u}^{E}}/{\partial z }={\partial u ^{{\textit {St}}}}/{\partial z }$.
The importance of the Eulerian mean drift was elucidated by the wave-resolving direct numerical simulations (DNS). Tsai, Chen & Lu (Reference Tsai, Chen and Lu2015); Tsai et al. (Reference Tsai, Lu, Chen, Dai and Phillips2017) and Fujiwara et al. (Reference Fujiwara, Yoshikawa and Matsumura2020) used free-surface models that explicitly solve the deformable surface motion under the fully nonlinear boundary conditions, considering that the surface does not overturn. They all reproduced elongated streamwise vortices as was observed in the tank experiment by Savelyev et al. (Reference Savelyev, Maxeiner and Chalikov2012). First, Tsai et al. (Reference Tsai, Chen and Lu2015) conducted a simulation of propagating surface waves over a turbulence field and observed a significant growth of initial turbulence. The resulting flow field showed vortical structures with a growth rate consistent with the model of Teixeira & Belcher (Reference Teixeira and Belcher2002) based on the rapid distortion theory. Tsai et al. (Reference Tsai, Lu, Chen, Dai and Phillips2017) further investigated the streamwise vortices with an increased number of simulations and compared their structure with the linear stability analysis of the CL equation. When the Eulerian current shear is provided by the theory of Longuet-Higgins (Reference Longuet-Higgins1953), the theoretically predicted spanwise wavenumber of the fastest growth mode was close to that of the simulated streamwise vortices. Then, Fujiwara et al. (Reference Fujiwara, Yoshikawa and Matsumura2020) compared a low-Reynolds number wave-resolving DNS and its wave-averaged counterpart using the CL equation with and without virtual wave stress effect. As a result, the temporal evolution of vertical circulation in wave-resolving DNS was very well-reproduced with the CL equation using the virtual wave stress effect. The results of Tsai et al. (Reference Tsai, Lu, Chen, Dai and Phillips2017) and Fujiwara et al. (Reference Fujiwara, Yoshikawa and Matsumura2020) suggested that the simulated WL turbulence was driven by the CL2 mechanism associated with the virtual wave stress-driven sheared current. The latest numerical study by Imamura, Yoshikawa & Fujiwara (Reference Imamura, Yoshikawa and Fujiwaran.d.) observed that such vortical flows actually induce turbulent mixing. Through a detailed enstrophy budget analysis, they demonstrated that the turbulence was not locally produced from the orbital motion but non-locally through the sheared current near the surface.
These studies considered the problem in the water-side-only framework, but the water surface is in contact with air in reality. In the water-side-only problem, the viscous energy dissipation occurs over the bulk of water volume (Phillips Reference Phillips1966), and the momentum lost from the wave is received by the vortical current of water. In the presence of the air above, the two fluids can exchange momentum and energy, which can make a difference in the resulting flow fields. Thus, it is important to understand the roles played by the air–water coupling in the attenuating interfacial gravity waves and associated wave-induced turbulence. For this purpose, the wave-resolving numerical simulation is a promising approach because it enables us to evaluate the dynamical interaction between the two phases in detail, which is extremely difficult in laboratory and field measurements. Because the exchange of momentum and energy between water and air is central in this phenomenon, the simulations need to be conducted in air–water coupled configurations, rather than air-side only simulations (e.g. Sullivan, McWilliams & Moeng Reference Sullivan, McWilliams and Moeng2000; Sullivan et al. Reference Sullivan, Edson, Hristov and McWilliams2008; Cao & Shen Reference Cao and Shen2021), where the water surface serves as the infinite reservoir of energy.
The numerical study of air–water two-phase flow has a long history, with diverse topics of interest and numerical techniques to represent this complex system. For example, the main interest of studies using the interface-following coordinate (as in the present study) includes wind wave generation (Fulgosi et al. Reference Fulgosi, Lakehal, Banerjee and De Angelis2003; Lin et al. Reference Lin, Moeng, Tsai, Sullivan and Belcher2008; Zonta, Soldati & Onorato Reference Zonta, Soldati and Onorato2015; Li & Shen Reference Li and Shen2022), transient adjustment of waves to wind in high-wave-age (Zonta, Onorato & Soldati Reference Zonta, Onorato and Soldati2016), and the wind turbulence over waves and the evolution of wave spectrum under wind influence (Hao & Shen Reference Hao and Shen2019). Nevertheless, wind is present in all of these simulations, which makes it difficult to separately discuss the role of air–water coupling in WL turbulence production.
One important theoretical prediction is that the Eulerian mean current is intensified in the presence of air if its mean horizontal motion (mean wind) is zero. Dore (Reference Dore1978) studied the linear theory of interfacial gravity waves under the influence of weak viscosity in both air and water. The horizontal orbital velocity of the irrotational waves is discontinuous at the interface, so the viscous boundary layer (Stokes layer) develops on both sides to match the air- and water-side velocity. Due to the large density ratio, a very sharp shear layer arises in the air side, where a strong energy dissipation occurs. As a result, the leading-order amplitude decay rate is expressed as the sum of the dissipation in the bulk of the water and in the Stokes layer of the air. The result of Dore (Reference Dore1978) can be rewritten for deep-water interfacial waves as follows:
where $\rho _{a}$ is the density of air, $\nu _{a}$ is the kinematic viscosity of air and $ {\textit {Re}}_{a}\equiv \sigma k^{-2}/\nu _{a}$ is the air-side Reynolds number based on wavenumber and wave phase speed. The relative importance of the two terms depends on scale. Based on physical parameters at $10\,^\circ {\rm C}$, $\nu _{a}=1.4\times 10^{-5}\,{\rm m}^2\,{\rm s}^{-1}$, $\nu _{o}=1.3\times 10^{-6}\,{\rm m}^2\,{\rm s}^{-1}$, $\rho _{a}=1.2\,{\rm kg}\,{\rm m}^{-3}$, and $\rho _{o}=1.0\times 10^3\,{\rm kg}\,{\rm m}^{-3}$ for reference, and using the free surface dispersion relation $\sigma =(gk)^{1/2}$, the ratio of the second to the first term is 0.46, 2.56 and 14.4 for wavelengths of $\lambda =0.3, 3, 30$ m, respectively. For waves longer than $\lambda \approx 0.9$ m, the effect of viscous dissipation in the air dominates over the dissipation in the water. Dore (Reference Dore1978) further investigated the second-order stress at just outside the viscous boundary layer; the results are consistent with the following Eulerian form:
Since $\rho _{o}\nu _{o}\gg \rho _{a}\nu _{a}$, the virtual wave stress is mostly received by the water side term on the left-hand side. Therefore, the theory predicts that the wave momentum is transferred to water with a rate higher than that of the water-only case, possibly leading to stronger WL turbulence production than the free surface simulations.
In this study, the viscous attenuation of air–water interfacial gravity waves and associated WL turbulence production were investigated using two-phase wave-resolving DNS. We aimed to elucidate the effect of air–water coupling on the Eulerian mean current and WL turbulence generation by comparing wave-resolving simulations with and without coupling. Here, the mean airflow is assumed to be zero to clarify the comparison against the water-only simulation, because the wind–wave interaction (e.g. Miles Reference Miles1957) would complicate the process. However, the knowledge about the boundary layer structure and its role in air–water coupling should still be valid even in the presence of the mean wind. We also investigated the reproducibility of the phenomena in the wave-averaged framework using the wave-averaged simulations incorporating virtual wave stress as the boundary condition. We first extend the wave-resolving numerical model developed by Fujiwara et al. (Reference Fujiwara, Yoshikawa and Matsumura2020) to the two-phase configuration. Its numerical procedure is described in § 2. Then the problem setting for the simulation of attenuating interfacial waves are introduced in § 3, and its results are presented in § 4. Finally, a discussion and conclusions are provided in § 5.
2. Problem settings and numerical scheme
2.1. Framework
Here, we describe the numerical scheme of the two-phase flow solver. Various approaches have been used to simulate the air–water interface problems, such as the marker-and-cell method (Harlow & Welch Reference Harlow and Welch1965), the volume-of-fluid method (Popinet Reference Popinet2003), the level-set method (Sussman et al. Reference Sussman, Almgren, Bell, Colella, Howell and Welcome1999), the smoothed particle hydrodynamics (Colagrossi & Landrini Reference Colagrossi and Landrini2003), the direct method using the surface-following coordinate and interface tracking (Komori et al. Reference Komori, Kurose, Iwano, Ukai and Suzuki2010; Yang & Shen Reference Yang and Shen2011b) and modified or hybrid versions of these algorithms. In the present problem of non-breaking waves, we employ the surface-following coordinate approach, which can retain the sharpness of the interface and easily cluster the grid points to resolve the thin boundary layer. This approach also has an advantage in the conservation of mass, momentum and energy with a moderate computational cost, if a proper numerical method is employed. Here we assume that the air–water interface would not turn over and the interface can be represented with a one-valued function of horizontal position and time. This assumption allows us to prescribe a simple mapping from the physical to the computational domain (vertical coordinate transformation) and to avoid the regridding in each time step. Such a strategy has been adopted for simulating free-surface water-side flows (Tsai & Hung Reference Tsai and Hung2007; Yang & Shen Reference Yang and Shen2011a; Xuan & Shen Reference Xuan and Shen2019), the air-side flows (Sullivan et al. Reference Sullivan, McWilliams and Moeng2000, Reference Sullivan, Edson, Hristov and McWilliams2008) and the air–water coupled flows (Yang & Shen Reference Yang and Shen2011b). The numerical scheme is formulated as an extension of the framework of the free-surface (water-side) model of Fujiwara et al. (Reference Fujiwara, Yoshikawa and Matsumura2020).
Consider a three-dimensional rectangular domain, where the horizontal boundaries are doubly periodic, and the top and bottom boundaries are rigid walls. The Cartesian coordinates are denoted by $x, y$ (horizontal) and $z$ (vertical). The top and bottom boundaries are denoted by $z=H_{a}$ and $z=-H_{o}$, respectively. Here, for simplicity, we assume that the top and bottom walls are flat, but the numerical method described in the following can be easily extended to spatially varying $H_{a}$ and $H_{o}$.
The domain is filled with two incompressible fluids with different densities, which are hereinafter called ‘air’ and ‘water’. The densities of each fluid are $\rho _{a}$ (air) and $\rho _{o}$ (water), and $\rho _{a} < \rho _{o}$. Here $z=0$ is taken as the interface location at the state of rest, so the mean vertical thickness of each phase is $H_{a}$ (air) and $H_{o}$ (water). The air and water occupy the region $\eta (x,y,t)\leq z \leq H_{a}$ and $-H_{o}\leq z \leq \eta (x,y,t)$, respectively, where $\eta$ is assumed to be a one-valued function of $x$, $y$ and $t$ (time). With this assumption, we disregard the situation where the interfacial overturn (plunging breaker) occurs.
The fluids follow the incompressible Navier–Stokes equation:
Here, $u$, $v$ and $w$ are $x$-, $y$-, and $z$-component velocities, respectively, ${\mathsf{T}}^{xx}$ and so on are the components of kinematic viscous stress tensor $\boldsymbol{\mathsf{T}}$ (i.e. viscous stress tensor divided by density) and $g$ is gravitational acceleration. In (2.1), the total pressure $\tilde {p}$ is decomposed into the hydrostatic and non-hydrostatic components, $\tilde {p}=\rho g (\eta -z)+\tilde {p}_{nh}=\rho g (\eta -z)+\rho p_{nh}$, where $\tilde {p}_{nh}\equiv \rho p_{nh}$ and $\rho$ is the density ($\rho _{a}$ or $\rho _{o}$). The viscous stress can be written as
where $i,j=1,2,3$, $(x_1, x_2, x_3)=(x,y,z)$ and $(u_1, u_2, u_3)=(u,v,w)$. The kinematic viscosity $\nu$ can be either constant or some eddy viscosity modelled with the velocity field.
At the top and bottom ($z=H_{a}, -H_{o}$), $w=0$ is demanded as the kinematic boundary condition. When $\nu \neq 0$, dynamic boundary conditions must be provided there, such as the no-slip condition ($(u,v,w)_{air}=(u,v,w)_{water}$) or some momentum flux parameterisation ($\rho {\mathsf{T}}^{xz}=\tau ^x$, $\rho {\mathsf{T}}^{yz}=\tau ^y$). At the interface $z=\eta (x,y,t)$, the mass continuity is demanded as the kinematic boundary condition:
Here, this condition is satisfied at both the air ($z=\eta +0$) and water ($z=\eta -0$) sides. By vertically integrating the continuity equation (2.1d) from the top or bottom to the interface and using this condition, one obtains the column mass conservation equation:
As the dynamic boundary conditions, the continuity of interfacial stress $(-\tilde {p}\boldsymbol{\mathsf{I}}+\rho \boldsymbol{\mathsf{T}})\boldsymbol {\cdot } \boldsymbol {n}$ is demanded. Here, ${\boldsymbol {n}} = (1+\eta _x^2+\eta _y^2)^{-1/2}(-\eta _x, -\eta _y, 1)$, denotes the upwards-looking unit normal vector at the interface, where $\eta _x\equiv {\partial \eta }/{\partial x }$ and $\eta _y\equiv {\partial \eta }/{\partial y }$, and $\boldsymbol{\mathsf{I}}$ denotes the unit tensor. We formulated the stress continuity via $\tau _{i}^{tx}$, $\tau _{i}^{ty}$, and $-\tilde {p}_{nh}+\tau _{i}^n$ (subscript i denotes ‘interface’ and not the coordinate index) in the following equations:
Here, $\boldsymbol {t}^x\equiv (1+\eta _x^2)^{-1/2}(1,0,\eta _x)$ and $\boldsymbol {t}^y\equiv (1+\eta _y^2)^{-1/2}(0,1,\eta _y)$ represent the unit vectors tangential to the interface that lie in $x$–$z$ and $y$–$z$ planes, respectively. The tangential stress components $\tau _{i}^{tx}$ and $\tau _{i}^{ty}$ need to be modelled from the neighbouring velocity field, such as the no-slip boundary condition or the bulk formula. Once these are obtained, the normal viscous stress component $\tau ^n_{i}\equiv \rho (1+\eta _x^2+\eta _y^2)^{-1}({\mathsf{T}}^{zz}-2\eta _x{\mathsf{T}}^{xz}-2\eta _y{\mathsf{T}}^{yz}+\eta _x^2{\mathsf{T}}^{xx}+2\eta _x\eta _y{\mathsf{T}}^{xy}+\eta _y^2{\mathsf{T}}^{yy})$ was computed explicitly at each side of the interface. To simplify the continuity condition of the non-hydrostatic pressure $(\tilde {p}_{nh}-\tau ^n_{i})_{air}=(\,\tilde {p}_{nh}-\tau ^n_{i})_{water}$, we introduced the pseudo-pressure variable $p\equiv \rho ^{-1}[\tilde {p}_{nh}(x,y,z)-\tau ^n_{i}(x,y)]$ and transformed the pressure gradient terms in (2.1) as follows:
The pseudo-pressure $p$ multiplied with density is continuous at the interface: $(\rho p)_{air}=(\rho p)_{water}$.
We employed the curvilinear coordinate that follows the interfacial deformation. The independent variables $(x,y,z,t)$ were transformed to $(x^*,y^*,z^*,t^*)$ as
This transformation maps the physical air (water) domain $\eta \leq z \leq H_{a}$ ($-H_{o}\leq z \leq \eta$) to the computational domain $0\leq z^*\leq H_{a}$ ($-H_{o}\leq z^* \leq 0$).
After coordinate transformation, the governing equations (2.1) can be written in the following form:
Here, subscripts $t^*$, $x^*$, $y^*$ and $z^*$ denote partial derivatives, $h\equiv {\partial z }/{\partial z ^*}$ is the layer thickness, $U\equiv hu$, $V\equiv h v$, $W\equiv hw$ and $P\equiv hp$ are the layer thickness-weighted variables and $\varOmega \equiv w-z_{t^*}-uz_{x^*}- v z_{y^*}$ is the layer thickness-weighted $z^*$-velocity. The apparent form of (2.8) is identical for both air and water. However, the expressions for $h$ and other variables vary because the definition of $z$ (2.7) depends on the fluid type. The column-mass conservation equation (2.4) can be transformed as follows:
2.2. Spatial discretisation
Taking advantage of the doubly periodic horizontal boundary condition, we discretise the variables in equally spaced grid points in $x^*$ and $y^*$ and take the pseudo-spectral approach to approximate horizontal derivatives. Hereinafter, ${\partial }/{\partial x ^*}$ and ${\partial }/{\partial y ^*}$ represent the evaluation of horizontal derivatives using the fast Fourier transform algorithm. To avoid nonlinear instability, spectral coefficients above two-thirds of Nyquist frequency are filled with zeros.
In vertical, the second-order finite-difference method is used. The air-side (water-side) domain $0 \leq z^* \leq H_{a}$ ($-H_{o}\leq z^* \leq 0$) is discretised as layers with variable thickness, and variables are placed in a staggered grid layout (figure 1). Horizontal velocity components and scalars are defined at layer centres, and vertical velocity components are defined at layer interfaces. Both air- and water-side $W$ are defined at the air–water interface because the velocity discontinuity may arise there unless the no-slip boundary condition is assumed. The thickness-weighted pseudo-pressure $P$ is defined not only at layer centres but also at the air–water interface. Denoting the numbers of layers with $K_{a}$ (air) and $K_{o}$ (water), $P$ is discretised into $K_{a}+K_{o}+1$ points in vertical. This additional degree of freedom allows us to ensure the mass continuity at the interface (2.3), as discussed further in § 2.3. Hereinafter, ${\partial }/{\partial z ^*}$ represents the second-order finite-difference approximation of vertical derivatives. Horizontal velocity components $U$ and $V$ are defined at the cell centres. When they are required at the air–water interface as in (2.8d), the values at the grid centres just above or below the interface is consistently used to represent the interfacial value. Evaluating (2.9) in the discretised domain and using (2.8d), we obtain
Here, the subscript $k$ represents vertical coordinate index, where $k=\pm 1$ denote the cell centres next to the interface and $k=\pm 1/2$ denote the variables on each side of the interface (see figure 1). This is the kinematic boundary condition (2.3) represented in the present framework. This approximation contains truncation error of $O(\Delta z^*)$, but it is typically overwhelmed by other discretisation errors (e.g. vertical finite-difference error of $O(\Delta z^{* 2})$), as is observed in Appendix A.1.
Note that the continuity of the normal stress is achieved implicitly by introducing the pseudo-pressure at the interface and using the common value for calculating the pressure-gradient force at the air and water side. Similar strategy is adopted to achieve the continuity of the tangential stress: we evaluated $\tau ^{tx}_{i}$ and $\tau ^{ty}_{i}$ at the interface and used that common value at the air and water side, thereby ensuring the momentum conservation. The method for evaluating the tangential stress is detailed in the following subsection.
2.3. Temporal integration
To achieve high accuracy in mass, momentum and energy conservation, the fourth-order Adams–Bashforth (AB4) scheme was adopted for the time integration of velocity field and interface elevation (Fujiwara et al. Reference Fujiwara, Yoshikawa and Matsumura2020). Hereinafter, we describe the time-advancement method from the known fields of $U^{(n)}$, $V^{(n)}$, $W^{(n)}$ and $\eta ^{(n)}$, where superscript $(n)$ denotes the timesteps. Since we employ a fully explicit scheme, all the right-hand side terms of (2.8a–c) and (2.9) are evaluated at timestep $n$ and used for temporal integration. The terms at past three timesteps ($n-1,n-2,n-3$) are stored for the AB4 scheme, but when the stability limit of some terms (e.g. viscosity) is much looser than that required by the interfacial waves, lower-order explicit schemes can be used to reduce computational cost without much truncation error.
The viscous stress tensor $T^{ij}$ is diagnostically evaluated from $(U^{(n)},V^{(n)},W^{(n)})$. At the air–water interface, the tangential components $(\tau ^{tx}_{i}, \tau ^{ty}_{i})$ are required to be continuous across the interface. They are evaluated referring to the velocity at the bottom layer of the air and the top layer of the water. In the case of the no-slip boundary condition, the velocity at the interface $z^*=0$ is approximated with the value at $z^*=-0.5\Delta z^*$ (top layer of water) due to the large density ratio. The tangential stress $(\tau ^{tx}_{i}, \tau ^{ty}_{i})$ is evaluated from the velocity difference between the lowest layer of the air and the interface. Then $(\tau ^{tx}_{i}, \tau ^{ty}_{i})$ is used to determine the boundary values of the water-side viscous stress tensor, together with $\tau ^n_{i}$, which is independently evaluated at each side. Due to the approximation of interfacial velocity using the first grid point, the consistency between the tangential stress and the surrounding velocity is not strictly satisfied. However, the relative error induced by this approximation (difference between ‘true’ interfacial velocity and the top layer of water) would be small as discussed in the following. The error can be roughly estimated from the leading-order stress balance $\rho _{a} \nu _{a} ({\textrm {d} u}/{\textrm {d} z})_{a}=\rho _{o} \nu _{o} ({\textrm {d} u}/{\textrm {d} z})_{o}$. The difference between the true interfacial velocity $u_{i}$ and approximated velocity is estimated by
where the grid thicknesses at the air and water sides are assumed similar. Therefore, the relative error is estimated as $O(\rho _{a}\nu _{a}/\rho _{o}\nu _{o})$, which is typically of $O(10^{-2})$, assuming $\rho _{a}\nu _{a}/\rho _{o}\nu _{o}\ll 1$ and $u(-0.5\Delta z^*)\sim u(0.5\Delta z^*)$. Furthermore, as long as the tangential stress imposed for each phase is identical, local momentum conservation is satisfied. Therefore, the present approximation saves us from an iterative approach for velocity–stress consistency without much disadvantage in accuracy. The error caused by this approximation is evaluated in Appendix C.
In the present model with variable vertical layer thickness, the temporal integration of the viscosity term using an explicit scheme would impose a severe limitation on the time step for a stable computation. However, the CFL condition regarding the interfacial gravity wave mode, which need to solve accurately, is similarly strict, even with the vertical resolution high enough to resolve the Stokes boundary layer (SBL) with several layers. Therefore, we employ the explicit scheme for the integration of viscous terms and do not employ the implicit scheme that requires iteration.
To integrate the pressure gradient terms in (2.8) using the AB4 scheme, the instantaneous pressure field $P^{(n)}$ is needed. The pressure field must satisfy the normal stress continuity equation (2.5c) and retain the velocity incompressibility. Such pressure field must be obtained through a Poisson equation with non-constant coefficients that require an iterative approach to solve. In some preceding air–water coupled numerical models, the air–water coupling was achieved by alternatively solving for each phase, where the single-phase solution is used as the boundary condition for the other phase (see the detailed discussion given in, e.g. Lombardi, De Angelis & Banerjee Reference Lombardi, De Angelis and Banerjee1996; Yang & Shen Reference Yang and Shen2011b). In the present model, we derive the pressure field based on the air–water coupled pressure Poisson equation, which is solved in a single-loop iteration, since the numerical accuracy of the pressure field matters in the problems of our concern.
To obtain the instantaneous pressure field, we constructed a pressure Poisson equation for $P^{(n)}$ as follows. The time derivative of incompressibility relation (2.8d) is
By substituting (2.8a–c), we obtain
where $G^x$, $G^y$ and $G^z$ denote the right-hand-side terms in (2.8a–c) that can be evaluated explicitly, i.e. terms that do not include $P$, and the timestep index $(n)$ is omitted. We separated the constant-coefficient terms in the Laplacian of $P$ into the left-hand side, and the time derivatives of the metric variables $h$ and $z$ were explicitly evaluated using (2.9). This relation holds for each discretised layer, so the number of equations per vertical column was $K_{a}+K_{o}$. One more equation per column was needed to obtain $P$, which has $K_{a}+K_{o}+1$ degrees of freedom in vertical. For this, we employed the mass continuity equation at the interface (2.3). Equating the right-hand sides of (2.10) and taking a time derivative, we obtained
Variables with subscripts $1$ and $-1$ were evaluated at the layer centres next to the interface in the air and water side, respectively (see figure 1). Similarly, subscripts $1/2$ and $-1/2$ denote the variables on the air and water side, respectively, of the interface $z^*=0$. By substituting (2.8a–c) to (2.14), we obtained the following equation for $P$:
The pressure variable notation in this equation requires clarification. From the definition, $P\equiv h_{a} p$ and $P\equiv h_{o} p$ in the air side (positive indices) and water side (negative indices), respectively. Since $\rho p$ is continuous at the interface, we introduced $P_0\equiv \rho p/{\sqrt {\rho _{a}\rho _{o}}}$ for numerical implementation. With these definitions of discretised $P$, the $z^*$-derivatives of $P$ in (2.15) should be read as
and so on. Similarly, this definition of $P_0$ was used when evaluating (2.13) at the layers directly above and below the interface.
For each vertical column, (2.13) and (2.15) provided $(K_{a}+K_{o}+1)$ equations with $(K_{a}+K_{o}+1)$ unknown variables $P_{-K_{o},\ldots,0,\ldots,K_{a}}$. This system was solved by the fixed-point iteration method as described in Sullivan et al. (Reference Sullivan, McWilliams and Moeng2000) and Fujiwara et al. (Reference Fujiwara, Yoshikawa and Matsumura2020). When the vertical index is denoted with $k$, (2.13) and (2.15) can be written as
Here, $\epsilon$ is the linear term of $P$ whose coefficients vary in space, and $Q$ represents the terms that do not include $P$. Denoting the left-hand side terms with $\mathcal {L}(P)$ and the iteration index with superscript $[m]$, we iteratively solved for $P^{[m]}$ in the following equation:
The inversion of the left-hand side can be achieved by using horizontal fast Fourier transform and tridiagonal solver. Since both the top and bottom boundaries are rigid-lid, one can add an arbitrary constant to the pressure field. We constrained this degree of freedom by demanding that the horizontal average of $P_0$ is zero. This equation was iteratively solved until all of the normalised residuals
become smaller than a certain value (typically $10^{-8}$), where r.m.s. denotes root mean square over all grid points. This way, the instantaneous pressure field is accurately solved without nested iteration. For the AW-ctrl case introduced in § 3, which is a typical problem with wave slope $ak=0.1$, the number of iteration required for convergence was seven.
Once the pressure field was obtained, the prognostic equations (2.8a–c) and (2.9b) were integrated with the AB4 scheme. Due to the nonlinearity of the incompressibility equation, the velocity field after the time integration contains a small compressibility of $O(\Delta t^5)$. To fix this, the gradient of a scalar potential was added to the velocity field as in Fujiwara et al. (Reference Fujiwara, Yoshikawa and Matsumura2020). The Poisson equation for the potential was obtained by demanding the incompressibility of the final velocity field. The procedure is very similar to the pressure equations (2.13) and (2.15), so it is not detailed here.
The performance of the numerical model was examined in several benchmark cases, and its results are described in Appendix A. The model well-reproduced the analytic behaviours of interfacial gravity waves and the Miles instability problem with a reasonable spatial resolution. Notably, the flux form configuration and the fully coupled pressure-solving strategy led to small numerical errors in the energy, momentum and mass conservation, as demonstrated in § 3. This feature is favourable in considering a delicate problem such as the WL turbulence production.
The numerical procedure can be extended easily to the air-side-only configuration where $\eta (x,y,t)$ is externally provided. Although such a problem is not considered in this article, the numerical procedure is briefly introduced in Appendix B for future reference.
3. Problem set-up
Numerical simulations of attenuating interfacial waves are conducted to clarify the difference in wave-induced turbulence between the air–water coupled flow and the free-surface flow. We consider both the air–water coupled (simulated with the model developed in this study, labelled ‘AW’) and the water-only (simulated with the free surface model of Fujiwara et al. (Reference Fujiwara, Yoshikawa and Matsumura2020), labelled ‘W’) configurations. In each configuration, a basic three-dimensional set-up labelled ‘ctrl’ is considered, and several variants are also designed to study the dynamical roles of particular processes and sensitivity to problem set-up. In table 1, all the set-ups are listed.
We first introduce the air–water coupled configuration. The following description pertains to the AW-ctrl case, whereas the AW-noturb case is derived by assuming homogeneity in the $y$ direction ($\partial /\partial y=0$). Consider a wavelength $\lambda$ and non-dimensionalise all the variables based on the spatial scale of $k^{-1}=\lambda /2{\rm \pi}$ and the temporal scale of $\sigma ^{-1}=[gk(\rho _{o}-\rho _{a})/(\rho _{o}+\rho _{a})]^{-1/2}$ (angular frequency of the small-amplitude deep-water wave). For density, the air-side density is used as the reference. Hereinafter, all the symbols denote non-dimensionalised variables. Under this non-dimensionalised system, a three-dimensional domain of $(L_x, L_y, H_{a}, H_{o})=(2{\rm \pi}, 2.4{\rm \pi}, 1.5{\rm \pi}, 1.5{\rm \pi} )$ was considered. The mean depths of air and water layers are 75 % of a wavelength, which is still in a deep-water regime. Therefore, the wave period is roughly $2{\rm \pi}$, with small modifications by nonlinearity and finite-depth effects.
This system is characterised by three non-dimensional numbers, namely, the density ratio $r \equiv \rho _{o}/\rho _{a}$ and the Reynolds numbers $({\textit {Re}}_{a}, {\textit {Re}}_{o}) = (\sigma k^{-2}/\nu _{a},\sigma k^{-2}/\nu _{o})$. We choose the density ratio of $r=1.0\times 10^3$ and the Reynolds numbers of $({\textit {Re}}_{a}, {\textit {Re}}_{o})=(1.5\times 10^4,1.5\times 10^5)$. This parameter set does not precisely correspond to a particular physical condition because we are mainly focused on the dynamical understanding of the phenomena. Nevertheless, the present parameter choice roughly corresponds to the actual air–water interfacial wave with $\lambda \approx 1.0$ m ($ {\textit {Re}}_{a}=1.4\times 10^4$, $ {\textit {Re}}_{o}=1.5\times 10^5$ and $r=8.1\times 10^2$ at $10\,^\circ {\rm C}$). Here we neglect the effect of surface tension to further simplify the dynamics.
The top and bottom boundaries are flat and free-slip. The no-slip boundary condition is imposed at the air–water interface. Then the domain was discretised with 128 and 320 grid points in $x$ and $y$ directions, respectively. Higher spatial resolution is assumed in $y$ direction because the resulting flow shows a finer structure in $y$. In the vertical, the air and water domains are discretised with 128 and 160 grid points, respectively. The grid points are clustered near the interface, such that the layer thickness directly above and below the interface would be half of the viscous SBL thickness $(2/{\textit {Re}}_{{a},{o}})^{1/2}$, which is thicker in the air side. The layer thickness increased exponentially away from the interface, with ratios of 1.0239 and 1.0270 on the air and water side, respectively.
For the water-only case (W-ctrl and W-noturb), we consider a horizontally rectangular domain topped with a free-surface boundary at its upper surface, $z=\eta (x,y,t)$. The upper surface satisfies the kinematic boundary condition $\partial \eta /\partial t=w-u\partial \eta /\partial x - v \partial \eta /\partial y$ and the no-stress boundary condition $(-\tilde {p}\boldsymbol{\mathsf{I}}+\rho \boldsymbol{\mathsf{T}})\boldsymbol {\cdot } \boldsymbol {n}=\boldsymbol {0}$. The bottom boundary is the flat wall with the free-slip condition as in the AW cases. Because the dispersion relation of the surface waves differs from the air–water coupled cases, the reference time scale of $\sigma ^{-1}=(gk)^{-1/2}$ was used for the non-dimensionalisation instead. Otherwise, the geometric set-up and parameters are identical to the water side of the AW cases.
In both the AW and W configurations, we initialised the flow field with the orbital velocity of the fifth-order Stokes wave (Tsuji & Nagata (Reference Tsuji and Nagata1973) for the AW and Fenton (Reference Fenton1985) for the W cases) that propagates towards the $x$ direction, with wavelength $2{\rm \pi}$ and initial wave amplitude of $a=0.1$ (wave slope of $0.1$). The asymptotic solution of Tsuji & Nagata (Reference Tsuji and Nagata1973) assumes a deep-water limit, so its use as the initial condition can introduce a spurious response with an interfacial displacement of $O(10^{-3})$. The analysis conducted here is insensitive to the spurious waves of this amount. In the AW-ctrl and W-ctrl cases, a Gaussian noise with a standard deviation of $10^{-3}$ is added to $u$ at water-side grid points near the interface (only in one layer centred at $z^*=-0.0086$ and $\Delta z^*=0.0020$ thick) to seed the horizontal inhomogeneity. Before adding to the orbital velocity, the noise field is horizontally low-pass filtered at a cutoff wavenumber of 16. Then, the divergent component of the noise field is removed and made solenoidal in the projection procedure during the initialisation of the simulation. We expect that the resulting turbulence is insensitive to this noise structure because of inherent instability (Tsai et al. Reference Tsai, Lu, Chen, Dai and Phillips2017; Fujiwara et al. Reference Fujiwara, Yoshikawa and Matsumura2020). To examine the dependence of the result on initial noise structure, we have conducted an AW case with the same amplitude noise added to the grid points of all levels in the water side, which is named the ‘AW-deepnoise’ case. In addition, to study the phenomenon under larger wave amplitude, an AW case with doubled initial wave amplitude (AW-a2) was conducted. We also conducted the sensitivity study to the domain size (AW-long and AW-narrow), which is described in Appendix E.
Starting from this initial velocity field, the temporal integration was conducted with $\Delta t = 2{\rm \pi} /240$ until $t=2400{\rm \pi}$, which is about 1200 wave periods. During the simulation, it was confirmed that the waves barely change shape and do not break, as monitored by the time series of maximum interface slope $\max (\sqrt {\eta _x^2+\eta _y^2})$. In all cases listed in table 1, the maximum slope decreased over time and did not exceed its initial value (about 0.2 for AW-ak2 and 0.1 for the rest). In fact, in the AW-ctrl case, the primary harmonic component (wavenumber (1,0) in $(x,y)$ direction) of $\eta$ explains more than 99.7 % of the total variance throughout the simulation period, and with the addition of the second harmonic (wavenumber $(2,0)$), it reaches above 99.998 %.
To demonstrate the accuracy of the present numerical model, the numerical errors are monitored in various ways in the AW-ctrl case, and their time series is shown in figure 2. In figure 2(a), the temporal evolution of error in conserved properties is shown. Water mass conservation can be monitored by the horizontal average of interface elevation, $\bar {\eta }$, and its error is of $O(10^{-16})$. The total $x$-component momentum $M$ should be conserved in the present set-up because of the free-slip boundary condition at the top and bottom, and the horizontally periodic boundary condition. It is defined as follows:
Here, the overline denotes the horizontal average. The momentum error $\Delta M\equiv M(t)-M(0)$ normalised by initial total momentum is as small as $O(10^{-7})$ after 1200 periods of integration thanks to the full-flux form configuration (2.8). The total energy is calculated as the sum of the kinetic energy (KE) and potential energy (PE):
There is no energy flux through the free-slip top and bottom boundaries, so the temporal change of total energy can be monitored by the viscous dissipation. Therefore, the energy error $\Delta E$ can be computed as follows (Tsai & Hung Reference Tsai and Hung2007):
Here, $(F^x, F^y, F^z)$ denotes the viscous force divided by density (as denoted in (2.1a–c)). The time series of energy error normalised with $E(0)$ shows energy growth of 0.01 % per 1000 wave period, which is sufficiently small even for a long-term integration as in the present problem.
To monitor the mass continuity, the maximum velocity divergence over air and water domains is shown in figure 2(b). It is about $10^{-6\sim -5}$ smaller than the characteristic strain rate by the wave orbital motion. There is a jump of velocity divergence at around $t/2{\rm \pi} =150$, which corresponds to the onset of the small-scale flow structure by wave-induced turbulence (§ 4.2). Similarly, the continuity of interface $(w-u\eta _x-v\eta _y)_{z=\eta +0} - (w-u\eta _x-v\eta _y)_{z=\eta -0}$ is confirmed to be small. The numerical error shown in figure 2 is also monitored for the AW-a2 and AW-deepnoise cases and presented in appendix D.
We have also estimated the numerical diffusivity using the W-noturb configuration. At the moment, the tracer equation is not implemented in the two-phase model, so the free-surface model of (Fujiwara et al. Reference Fujiwara, Yoshikawa and Matsumura2020) that employs identical discretisation was used. Passive tracer with various diffusivity $\kappa$ and corresponding Péclet number $ {\textit {Pe}} = \sigma k^{-2}/ \kappa$ was placed in the initial field as a vertical water column and was advected and diffused following the wave motion. The same simulation was conducted for a configuration with doubled horizontal and vertical grid points, and the tracer fields at $t=100{\rm \pi}$ were compared for the two resolutions. For simulations with $ {\textit {Pe}}\gtrsim O(10^6)$, the tracer fields were different between the two resolutions, which is dominated by the numerical dispersion and diffusion. However, at $ {\textit {Pe}} \lesssim O(10^6)$, the simulation results are nearly identical between the two resolutions. Therefore, in the present simulations with ${\textit {Re}}_{o}=1.5\times 10^5$, the influence of numerical dispersion/diffusion is negligible.
Finally, to justify the approximation of interfacial velocity by the water-side top layer, the resulting error in interfacial velocity and stress is evaluated in Appendix C between the simulation results of the AW-noturb case. The error between the exact and approximated velocity and the resulting error in momentum and energy exchange between air and water was at most $O(1)\%$. Therefore, its effect on the dynamics reported in the following section is minor.
4. Results
4.1. Overview of flow structure
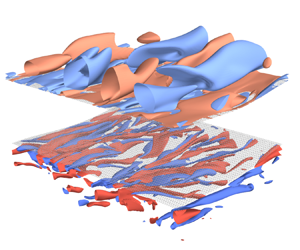
An overview of the simulated wave motion and the resulting turbulence field is presented. Figure 3 is the three-dimensional plot of the streamwise ($x$ component) vorticity component in the AW-ctrl case at $t=1200{\rm \pi}$ showing the elongated vortex structure. This is consistent with the streak structure observed in the laboratory experiment by Savelyev et al. (Reference Savelyev, Maxeiner and Chalikov2012). The vortices are present both in the water and air domains, but their typical spatial scale is larger in the air side because of the larger kinematic viscosity value there. These turbulent vortices developed over the time scale of $O(100)$ wave periods, as described in § 4.2.
The velocity field in the AW-ctrl case is shown in figures 4 and 5. The instantaneous velocity field is dominated by the wave orbital motion, which is nearly uniform in the $y$ direction, so the deviation from the $y$ average along constant $x^*$ and $z^*$ lines is considered as the turbulence field. Hereinafter, prime is used to denote the turbulence component:
where $\varphi$ denotes an arbitrary field and
is the along-crest average.
Figure 4 shows the $x$–$z$ vertical section of the velocity field at $t/2{\rm \pi} =1200$. Since $\eta$ is almost uniform in the $y$ direction, $\langle \eta \rangle _y$ is used as the interfacial shape. Figure 4(a–c) show that the crest-averaged velocity field is dominated by the wave orbital motion. Although it is invisible in the present plotting, the air-side $\langle u\rangle _y$ sharply adjusts to the water-side value near the interface. This will be further demonstrated in § 4.3. The along-crest variance of velocity components shows that the horizontal components of the turbulence component are located near the interface. The vertical component $\langle w^{\prime 2}\rangle _y$ is also concentrated near the interface in the water side, but it is centred at the middle of the domain in the air, representing the large vertical scale of vortices in the air side.
Figure 5 shows the horizontal distribution of $u'$, $ v '$ and $w'$ at both air side (upper row, $z^*=0.2$) and water side (lower row, $z^*=-0.2$). The flow structure is elongated in the wave propagation direction in both the air and water sides, and its spatial scale is finer for the water side because of its smaller viscosity. On the water side, the downwelling part $w'<0$ is often associated with the down-wave velocity $u'>0$, which is consistent with the typical structures of the LCs (Leibovich Reference Leibovich1983) and the turbulence produced in water-only wave resolving simulations (Tsai et al. Reference Tsai, Lu, Chen, Dai and Phillips2017). The air-side flow shows an upsidedown LC-like structure in that the strong streamwise current region ($u'>0$) corresponds well with the convergence zone ${\partial v '}/{\partial y }<0$ and the upwelling zone $w'>0$. This is understandable because the wave-driven airflow (figure 7d) has the negative shear ${\partial \bar {u}^{E}}/{\partial z }<0$, and the shear of the air-side Stokes drift ${\partial u ^{St}}/{\partial z }=-2a^2 {\rm e}^{-2z} < 0$ has the same sign. This results in CL2 instability (Leibovich Reference Leibovich1983), producing the roll structure in the air side as well. The W-ctrl case also showed a turbulent flow pattern similar to the water side of the AW-ctrl case, and their difference in turbulence intensity is discussed in § 4.2.
4.2. Temporal evolution of flow field
Here, the temporal evolution of the flow field is described. First, figure 6 shows the temporal variation of the wave amplitude. The wave amplitude is evaluated as $a(t)=(2\overline {\eta ^2})^{1/2}$, where the overline denotes horizontal average. Both in the AW and W cases, the decay rate is almost identical with and without turbulence. The simulated decay rate followed the linear theory of Dore (Reference Dore1978) (AW) and Lamb (Reference Lamb1932) (W) well, indicating the prevalence of linear dynamics. The simulated decay rate of both the AW-ctrl and AW-noturb cases exceeded the theoretical prediction slightly, although this deviation diminished with a higher vertical resolution near the interface on the air side. This suggests that the air-side Stokes layer is playing a central role in the energy dissipation, and it needs to be properly resolved when we focus on its role. With that caveat in mind, we proceed with the present resolution, as the enhanced wave decay predicted by the linear theory is mostly reproduced.
As waves decay, they give up the horizontal momentum and produce a vortical current, namely, the Eulerian mean drift. The Eulerian mean drift is evaluated by first vertically interpolating the horizontal velocity field $u$ to fixed levels and then taking a horizontal average. The temporal evolution of the Eulerian mean horizontal velocity $\bar {u}^{E}(z, t)$ is shown in figure 7. The data at the vertical levels between wave crests and troughs are not plotted here. The comparison of the AW-noturb and W-noturb cases (figure 7b,c) shows that, due to the enhanced energy decay in the air–water coupling, the development of $\bar {u}^{E}$ is also accelerated in the AW case. In the air side of the AW-noturb case (figure 7a), the Eulerian mean drift develops in the down-wave direction. The drift near the interface is stronger than that in the water-side drift. However, its velocity scale is still on the order of the water-side Stokes drift $O(a^2k\sigma )$. In the realistic ocean, this is likely significantly smaller than that of the wind over the waves, which is typically on the order of the wave phase speed $O(\sigma /k)$.
The evolution of water-side Eulerian mean drift in the AW-noturb case is compared with the virtual wave stress theory. The one-dimensional diffusion equation below was simulated for the velocity profile $u(z,t)$ in the water side ($-H_{o}\leq z\leq 0$):
The upper boundary condition is provided as the virtual wave stress, $\nu _{o}({\partial u }/{\partial z })=\tau ^{vws}_{ao}$ (1.4), and the bottom boundary is assumed as free-slip. Since the amplitude time series was well followed by the linear theory (figure 6), the wave amplitude $a(t)$ used in $\tau ^{vws}_{ao}$ is assumed to exponentially decay with time as $a(t) = a(0){\rm e}^{-\gamma _{ao} t}$. The result is shown as the dashed lines in figure 7(b), which mostly overlaps with the AW-noturb simulation result.
In the three-dimensional cases, turbulence alters the velocity profile by carrying horizontal momentum away from the interface. As a result, velocity profile $\bar {u}^{E}$ shows weaker vertical shear in both air and water sides (figure 7d–f).
Veron & Melville (Reference Veron and Melville2001) derived a similarity solution of the wind-driven sheared current in the water-side based on the one-dimensional diffusion equation (4.3) subject to a constant wind stress $\tau$. Wu & Deike (Reference Wu and Deike2021) conducted a two-dimensional DNS of the wind–wave growth under the influence of viscosity and confirmed that the wind-induced drift current $\bar {u}^{E}(z,t)$ falls into a single curve if the depth and the velocity are scaled with $\sqrt {\nu _{o} t/8}$ (under our non-dimensionalisation $\sqrt {t/8{\textit {Re}}_{o}}$) and $U_0(t)\equiv \bar {u}^{E}(0,t)$, respectively. Figure 8(b,c) show the temporal evolution of the Eulerian current profile scaled as previously. Here, the velocity scale $U_0(t)$ is evaluated as (Veron & Melville Reference Veron and Melville2001; Wu & Deike Reference Wu and Deike2021)
and $\tau =\tau ^{vws}_{ao}(0)$ and $\tau =\tau ^{vws}_{o}(0)$ for the AW-ctrl/noturb and W-ctrl/noturb cases, respectively. The AW-noturb and W-noturb cases follow the scaling well, but in the AW-ctrl and W-ctrl cases, the shear is reduced due to turbulence, and the drift current profiles deviate from the scaling solution.
On the air side, however, the drift velocity scales differently. The Eulerian current profile in the air with vertical coordinate scaled with $\sqrt {t/8 {\textit {Re}}_{a}}$ is shown in figure 8(a). Unlike on the water side, the profiles of the AW-noturb case fall into a single curve without scaling with $U_0(t)$. Therefore, the air-side drift current develops as if a Dirichlet-type boundary condition is imposed at the bottom.
Next, the temporal evolution of turbulence, characterised by deviation velocity from $y$ average $(u', v ',w')$ is compared among cases. Figure 9 shows the temporal evolution of water-side turbulent kinetic energy (TKE) and the spanwise wavelength $l_s$. TKE is defined as $(r/2)(u^{\prime 2}+ v ^{\prime 2}+w^{\prime 2})$. Temporal evolution of its vertical profile (horizontally averaged along $z^*$-surface) is shown for the AW-ctrl (figure 9a) and W-ctrl (figure 9b) cases. Turbulence arises from the near-interface layer and spreads into the water as time passes. The magnitude of turbulence is greater in AW-ctrl than in W-ctrl throughout the simulation period. Note that, even at $t/2{\rm \pi} =1200$, the turbulence has not fully reached the bottom of the water side. However, the turbulence near the interface has reached a mature stage, and the turbulence statistics no longer change rapidly. Therefore, we can expect that the flow field of AW-ctrl after $t/200{\rm \pi} \approx 500$ would well reflect the dynamics of turbulence produced by persistent wave forcing in the air–water coupled configuration.
To illustrate the turbulence development in different cases more quantitatively, let us examine TKE vertically averaged over $-0.4\leq z^*\leq 0$ shown in figure 9(c). In all cases, the TKE is initially of very small magnitude (e.g. $O(10^{-7})$ in AW-ctrl), rapidly grows in the earlier stage, and then saturates, reflecting some instability mechanism at work. The onset of instability is quicker in AW-ctrl ($t/2{\rm \pi} \approx 175$) than W-ctrl ($t/2{\rm \pi} \approx 250$), and TKE magnitude of the former remains stronger than the latter throughout the simulation period. Therefore, the air–water coupling enhances the wave-induced turbulence.
To characterise the spatial scale of the turbulence, we have evaluated the TKE-weighted mean spanwise wavenumber $l_s$ following Tsai et al. (Reference Tsai, Lu, Chen, Dai and Phillips2017), as follows:
where $l$ is the wavenumber in the $y$ direction and $S(l,t)$ is the spanwise power spectral density of turbulence velocity averaged over $0\leq x^*\leq 2{\rm \pi}$ and $-0.4 \leq z^* \leq 0$,
where $S_u$ and so on denote the power spectral density obtained by applying the Fourier transform in the $y^*$ direction.
The temporal evolution of $l_s$ is shown in figure 9(d). Before the onset of instability, the turbulence field is dominated by the spatial scale of $l_s\approx 7$, which corresponds to the initial noise field. As the disturbance grows, vortices with relatively high wavenumbers first develop, and then the dominant spanwise scale grows ($l_s$ decreases) rapidly after the instability is saturated. At a later stage of the simulation period, the temporal development of $l_s$ is small. The AW-ctrl and W-ctrl cases show the similar temporal evolution of $l_s$, except that the time series in W-ctrl is lagged behind AW-ctrl by about 50 periods, consistent with the delay of the instability onset.
The result of the AW-deepnoise case is shown in figure 9(c,d) with a blue dashed line. The rapid growth of TKE at the onset stage and the subsequent decrease of $l_s$ observed in the AW-deepnoise case precedes the corresponding changes in AW-ctrl. As a result of the initial noise injected into all the water grid points, the initial TKE level (about $1\times 10^{-5}$) is about 300 times greater than in the AW-ctrl case. This results in an enhancement of the initial amplitude of the fastest-growing mode, so we can understand that the onset of instability occurs earlier. However, after the turbulence reached maturity, there was no clear difference between AW-deepnoise and AW-ctrl. Therefore, the statistical features of the simulated turbulence are not dependent on the initial noise structure, and only the onset timing of instability is changed.
To examine the influence of wave amplitude on the phenomenon, we have conducted an air–water coupled case with greater initial wave amplitude, $a=0.2$ (AW-a2 case). The spatial structure of turbulent velocity was similar to AW-ctrl: the vortices elongated in wave-propagation direction was observed, and the temporal evolution of turbulence statistics is shown in figure 9. Overall, the temporal evolution of turbulence is similar to the AW-ctrl case, but the onset of instability is earlier ($t/2{\rm \pi} \approx 75$). This reflects the stronger Eulerian sheared current ($\propto \tau ^{vws}_{ao}\propto a^2$) than AW-ctrl, resulting in a greater growth rate of instability. The magnitude of TKE at the mature stage (average over $600\leq t/2{\rm \pi} \leq 1200$) is about eight times greater than that of AW-ctrl.
From these results, we can make a remark on the onset time scale of wave-induced turbulence (300 periods in the AW-ctrl case). The DNS by Tsai et al. (Reference Tsai, Lu, Chen, Dai and Phillips2017) required only 10 wave periods for turbulence to develop. In their set-up, the wave slope was 0.25, which is even greater than in our AW-a2 case, and they imposed the initial noise that contains 0.1 % of the total energy. The large amplitude should lead to a strongly unstable condition, and the fraction of disturbance energy is much greater than our set-up ($O(10^{-6})\%$ for the AW-ctrl and AW-a2 cases), so the initial instability is considered to be strongly seeded. Therefore, in the simulation set-up of Tsai et al. (Reference Tsai, Lu, Chen, Dai and Phillips2017), the instability is expected to arise at an early stage after the simulation starts. Notably, the tank experiment of Savelyev et al. (Reference Savelyev, Maxeiner and Chalikov2012) also observed the turbulence growth at a similar time scale (ramp-up time of 7–10 periods followed by 6–9 periods with constant wave amplitude). Therefore, we consider that the initial noise field of our simulation design was too weak, leading to unrealistically long spinup period of $O(100)$ wave periods. However, our simulations demonstrate that the flow field is inherently unstable and the turbulence develops over time even with such a small initial disturbance.
4.3. Momentum and KE budget analysis
To examine the mechanism of vertical transfer of momentum and energy, the budget equations of the horizontal momentum and KE were explored. The analysis was conducted on the model coordinate $z^*$ as in preceding studies using wave resolving simulations (Sullivan et al. Reference Sullivan, Edson, Hristov and McWilliams2008; Cao & Shen Reference Cao and Shen2021). In our framework, the horizontally averaged $x$-component momentum equation is written as follows:
where the overline denotes the horizontal average along constant $z^*$. Here $F_{p}$, $F_{v}$ and $F_{a}$ denote the vertical flux of horizontal momentum by form stress, viscous stress and advection, respectively, and are defined as follows:
Here, $\omega \equiv h^{-1}(w-z_{t^*}-uz_{x^*}- v z_{y^*}) = \varOmega / h$ is the $z^*$ velocity. The density $\rho$ and total pressure $\tilde {p}$ are non-dimensionalised with the air density, i.e. $\rho =1$ in the air and $r$ in the water. Note that the forecast variable of (4.7) is the layer-thickness-weighted momentum $\overline {hu}$, which includes the momentum associated with both the wave motion and the vortical current. The budget equation of the KE $E\equiv \rho (u^2+ v ^2+w^2)/2$ can be obtained by taking an inner product of (2.8a–c) and $(u, v,w)$:
Here $W_{p}$, $W_{v}$ and $W_{a}$ are the vertical flux of KE by pressure, viscous stress and advection, respectively, $C$ is the conversion term to PE, and $D$ is the dissipation. They are defined as follows:
Here, $S^{ij}=({\partial u _i}/{\partial x _j}+{\partial u _j}/{\partial x _i})/2$ is the strain rate. The PE conversion term $C$ can be decomposed into the local PE increment $\rho {\partial (\overline {hz})}/{\partial t ^*}$ and the vertical flux of PE $\rho {\partial (\overline {h\omega z})}/{\partial z ^*}$ (the right-hand side of (4.10d)), but we only evaluate their total effect. In the following analysis, the momentum and KE budget equation terms are evaluated as temporal averages over $600 \leq t/2{\rm \pi} \leq 1200$.
To separate the influence of wave motions and turbulence, the flux terms in (4.8) and (4.10) are decomposed based on horizontal harmonics. An arbitrary variable $\varphi (x^*, y^*, z^*)$ is expanded in the Fourier series:
Here, $\textrm {i}$ denotes the imaginary unit, $N_x$ and $N_y$ are the number of grid points in $x$ and $y$ direction, respectively. Since $\varphi$ is a real function, the Fourier coefficients satisfy the relation $\hat {\varphi }_{-l\:-m}=\hat {\varphi }^{\star }_{lm}$, where the superscript $\star$ denotes complex conjugate.
Then, a flux composed of a product of two variables $A, B$ can be written as follows:
Here, $\mathrm {Re}$ denotes the real part. Since the leading-order wave motion arises in the wavenumber $(l,m)=(1,0)$, the rectified wave effect is expected to arise mainly in the $\hat {A}_{10}\hat {B}_{10}^\star$ term. We first assessed the contribution of major harmonic components to total flux in the wave-only (AW-noturb) case and then compared the result with AW-ctrl.
First, the first harmonic coefficients of $u$, $w$ and $\tilde {p}$ in the AW-noturb case were investigated to obtain an overview of the wave-induced variation. For an instantaneous field $\varphi$, its first harmonic $\hat {\varphi }_{10}$ is separated into the in-phase ($\hat {\varphi }_{r}$) and quadrature ($\hat {\varphi }_{i}$) parts relative to the surface elevation $\eta$ as follows:
The vertical profile of in-phase and quadrature part of $\hat {u}_{10}$, $\hat {w}_{10}$ and $\hat {\tilde {p}}_{10}$ in the AW-noturb case are shown in figure 10. There, the in-phase part of pressure $\hat {\tilde {p}}_{r}$ is not shown because it does not contribute to the momentum and KE flux. These coefficients are evaluated as the composites during $600{\rm \pi} \leq t<602{\rm \pi}$. Following Cao & Shen (Reference Cao and Shen2021), the coefficients are categorised into major and minor components. Here, $\hat {u}_{r}$, $\hat {w}_{i}$ and $\hat {\tilde {p}}_{r}$ are the major components that are present even in the inviscid interfacial waves, and the minor components arise due to the viscosity and the interaction with Eulerian current.
The harmonic coefficient profiles consist of two parts, namely, the SBL and the bulk region. The SBL is the region near the interface where an oscillatory response to the boundary condition is present, and its e-folding thicknesses in the air and water sides are $\sqrt {2/ {\textit {Re}}_{a}}\approx 1.8\times 10^{-3}\times 2{\rm \pi}$ and $\sqrt {2/{\textit {Re}}_{o}}\approx 5.8\times 10^{-4}\times 2{\rm \pi}$, respectively. Figure 10 shows that the response to the boundary is visible to the extent approximately five times thicker than those values. Therefore, we loosely define the SBL of air and water as $0\leq z^*/2{\rm \pi} \leq 0.01$ and $-0.003\leq z^*/2{\rm \pi} \leq 0$, respectively, and the region outside them as the bulk region.
The water-side profile of $\hat {u}_{r,i}$ and $\hat {w}_{r,i}$ are mostly consistent with the irrotational waves: $u$ is in-phase and $w$ is 90$^\circ$ out-of-phase with $\eta$, and their minor components are nearly zero. In water-side SBL, $\hat {u}_{i}$ shows a slight deviation from zero, which is the response to satisfy the no-slip interfacial boundary condition, whereas $\hat {w}_{r}$ is nearly zero throughout the water side. The phase of $\tilde {p}$ is slightly ahead of $\eta$ (higher pressure at the forward face of the wave). In the air-side bulk region, the major components $\hat {u}_{r}$ and $\hat {w}_{i}$ agree with the irrotational waves. However, the minor components $\hat {u}_{i}$ and $\hat {w}_{r}$ show greater deviation than the water side. From figure 10, it can be seen that $\hat {u}_{r}\hat {w}_{r}+\hat {u}_{i}\hat {w}_{i}\approx 0$, so $u$ and $w$ are still in quadrature. In the air-side SBL, there is a strong SBL response due to the no-slip boundary condition and large density ratio $\rho _{o}/\rho _{a}$, resulting in a strong shear layer just above the interface. As in the water side, the phase of $\tilde {p}$ is slightly ahead of $\eta$.
The momentum flux profile of the AW-noturb case is shown in figure 11(a). In the water side, the net momentum flux $F_{p}+F_{v}+F_{a}$ is upwards with a maximum value at $z^*/2{\rm \pi} \approx -0.08$. Therefore, the horizontal momentum is transferred from the lower part to the near-surface part of the water body. This corresponds to the transformation of the horizontal momentum from the wave motion that is distributed over the vertical scale of $O(0.5)$, to the vortical current that diffuses downwards from the SBL. The upwards momentum transfer in the bulk of the water is performed via the form stress and the advection, and the viscous stress carries momentum downwards. Each term is decomposed into contributions from harmonics, and it is found that the following terms dominate the momentum flux terms:
These terms are plotted in figure 11(a) as markers. The pressure form stress is caused by the relative phase shift of $\tilde {p}$ and $z$. Note that $z$ is in phase with $\eta$ by the model coordinate definition, so $\mathrm {Re} [\hat {\tilde {p}}_{10}\hat {z}_{x^* 10}^\star ]\propto \hat {\tilde {p}}_{i}\hat {\eta }_{r}$, and this correlation is consistent with that observed in figure 10. The viscous stress is composed of two components, out of which the downwards momentum transfer is supported by the phase-independent stress term $\hat {{\mathsf{T}}}^{xz}_{00}=\overline {{\mathsf{T}}^{xz}}$. This is an understandable result considering that the development of the vortical current is well-reproduced in the one-dimensional wave-averaged equation with the momentum imposed as the uniform virtual wave stress at the surface.
In the air side, the momentum is transferred upwards from the near-interface layer to the bulk of the air. The upwards transfer of momentum roughly agrees with the viscous stress, where the phase-independent part $\hat {{\mathsf{T}}}^{xz}_{00}=\overline {{\mathsf{T}}^{xz}}$ plays a central role as in the water side. The pressure and advective momentum fluxes almost cancel each other.
The discussed results are compared with the momentum transfer profile in the presence of turbulence (AW-ctrl), as depicted in figure 11(b). In contrast to the AW-noturb case, the momentum is transferred downwards in the water side. This is because, over $600\leq t/2{\rm \pi} \leq 1200$ of the AW-ctrl case, the Eulerian current profile (figure 7e) developed deeper than the vertical extent of the wave momentum ($z^*\gtrsim -0.5$) due to the presence of turbulence. This is illustrated in the significant difference in $F_{a}$ from AW-noturb. Although the contribution from the first harmonic ($F_{a1}$) is almost unchanged, the turbulent flow structure that arises at other horizontal wavenumbers carries momentum downwards to change the direction of total advective momentum flux in the bulk of the water side. Due to the reduced vertical shear of the horizontal velocity, the downwards momentum transfer by viscosity ($F_{v}$) is also reduced. The pressure-induced momentum transfer is almost unchanged. Although somewhat mild, the change from AW-noturb is also visible in the air side especially away from the interface ($z^*/2{\rm \pi} \leq 0.1$). There, the upwards momentum transfer is intensified compared with the AW-noturb case, and this difference can be attributed to the advective flux. As in the water side, the contribution from the first harmonic is unchanged, and the turbulence influence at other components enhances the upwards momentum transfer.
In both the AW-ctrl and AW-noturb cases, the magnitude of net momentum transfer between air and water is much smaller than that within the water layer. Therefore, most of the horizontal momentum lost from the waves is received as the water-side vortical current that diffuses downwards from the SBL. Since the cross-$z^*$ velocity $\omega$ is zero at the interface by definition, the cross-interface momentum flux is done by the pressure and viscous stresses. At both the air and water sides, the pressure–slope correlation carries momentum upwards, whereas the viscous stress nearly cancels that. Although small, the net momentum flux across the interface was upwards in this case.
The profile of KE source terms and the KE tendency in the AW-noturb case is shown in figure 12(a). The profile of the dissipation differs significantly between the air and water sides. In the air side, strong dissipation occurs in the SBL, whereas the dissipation in the water side occurs over the bulk of the water. The vertically integrated dissipation in the air and water was $9.362\times 10^{-5}$ and $1.009\times 10^{-4}$, respectively. The dissipation term is decomposed into harmonics, and the contribution from the first harmonic, $D_1$ defined as follows, is found to account for most of the total dissipation:
The vertical profile of the PE conversion is less straightforward to interpret, but their vertically integrated value in the air and water is $2.22\times 10^{-7}$ and $-9.80\times 10^{-5}$, respectively. The PE-to-KE conversion in the water is concentrated in the SBL, as the integral of $C$ over $-0.005\leq z^*/2{\rm \pi} \leq 0$ accounts for 98.4 % of the total. The tendency of KE ${\textrm {d} (\overline {hE})}/{\textrm {d} t^*}$ mostly consists of water-side contribution due to the large density ratio, and its vertical structure corresponds to the wave orbital motion. Vertically integrated KE tendency in the air and water is $-9.81\times 10^{-8}$ and $-9.72\times 10^{-5}$, respectively. The total energy loss (vertically integrated $-C-{\partial (hE)}/{\partial t ^*}$) in the air and water is $-1.24\times 10^{-7}$ and $1.95\times 10^{-4}$, respectively. Therefore, most of the energy lost during the wave attenuation originates from the water side, but approximately half of it is transferred to and dissipated in the air-side SBL. Considering the relative contribution of energy dissipation in the air and water (1.3), the fraction above would increase with higher Reynolds number, i.e. longer waves.
The KE flux terms in the AW-noturb case are shown in figure 13(a). In the air side, the pressure flux term carries KE downwards to the air-side SBL, where strong dissipation occurs. Due to the large density ratio, the viscous and advective flux terms contribute little to the total KE flux. In the bulk of the water, KE is transferred upwards by the pressure term and downwards by the viscosity term, resulting in a net downwards flux. In the near-surface water, however, the downwards viscous energy flux sharply approaches zero, resulting in a net upwards energy flux. This supplies energy to the air-side SBL, where the energy is strongly dissipated. Although most of the energy flux is explained with pressure and viscous terms, advective energy flux is also present in both domains, carrying energy towards the interface. All of these flux terms are mostly explained with the first-harmonic contributions defined as follows:
The KE budget equation terms for the AW-ctrl case are shown in figures 12(b) and 13(b). Unlike horizontal momentum, the KE budget profile of the AW-ctrl case is very similar to the AW-noturb case and is mostly explained with the first harmonic contributions. Therefore, the major energetics of the attenuating interfacial waves of $\lambda \approx 1$ m is dominated by the laminar wave dynamics, even in the presence of wave-induced turbulence. Nevertheless, some differences can be seen in the advective flux in the water side. Although the first harmonic $W_{a1}$ still carries KE upwards, the contributions from other components carry KE downwards, resulting in $W_{a1}<0$ in the bulk of the water.
4.4. Comparison of TKE
In order to illustrate the role of the air–water coupling in turbulence production and to investigate its reproducibility with the wave-averaged framework, two additional simulations were conducted. The new simulations, named AW-CL and W-CL, are replications of the AW-ctrl and W-ctrl cases using the CL equation and virtual wave stress as the boundary condition. We focus on the turbulence in the water side, so they were conducted in the rigid-lid water-side domain $-H_{o}\leq z\leq 0$, $\eta =0$. The CL vortex force term with the prescribed Stokes drift $(u^{ {\textit {St}}}(z,t),0,0)$ was added to the governing equation:
Here, $p$ is the generalised pressure that includes both the non-hydrostatic pressure and the Bernoulli head effect and was calculated to retain incompressibility. The horizontal and bottom boundary conditions are the same as the wave-resolving simulations. The dynamical boundary condition at $z=0$ is the prescribed virtual wave stress ((1.2) and (1.4)):
Here, the temporal dependence of virtual wave stress is allowed to reflect the attenuating wave amplitude $a(t)$. The vertical structure of the Stokes drift is provided with the linear surface wave solution:
The temporal decay rate of amplitude is provided with the linear theory ((1.1) and (1.3)):
The initial wave amplitude is $a(0)=0.1$. The simulation was started using the same Gaussian noise as added in the AW-ctrl and W-ctrl cases, and the simulation is conducted until $t=1200{\rm \pi}$ with $\Delta t=2{\rm \pi} /60$. Overall, the flow field obtained in the wave-averaged cases resembled the wave-filtered field of the corresponding wave-resolving cases. To quantitatively compare the temporal growth of the flow field, the variance of the turbulent velocity $u'$, $ v '$, $w'$ is examined in the following.
Figure 14 shows the temporal evolution of $\overline {u^{\prime 2}}$, $\overline { v ^{\prime 2}}$ and $\overline {w^{\prime 2}}$, averaged over $-0.4\leq z^*\leq 0$. Each case shows the accelerating growth of variances over $0\leq t\leq 300$, suggesting some instability mechanism at work. The comparison of the AW-ctrl and W-ctrl cases illustrates that the presence of a coupled air layer intensifies the wave-induced water turbulence. The velocity variance in the initial growth stage of the AW-ctrl and W-ctrl cases clearly differ: the variance grows quicker and reaches a greater value in AW-ctrl. This is consistent with the fact that a stronger Eulerian mean drift was seen in the air–water coupled case than in the water-only case (figure 7). Once the initial instability saturates at $t/2{\rm \pi} \approx 500$, the time series exhibits more chaotic behaviour. Thereafter, each variance component of AW-ctrl is clearly greater than the corresponding value in W-ctrl.
Comparison between the wave-averaged cases and their corresponding wave-resolving cases illustrates the reproducibility of the simulated wave-induced turbulence in the wave-averaged dynamics. In the initial growth phase ($0\leq t/2{\rm \pi} \leq 300$), the wave-averaged cases very well trace the corresponding wave-resolving cases. After the saturated phase ($t/2{\rm \pi} \approx 500$), the wave-averaged cases show deviation from the wave-resolving cases due to the chaotic behaviour of the mature flow. However, the spread of the time series of the AW-ctrl/CL pair overlaps each other and is distinct from the W-ctrl/CL pair, which is especially visible in the time series of $\overline {u^{\prime 2}}$. Therefore, we conclude that the simulated wave-induced turbulence can be successfully reproduced using the CL equation and the virtual wave stress as the imposed boundary condition.
5. Discussion and conclusion
To clarify the role of air–water coupling in WL turbulence production, a wave-resolving DNS of the air–water interfacial wave has been conducted and compared with other simulation set-ups such as a free surface wave-resolving DNS. At the bottom of the air, a very sharp SBL develops, where a significant amount of KE is dissipated. As a result, the wave attenuation rate is enhanced compared with the water-only case. Even in the presence of WL turbulence, the attenuation rate was well-predicted by the linear theory of Dore (Reference Dore1978).
The simulation results suggest that the WL turbulence is produced by the CL2 instability mechanism under the Eulerian mean drift induced by the horizontal momentum supplied from the attenuated wave. This conclusion qualitatively aligns with the preceding studies, such as Tsai et al. (Reference Tsai, Lu, Chen, Dai and Phillips2017) and Fujiwara et al. (Reference Fujiwara, Yoshikawa and Matsumura2020), but the resulting turbulence was intensified due to the enhanced momentum transfer from the wave. The momentum and energy budget analysis revealed the detailed flow of these quantities: although a significant fraction of energy lost from the water is transferred to the air and dissipated there, the momentum of wave motion is confined within the water. The present understanding is crucial for quantitatively interpreting laboratory results and extrapolating them to the field scale, as the water surface is constantly in contact with air in reality.
Among many cases conducted in the tank experiments of Savelyev et al. (Reference Savelyev, Maxeiner and Chalikov2012), there are a series of cases with $k=6.32\,{\rm m}^{-1}$ ($\lambda =0.99\,{\rm m}$), which is close to the parameter choice of the present simulations ($\lambda \approx 1\,{\rm m}$). The experimental spanwise wavenumber $l$ is evaluated as in Tsai et al. (Reference Tsai, Lu, Chen, Dai and Phillips2017), $l=\lambda /L_{eddy}$, where $\lambda$ is wavelength and $L_{eddy}$ is the eddy size provided in Savelyev et al. (Reference Savelyev, Maxeiner and Chalikov2012). Here $L_{eddy}$ was measured at the initial stage of vortex formation, so $l$ is compared with the maximum value of $l_s$ (figure 9), which reflects the characteristic scale of growing instability. In the AW-ctrl and W-ctrl cases ($ak=0.1$), we obtained $l_s=15$ and $14$, respectively. In Savelyev et al. (Reference Savelyev, Maxeiner and Chalikov2012), the case with $ak=0.136$ led to $l=13.1$. Although it would be safe to say that the laboratory and numerical experiments roughly agree, the interpretation of the values provided is not so straightforward because of the difference in experiment parameters and evaluation methods.
In the linear stability analysis conducted by Tsai et al. (Reference Tsai, Lu, Chen, Dai and Phillips2017), the only non-dimensional number characterising the problem was the Langmuir number
where $u_*=(\tau ^{vws}/\rho _{o})^{1/2}$ is the water-side friction velocity associated with virtual wave stress. They used the water-side only virtual wave stress ($\tau ^{vws}=\tau ^{vws}_{o}$) and obtained $\textrm {La}=\nu _{o}/2^{1/2}a^2\sigma$. However, when interpreting the laboratory experiment result, the virtual wave stress based on the theory of Dore (Reference Dore1978, i.e. $\tau ^{vws}=\tau ^{vws}_{ao}$) would be more appropriate. As a result,
is obtained. Assuming the material parameters at $10\,^\circ {\rm C}$ (§ 1) and wavelength $\lambda =140$ cm, the Langmuir number is reduced by 36 % compared with the water-only case, and the reduction is greater for longer waves. This modification of the Langmuir number somewhat reduces the scatter of the experimental data by Savelyev et al. (Reference Savelyev, Maxeiner and Chalikov2012) shown in figure 9 of Tsai et al. (Reference Tsai, Lu, Chen, Dai and Phillips2017). When the Langmuir number is evaluated as (5.1), the correlation coefficient between $-\log _{10}(\textrm {La})$ and $l$ is 0.45, and when (5.2) is used instead, it increases to 0.51.
Consequently, a physically plausible approach to synthesise the parameterisations for LCs and WL turbulence is to use the wave-averaged large-eddy simulation based on the CL equation with the surface wind stress incremented by the virtual wave stress. Many of the present parameterisations that incorporate mixing by LCs are based on this framework without virtual wave stress and employ the friction velocity $u_*\equiv (\tau /\rho _{o})^{1/2}$ to characterise the shear of the Eulerian current (e.g. Li et al. Reference Li2019). Therefore, the effect of virtual wave stress can be easily incorporated into these parameterisations by increasing $u_*^2$ by $\tau ^{vws}_{ao}/\rho _{o}$.
For the estimation of virtual wave stress under a realistic wind-wave spectrum, more understanding of the energy dissipation mechanism is required. One important issue remaining to be solved is the turbulence transition of the air-side Stokes layer. One of the state-of-the-art wave model source function packages (Ardhuin et al. Reference Ardhuin2010) assumes that such a transition occurs when the air-side significant Reynolds number $2u_{{orb},s}H_s/\nu _{a}$, where $u_{{orb},s}$ is the significant surface orbital velocity and $H_s$ is the significant wave height, exceeds a certain limit value. Once the turbulence transition occurs, wave energy will be dissipated more efficiently, and the virtual wave stress will be further increased. In our wave-resolving DNS, such a transition could not be observed due to the smallness of the Reynolds number, so a further experimental or computational investigation of this boundary layer under a higher Reynolds number is necessary. Even without turbulence transition, the large-amplitude waves can trigger other effects, such as the generation of parasitic capillary waves and microbreaking (e.g. Tsai & Hung Reference Tsai and Hung2007; Deike, Popinet & Melville Reference Deike, Popinet and Melville2015), modulational instability interacting with currents Li & Chabchoub (Reference Li and Chabchoub2024) and so on. Such finite-amplitude effects should be explored further in the future. If the linear laminar theory of Dore (Reference Dore1978) remains applicable and the deep-water dispersion relation is assumed, the virtual wave stress can be estimated from a wave variance density spectrum $E(\sigma,\theta )$ following
where the virtual wave stress transfer function $G(\sigma )$ is defined as follows:
For reference, with the physical parameters at 10 $^\circ$C, $G(\sigma )$ is $1.4\times 10^{0}$, $7.0\times 10^{-3}$ and $9.5\times 10^{-4}$ N m$^{-4}$ for 1-, 4- and 7-second-period waves, respectively. With a 7-second-period swell with one-side amplitude of 1 m, virtual wave stress would be $4.75\times 10^{-4}$ N m$^{-2}$. Therefore, the influence of additional momentum flux via virtual wave stress is well below a typical wind stress value unless the turbulence transition occurs. Nevertheless, its effect is worth exploring in the future because the CL2 instability efficiently produces near-surface turbulence even under slack conditions, potentially influencing phenomena such as the sea-surface skin temperature.
Acknowledgements
The author appreciates Dr Y. Yoshikawa at Kyoto University for an insightful feedback to the earlier version of this article. A part of the numerical model code is adopted from the ocean model developed by Dr Y. Matsumura at the University of Tokyo. The author appreciates for valuable comments and suggestions provided by three anonymous reviewers.
Funding
This study was supported by the Japan Society for the Promotion of Sciences (grant number JP22K20385) and Ministry of Education, Culture, Sports, Science and Technology (grant number JP23H04820). This work was supported in part by the Collaborative Research Program of Research Institute for Applied Mechanics, Kyushu University.
Declaration of interests
The author reports no conflict of interest.
Data availability statement
The data obtained from the numerical simulations are made available on request.
Author contributions
Y.F. designed and developed the two-phase coupled numerical model, conducted numerical experiments and its analyses, and wrote the manuscript.
Appendix A. Performance test of the two-phase model
A.1. Small- and finite-amplitude interfacial waves
First, let us consider the inviscid interfacial waves of small amplitude to study the model reproducibility of dispersion relation and its resolution dependence. The dispersion relation of small-amplitude deep-water interfacial gravity waves is given by
where $k$ is the horizontal wave number and $\sigma$ is the angular frequency of the wave.
We normalised the equation with the length scale $k^{-1}$ and time scale $\sqrt {gk}$. Let us consider a $x$–$z$ two-dimensional domain with the domain size $(L_x, H_{a}, H_{o})=(2{\rm \pi}, 4{\rm \pi}, 4{\rm \pi} )$ ($L_x$ is the domain size in the $x$ direction). For the interfacial wave with the horizontal wavenumber 1, this depth of domain is effectively the deep-water condition. The number of grid points is 16 in the horizontal. Both the air and water sides were discretised with uniformly distributed $N_z$ grid points in the vertical, and the sensitivity to the vertical resolution was investigated through cases with $N_z=(16, 32, 64, 128, 256)$. Two sets of density, $(\rho _{a}, \rho _{o})=(1,10)$ and $(1,1000)$, were considered in each $N_z$. The simulation was initialised using the orbital velocity of propagating small-amplitude interfacial wave:
Here, $a=10^{-4}$ was chosen, and $\sigma$ was provided with (A1). The simulation was conducted with $\Delta t = 2{\rm \pi} / 100$ for over 120 periods, and the wave period was calculated as the average of the first 100 waves obtained from the zero-up-cross analysis.
The angular frequency calculated from the simulation is plotted against $N_z$ in figure 15(a). With sufficient vertical resolution, the model can accurately simulate the dispersion relation of the deep-water interfacial waves. The error is dominated by the vertical discretisation in this setting and is of $O(\Delta z^{*2})$. The relative error is $0.06\,\%$ with $N_z=128$ ($\Delta z^*=2{\rm \pi} /64$).
We also examined the error in total energy
which should ideally be conserved. The numerical energy amplification rate $\gamma$ was evaluated by fitting $E(t)=E_0 {\rm e}^{\gamma t}$. In cases where $\rho _{o}=1000$, $\gamma \approx -1.1\times 10^{-6}$ regardless of $N_z$. This artificial attenuation is dominated by the temporal discretisation of $O(\Delta t^5)$, as it is reduced to $\gamma \approx -3.3\times 10^{-8}$ with halved timestep. Since the mass and momentum equations are discretised based on the flux form (2.8) and (2.9), the error in mass and momentum was extremely small, with relative error below $O(10^{-12})$ even for the finite-amplitude cases described in the following.
Next, we considered the dispersion relation of finite-amplitude waves to examine the model performance on weakly nonlinear phenomena. As in free-surface waves (Stokes Reference Stokes1847), nonlinearity modifies the dispersion relation of the interfacial gravity waves. Tsuji & Nagata (Reference Tsuji and Nagata1973) applied the Stokes expansion to the deep-water interfacial wave problem and obtained the asymptotic solution to the fifth order in interfacial slope $ak$. Following Tsuji & Nagata (Reference Tsuji and Nagata1973), the angular frequency is
to the fifth order in $ak$. Here, $\sigma _0=[gk(\rho _{o}-\rho _{a})/(\rho _{o}+\rho _{a})]^{1/2}$ is the angular frequency of the small-amplitude deep-water wave.
We adopted the same normalisation and domain as in the small-amplitude cases. The number of grid points is 64 in horizontal and 128 in vertical in both air and water sides. Two sets of density, $(\rho _{a}, \rho _{o})=(1,10)$ and $(1,1000)$, were considered, and the initial interfacial slope was set to $ak= 0.01, 0.05, 0.10, 0.15, 0.20, 0.25$ and $0.30$. The fifth-order Stokes wave solution of Tsuji & Nagata (Reference Tsuji and Nagata1973) was used as the initial field, and the simulation was conducted with the integration time step of $\Delta t=2{\rm \pi} /200$. The zero-up-cross analysis was applied to the interface elevation at a certain point, and the wave periods of the first 50 waves were analysed.
The simulated angular frequency normalised with the linear angular frequency $\sigma _0$ in each density ratio is plotted against $ak$ in figure 15(b). The average of the angular frequencies of the 50 waves is denoted with circles, and their standard deviation is denoted with error bars. The averaged angular frequencies follow the asymptotic dispersion relation well within the cases we studied. However, in large-amplitude cases ($ak=0.25, 0.30$) of $\rho _{o}=10$, the initial wave shape was not retained and the wave periods showed some scatter. In general, increased interfacial slopes lead to an increased number of iterations required for solving the Poisson equation. In $\rho _{o}=1000$ series, the number of iterations required for convergence was $7$ with $ak=0.10$ but $15$ with $ak=0.30$.
A.2. Laminar Miles instability
Subsequently, we studied the wind–wave interaction problem. We adopted the problem set-up introduced by Miles (Reference Miles1957), where a parallel shear flow interacts with the underlying small-amplitude surface waves via interfacial pressure. Here, inviscid laminar flow was considered following the simplification made by Miles (Reference Miles1957). Logarithmic wind profiles are superposed over small-amplitude gravity wave as the initial condition. The growth rate of the waves evaluated over the first tens of wave periods of the simulations, which corresponds to the linear instability phase, and is compared with the analytic growth rate of Miles (Reference Miles1959).
Let us consider inviscid air and water with a density ratio of $\rho _{o}/\rho _{a}=1.0\times 10^3$. There, a small-amplitude interfacial deep-water wave with a horizontal wavenumber $k$ will have angular frequency $\sigma = [gk(\rho _o-\rho _{a})/(\rho _o+\rho _{a})]^{1/2}$. We used $k^{-1}$ and $\sigma ^{-1}$ to normalise the length and time scales, respectively. A $x$–$z$ two-dimensional domain with domain size $(L_x, H_{a}, H_{o})=(2{\rm \pi}, 2{\rm \pi}, 2{\rm \pi} )$ was considered. The domain was discretised with 12 grid points in the horizontal. The vertical grid points clustered near the interface, with layer thickness varying exponentially at a ratio of 1.02. We investigated the sensitivity to the vertical resolution, which is detailed in the following.
Let us consider a logarithmic wind profile $u=(u_*/\kappa )\log (z/z_0)$ in the air side, as employed in the calculation of growth rate by Miles (Reference Miles1959). Here, $u_*$ is the friction velocity, $\kappa =0.4$ is von Kármán constant and the roughness length $z_0$ was specified using the non-dimensionalised Charnock's relation $z_0=0.01u_*^2$. With this, the critical level $z_c$ can be related to $u_*$ as $z_c=0.01u_*^2{\rm e}^{\kappa /u_*}$, where $z_c$ is the height at which $u(z_c)=1$. Four critical levels $z_c=2{\rm \pi} /10$, $2{\rm \pi} /40$, $2{\rm \pi} /160$ and $2{\rm \pi} /640$ were considered. For each $z_c$, the first vertical layer thickness was adjusted such that the layer between the critical level and the interface would be resolved with $N_c=2$, 4, 8 and 16 grid points. The total vertical grid points in the air side varied from $17$ ($z_c=2{\rm \pi} /10$, $N_c=2$) to $269$ ($z_c=2{\rm \pi} /640$, $N_c=16$). The water-side layer thicknesses were set symmetrically to the air side.
As an initial condition, the air-side logarithmic wind profile is superposed on the small-amplitude orbital motion (A2) with $a=10^{-4}$. Simulation is conducted for $100{\rm \pi}$ with $\Delta t=2{\rm \pi} /360$. Following Miles (Reference Miles1957), the wave growth rate was evaluated as $\beta =\mathrm {Im}(\hat {\tilde {p}}/\hat {\eta }) / (\rho _{a} u_*^2 / \kappa ^2)$, where hat denotes the Fourier coefficient of the component with horizontal wavenumber $k=1$ and $\mathrm {Im}$ denotes the imaginary part. We evaluated $\beta$ as the time average over $2{\rm \pi} \leq t \leq 62{\rm \pi}$.
The temporal evolution of wave amplitude for a case with $kz_c=2{\rm \pi} /640$ is shown in figure 16. The amplitude is evaluated as $a(t)=2|\hat {\eta }|$. Initially, the waves in all cases grow at the same rate. Over the simulation period we have conducted, we cannot clearly distinguish linear and exponential growth, but we refer to it as linear growth for convenience. Cases with lower vertical resolution start to deviate from the linear growth at a certain point. The wave of the $N_c=16$ case remains in the linear growth phase throughout the simulation period, which is about 50 wave periods. When the lower-resolution cases deviate from the linear growth, the flow structure near the critical level seems to be no longer maintained in phase with the wave because of the coarse representation of the wind profile.
The evaluated wave growth rate $\beta$ was plotted against the critical level normalised with the wavenumber in figure 17 together with the theoretical curve computed by Miles (Reference Miles1959). With sufficient vertical resolution like $N_c=8$ or $16$, our simulation effectively reproduces the theoretical growth rate. This suggests that the model can accurately reproduce the weak coupling of sheared wind and water waves, a crucial process in wind–wave interaction.
Appendix B. Modification of model formulation for the air-side-only simulations
The numerical procedure for the two-phase fluid can be extended to the air-side-only simulation where $\eta (x,y,t)$ is provided externally. In this case, the unknown variables are $U$, $V$ and $W$ ($K_{a}$ points in vertical), and $P$ in the air-side domain and the interface ($K_{a}+1$ points in vertical). The kinematic boundary condition at the interface is shown in (2.3), whose left-hand side is a known function. Time advancement of $U$, $V$ and $W$ is conducted with (2.8a–c). The pressure Poisson equation at the air-side layer centres ($k=1,\ldots,K_{a}$) is shown in (2.13). At the air–water interface ($k=0$), (2.15) is modified based on the kinematic boundary condition (2.3) for $z=\eta +0$:
Since we did not need to match the definition of $P$ in the air- and water-side domains, we simply define $P_0$ as $P_0\equiv p$, and the vertical derivatives in (B1) is interpreted accordingly.
Appendix C. Evaluation of error induced by interfacial velocity approximation
In the present model, the interfacial velocity to evaluate the viscous stress is approximated with the value at the water-side top layer to reduce computational cost. As a result, the interfacial velocity is expected to contain error of $O(\rho _{a}\nu _{a}/\rho _{o}\nu _{o})$ as discussed in § 2.3. Here, the influence of the error introduced by the approximation is discussed by evaluating the ‘exact’ interfacial velocity. From the instantaneous velocity fields (every $50{\rm \pi}$ time interval) of the AW-noturb case, the exact interfacial velocity $u_{i}$ is obtained through the iterative method such that the viscous stress evaluated with the air- and water-side velocity gradients would satisfy the continuity of the tangential and normal stresses. The iteration was conducted by alternately updating the interfacial velocity and stress until convergence. We have evaluated the error in the AW-ctrl as well, and it was almost identical to the AW-noturb case. Therefore, to facilitate the sensitivity analysis conducted later, we focus on the AW-noturb case here.
In figure 18, the interfacial velocity $u_{i}$ and the interfacial stress components $\tau ^{tx}_{i}$, $\tau ^n_{i}$ and $\tilde {p}_{nh}$ with exact and approximated formulations are shown for the AW-noturb case at $t/2{\rm \pi} =300.08$. The following descriptions apply for other times in the simulation period. As expected from the theoretical analysis, the interfacial velocity contains the relative error of $O(1)\%$. This results in $O(1)\%$ relative error in viscous stress at the interface. The error in interfacial pressure is $O(0.01)\%$ of the dynamical values, but its absolute error $O(10^{-5})$ is similar to that of $\tau ^{tx}_{i}$. Averaged over the simulation period, the net horizontal momentum transfer from water to air is enhanced by $7.7\times 10^{-8}$ in the approximated formulation compared with the exact evaluation. This amount of error is $O(0.1)\%$ of the momentum flux controlling the major dynamics (figure 11). In addition, the net energy flux from water to air is reduced by $9.8\times 10^{-7}$ in the approximated formulation, which is $O(1)\%$ of the major energy flux (figure 13). Therefore, the influence of the interfacial velocity approximation on the dynamics reported in § 4 can be considered minor.
To examine the sensitivity to the vertical resolution, an additional case with doubled vertical resolution (AW-noturb-highres) is conducted. There, the numbers of vertical grid points are doubled in both air and water sides, and the thicknesses of layer neighbouring the interface is specified to be $0.25(2/ {\textit {Re}}_{{a},{o}})^{1/2}$ (half of the AW-noturb case). As a result, the vertical grid spacings are halved compared with the AW-noturb case almost uniformly throughout the domain. The interfacial velocity and stress errors are shown as green dashed lines in figure 18(b–e). The magnitude of the error is nearly halved compared with the AW-noturb case, so the error introduced by this approximation is proportional to $\Delta z^*$.
Appendix D. Error time series of the AW-a2 and AW-deepnoise cases
The numerical error is monitored for the AW-a2 and AW-deepnoise cases and shown in figures 19 and 20, respectively. In the AW-a2 case, the numerical error is greater than cases with $ak=0.1$ (figures 2 and 20), but it is still much smaller than the signals from major dynamics. For example, the numerical error of total energy led to increase of 0.04 % compared with $E(0)$ over 1000 wave periods, but it is 0.1 % of the energy dissipation induced by viscosity. In addition, mass divergence $|\boldsymbol {\nabla }\boldsymbol {\cdot }\boldsymbol {u}|$ is greater than AW-ctrl, but is still about $10^{-5}$ smaller than the characteristic strain rate by the wave orbital motion ($ak\sigma = 0.2$).
Appendix E. Sensitivity of turbulence structure to domain size
The periodic boundary conditions could restrict the turbulent structure to certain wavenumbers and affect the results. To examine the possible domain dependence of the result, we consider two sensitivity tests with a domain size modified from the AW-ctrl, AW-narrow ($L_x=2{\rm \pi}, L_y=1.8{\rm \pi}$) and AW-long ($L_x=4{\rm \pi}, L_y=1.8{\rm \pi}$) cases. Sensitivity to spanwise (streamwise) domain size can be studied by comparing the AW-ctrl and AW-narrow (AW-long and AW-narrow) cases. In figure 21, the temporal evolution of waterside TKE and spanwise wavelength $l_s$ averaged over $-0.4\leq z^*\leq 0$ are shown. Both TKE and $l_s$ agree among cases in general. There are some time-dependent fluctuations after the turbulence becomes mature, but there is no clear bias in any of the three. Therefore, the general water-side turbulence behaviour of the AW-ctrl case can be considered independent of the domain size.
On the other hand, the domain size independence on the air side is difficult to ensure due to the large vortex structure. In both the AW-ctrl and AW-narrow cases, the number of major vortex pairs in the air side was two, which means that the major spanwise wavenumber $l_s$ is different. However, the vortices in the air do not play a major role in the dynamics of wave attenuation, the dynamical understanding obtained in the AW-ctrl case remains unchanged.