Hostname: page-component-586b7cd67f-g8jcs Total loading time: 0 Render date: 2024-11-26T05:48:26.615Z Has data issue: false hasContentIssue false

Detailed numerical investigation of the drop aerobreakup in the bag breakup regime

Published online by Cambridge University Press:  03 October 2023
Y. Ling*
Affiliation:
Department of Mechanical Engineering, University of South Carolina, Columbia, SC 29208, USA Department of Mechanical Engineering, Baylor University, Waco, TX 76798, USA
T. Mahmood
Affiliation:
Department of Mechanical Engineering, Baylor University, Waco, TX 76798, USA
*
Email address for correspondence: [email protected]

Abstract

Aerobreakup of drops is a fundamental two-phase flow problem that is essential to many spray applications. A parametric numerical study was performed by varying the gas stream velocity, focusing on the regime of moderate Weber numbers, in which the drop deforms to a forward bag. When the bag is unstable, it inflates and disintegrates into small droplets. Detailed numerical simulations were conducted using the volume-of-fluid method on an adaptive octree mesh to investigate the aerobreakup dynamics. Grid-refinement studies show that converged three-dimensional simulation results for drop deformation and bag formation are achieved by the refinement level equivalent to 512 cells across the initial drop diameter. To resolve the thin liquid sheet when the bag inflates, the mesh is refined further to 2048 cells across the initial drop diameter. The simulation results for the drop length and radius were validated against previous experiments, and good agreement was achieved. The high-resolution results of drop morphological evolution were used to identify the different phases in the aerobreakup process, and to characterize the distinct flow features and dominant mechanisms in each phase. In the early time, the drop deformation and velocity are independent of the Weber number, and a new internal-flow deformation model, which respects this asymptotic limit, has been developed. The pressure and velocity fields around the drop were shown to better understand the internal flow and interfacial instability that dictate the drop deformation. Finally, the impact of drop deformation on the drop dynamics was discussed.

Type
JFM Papers
Copyright
© The Author(s), 2023. Published by Cambridge University Press

1. Introduction

When a drop is subjected to a high-speed gas stream, the drop can experience significant deformation or even breakup. If the stabilizing forces, including surface tension and viscous forces, are not sufficient to overcome the destabilizing inertia force, then the drop will break into a collection of child droplets of different sizes (Taylor Reference Taylor1949; Guildenbecher, López-Rivera & Sojka Reference Guildenbecher, López-Rivera and Sojka2009; Theofanous Reference Theofanous2011). The aerodynamic breakup (or aerobreakup) of drops is essential to many spray applications, such as liquid fuel injection and spray cooling, and has therefore been studied extensively in the past decades.

Though the interaction between the drop and surrounding gas in practical aerobreakup applications usually involves many complex factors, drop aerobreakup is formulated typically in a simplified configuration, i.e. an initially stationary and spherical drop is suddenly exposed to an unbounded uniform gas stream (Theofanous & Li Reference Theofanous and Li2008; Jain et al. Reference Jain, Tyagi, Prakash, Ravikrishna and Tomar2019; Marcotte & Zaleski Reference Marcotte and Zaleski2019). Then the two-phase interfacial flows that dictate the drop deformation and dynamics are fully determined by the densities and viscosities of the drop liquid and the gas, $\rho _l$, $\mu _l$, $\rho _g$ and $\mu _g$, the surface tension $\sigma$, the initial drop diameter $d_0$, and the gas stream velocity $U_0$. The subscripts $g$ and $l$ are used to denote the properties for the gas and liquid, respectively, while the subscript $0$ is used to represent the initial state. The drop is considered to be far away from the free-stream boundary. Furthermore, it is assumed that the Mach number of the gas stream is significantly lower than the critical Mach number, so the compressibility effect can be neglected. Aerobreakup of drops in a supersonic gas stream (Theofanous, Li & Dinh Reference Theofanous, Li and Dinh2004; Theofanous et al. Reference Theofanous, Li, Dinh and Chang2007; Sharma et al. Reference Sharma, Singh, Rao, Kumar and Basu2021) is outside the scope of the present study. We have also considered the liquid as a Newtonian fluid and excluded the non-Newtonian effect of the drop liquids on the process (Joseph, Belanger & Beavers Reference Joseph, Belanger and Beavers1999; Theofanous, Mitkin & Ng Reference Theofanous, Mitkin and Ng2013). As a result, the present problem can be characterized fully by four independent dimensionless parameters: the Weber number ${We} = \rho _g U_0^2 d_0/\sigma$, the Reynolds number ${Re} = \rho _g U_0 d_0/\mu _g$, the Ohnesorge number ${Oh} = \mu _l/\sqrt {\rho _l d_0 \sigma }$, and the gas-to-liquid density ratio ${r}=\rho _g/\rho _l$ (Pilch & Erdman Reference Pilch and Erdman1987; Hsiang & Faeth Reference Hsiang and Faeth1992; Joseph et al. Reference Joseph, Belanger and Beavers1999; Guildenbecher et al. Reference Guildenbecher, López-Rivera and Sojka2009). Alternative dimensionless parameters can be defined based on the above four parameters, such as the gas-to-liquid viscosity ratio ${m}=\mu _g/\mu _l$ (Guildenbecher et al. Reference Guildenbecher, López-Rivera and Sojka2009).

The present study focuses on the regime of millimetre water drops in an air stream, following the recent work by Jackiw & Ashgriz (Reference Jackiw and Ashgriz2021). In this regime, the small values of $r\sim O(10^{-3})$ and ${Oh}\sim O(10^{-3})$, and the large value of $Re\sim O(10^3)$, indicate that surface tension plays the dominant role in resisting drop breakup. The key parameter characterizing drop dynamics and morphology evolution is $We\sim O(10^2)$, which is moderate. Previous experiments using shock tubes (Hinze Reference Hinze1955; Hsiang & Faeth Reference Hsiang and Faeth1995; Joseph et al. Reference Joseph, Belanger and Beavers1999; Theofanous et al. Reference Theofanous, Li and Dinh2004) and continuous jets (Liu & Reitz Reference Liu and Reitz1993; Flock et al. Reference Flock, Guildenbecher, Chen, Sojka and Bauer2012; Zhao et al. Reference Zhao, Liu, Xu, Li and Lin2013; Opfer et al. Reference Opfer, Roisman, Venzmer, Klostermann and Tropea2014; Guildenbecher et al. Reference Guildenbecher, Gao, Chen and Sojka2017; Jackiw & Ashgriz Reference Jackiw and Ashgriz2021, Reference Jackiw and Ashgriz2022) have identified different breakup modes for low-${Oh}$ drops. The critical Weber number for breakup to occur is ${We}_{cr}\approx 11 \pm 2$. When $We< We_{cr}$, the drop will oscillate without breakup or break into a small number of large child drops due to large-amplitude nonlinear oscillations (also referred to as the vibration breakup mode). As $We>We_{cr}$, the drop will break into a large number of child droplets. The drop morphology upon breakup varies significantly with ${We}$, from bag, bag-stem (or multi-mode), multi-bag and stripping (or sheet-thinning mode) (Hsiang & Faeth Reference Hsiang and Faeth1995; Liu & Reitz Reference Liu and Reitz1997; Guildenbecher et al. Reference Guildenbecher, López-Rivera and Sojka2009; Jackiw & Ashgriz Reference Jackiw and Ashgriz2021). When ${We}$ is sufficiently large, such as $We>10^3$, it has been claimed in previous studies that the drop breaks in the catastrophic mode (Joseph et al. Reference Joseph, Belanger and Beavers1999). However, more recent high-resolution experimental diagnostics suggest that such a breakup mode does not exist (Theofanous & Li Reference Theofanous and Li2008). Different classifications of the breakup regimes have also been proposed, based on the dominant breakup mechanisms (Theofanous et al. Reference Theofanous, Li and Dinh2004). Since the bag, bag-stem and multi-bag breakup modes all involve the formation and inflation of bags, which is driven by the Rayleigh–Taylor instability, they have been reclassified as the Rayleigh–Taylor piercing mode. On the other hand, the sheet-thinning mode has been renamed the shear-induced entrainment mode, since it is driven mainly by the shear on the interface periphery.

The impulsive gas acceleration and continuous non-zero relative velocity between the gas and the drop induce both viscous and inviscid, steady and unsteady drag forces on the drop (Maxey & Riley Reference Maxey and Riley1983; Mei, Lawrence & Adrian Reference Mei, Lawrence and Adrian1991; Ling, Parmar & Balachandar Reference Ling, Parmar and Balachandar2013), resulting in a streamwise acceleration of the drop. As the drop deforms, the gas flow will be modulated, which in turn influences the drop deformation. Consequently, although the surrounding gas flow in the far field is steady, the drop deformation and the gas flow around the drop are highly unsteady. According to the scaling analysis (Ling et al. Reference Ling, Parmar and Balachandar2013), the ratios between the unsteady forces and the quasi-steady drag are proportional to $1/{r}$. For the present cases with $r\ll 1$, the unsteady forces will have a small contribution to the overall drop acceleration. The drop dynamics are dictated by the quasi-steady drag, and the drop velocity will increase following the gas viscous time scale. For cases with a large ${r}$, such as in a pressurized gas environment, the contribution of the unsteady forces to the drop acceleration cannot be ignored (Jain et al. Reference Jain, Tyagi, Prakash, Ravikrishna and Tomar2019; Marcotte & Zaleski Reference Marcotte and Zaleski2019).

Aerodynamic breakup of an isolated drop involves rich physics, and the investigation of the subject is challenging for both experiments and simulations. Due to the highly unsteady flow and complex topology change, an analytical approach is generally not viable, except for limiting cases (Vanden-Broeck & Keller Reference Vanden-Broeck and Keller1980; Miksis, Vanden-Broeck & Keller Reference Miksis, Vanden-Broeck and Keller1981). Previous studies of drop aerobreakup are based on experiments. Thanks to advancements in high-speed imaging, the temporal evolution of the drop morphology can be captured clearly (Theofanous & Li Reference Theofanous and Li2008; Flock et al. Reference Flock, Guildenbecher, Chen, Sojka and Bauer2012; Opfer et al. Reference Opfer, Roisman, Venzmer, Klostermann and Tropea2014; Jackiw & Ashgriz Reference Jackiw and Ashgriz2021). With more sophisticated diagnostics, such as digital in-line holography, the velocity and size of the child droplets can also be measured (Gao et al. Reference Gao, Guildenbecher, Reu, Kulkarni, Sojka and Chen2013; Guildenbecher et al. Reference Guildenbecher, Gao, Chen and Sojka2017). However, it is still challenging to measure high-level details of the drop deformation and gas flows due to the small length and time scales involved. For example, for the bag breakup mode, it is difficult to visualize the velocity and pressure fields inside the bag and to measure directly the thickness and velocity in the bag sheet (Opfer et al. Reference Opfer, Roisman, Venzmer, Klostermann and Tropea2014). Therefore, high-fidelity interface-resolved numerical simulations that can provide these high-level details are essential to investigate drop aerobreakup (Jain et al. Reference Jain, Tyagi, Prakash, Ravikrishna and Tomar2019; Marcotte & Zaleski Reference Marcotte and Zaleski2019).

Fully-resolved simulations of drop aerobreakup are expensive if one aims to resolve all the length scales. For example, for a millimetre-sized drop that breaks in the bag mode, the bag sheet thickness reduces to tens of nanometres before the bag sheet ruptures (Williams & Davis Reference Williams and Davis1982; Burelbach, Bankoff & Davis Reference Burelbach, Bankoff and Davis1988). Previous numerical studies could afford to use a high mesh resolution for two-dimensional (2-D) axisymmetric simulations only (Han & Tryggvason Reference Han and Tryggvason1999, Reference Han and Tryggvason2001; Jing & Xu Reference Jing and Xu2010; Chang, Deng & Theofanous Reference Chang, Deng and Theofanous2013; Jalaal & Mehravaran Reference Jalaal and Mehravaran2014; Strotos et al. Reference Strotos, Malgarinos, Nikolopoulos and Gavaises2016; Stefanitsis et al. Reference Stefanitsis, Malgarinos, Strotos, Nikolopoulos, Kakaras and Gavaises2017; Jain et al. Reference Jain, Tyagi, Prakash, Ravikrishna and Tomar2019; Marcotte & Zaleski Reference Marcotte and Zaleski2019). However, as will be shown later, 2-D axisymmetric simulations will not correctly capture the bag formation in the high ${Re}$ regime since the turbulent wake and its influence on the drop deformation are not resolved faithfully. That explains why even converged 2-D simulations fail to reproduce the bag morphology observed in experiments (Marcotte & Zaleski Reference Marcotte and Zaleski2019). The mesh resolutions in previous three-dimensional (3-D) simulations are generally much lower, and are insufficient to capture the turbulent wake and the bag development (Kekesi, Amberg & Wittberg Reference Kekesi, Amberg and Wittberg2014; Jain et al. Reference Jain, Prakash, Tomar and Ravikrishna2015, Reference Jain, Tyagi, Prakash, Ravikrishna and Tomar2019; Yang et al. Reference Yang, Jia, Sun and Wang2016). There remains a significant gap between the existing simulation results and experimental data.

An important motivation for the study of drop aerobreakup is to develop sub-scale models that can be used in simulations of sprays consisting of a huge number of droplets, for which it is intractable to resolve the interface of each individual drop. The cell size used for simulations of sprays in practical scales is typically much larger than the size of individual drops, therefore the drops are represented by Lagrangian point-particles (Apte, Gorokhovski & Moin Reference Apte, Gorokhovski and Moin2003; Pai & Subramaniam Reference Pai and Subramaniam2006; Balachandar Reference Balachandar2009). The drop motion, shape deformation, topology change, and heat and mass transfer between the drop and the surrounding flow need to be captured by subgrid models (O'Rourke & Amsden Reference O'Rourke and Amsden1987; Hsiang & Faeth Reference Hsiang and Faeth1992). When drop breakup occurs, one also needs to estimate the starting time and end time (Chou & Faeth Reference Chou and Faeth1998; Dai & Faeth Reference Dai and Faeth2001) and the statistics of the child droplets produced (O'Rourke & Amsden Reference O'Rourke and Amsden1987; Hsiang & Faeth Reference Hsiang and Faeth1992; Wert Reference Wert1995; Zhao et al. Reference Zhao, Liu, Xu, Li and Lin2013). For the moderate $We$ regime, the Taylor analogy breakup (TAB) model (O'Rourke & Amsden Reference O'Rourke and Amsden1987) and its subsequent variants (Tanner Reference Tanner1997; Park, Yoon & Hwang Reference Park, Yoon and Hwang2002) have been adopted widely to predict the drop deformation (the time evolution of the drop lateral radius) and the breakup time. The TAB models are based simply on the mass–spring–damper analogy, and there exist coefficients that need to be calibrated based on experimental data. Models that incorporate the flow physics have also been proposed. In the model of Villermaux & Bossa (Reference Villermaux and Bossa2009), the pressure distribution induced by the stagnation flow on the windward surface is considered as the driving force for the lateral expansion of a thin liquid disk, although the model was also extended to predict the overall drop deformation (Kulkarni & Sojka Reference Kulkarni and Sojka2014; Stefanitsis et al. Reference Stefanitsis, Strotos, Nikolopoulos, Kakaras and Gavaises2019b; Rimbert et al. Reference Rimbert, Escobar, Meignen, Hadj-Achour and Gradeck2020; Jackiw & Ashgriz Reference Jackiw and Ashgriz2021). Since the Rayleigh–Taylor instability (RTI) plays a significant role in the formation and development of bags, models based on linear RTI analysis have also been developed to predict the critical condition for the bag formation and also the number of bags to be formed in the multi-bag mode (Harper, Grube & Chang Reference Harper, Grube and Chang1972; Joseph et al. Reference Joseph, Belanger and Beavers1999; Theofanous et al. Reference Theofanous, Li and Dinh2004). For very high ${We}$, the drop breaks in the stripping mode, and the corresponding breakup models are based on the shear instability (Ranger & Nicholls Reference Ranger and Nicholls1969) and the rupture of the thinning liquid sheets (Liu & Reitz Reference Liu and Reitz1997; Lee & Reitz Reference Lee and Reitz2001). Comprehensive reviews of these models have been given in previous studies (Guildenbecher et al. Reference Guildenbecher, López-Rivera and Sojka2009; Jackiw & Ashgriz Reference Jackiw and Ashgriz2021), thus are not repeated here.

Though significant progress has been made in understanding the physics that drives the deformation and breakup of drops at moderate ${We}$, important fundamental questions remain unanswered. When ${We}$ is just above the critical value, a single bag is formed, and the breakup starts when the bag sheet ruptures. When ${We}$ is very large, liquid sheets are formed at the equator and break into small droplets before a bag gets a chance to form near the centre. Between these two asymptotic limits, when ${We}$ is moderate, the drop can deform to a variety of shapes before breakup occurs (Jackiw & Ashgriz Reference Jackiw and Ashgriz2021). The variation in breakup morphology is very sensitive to ${We}$ in the moderate range. As the drop is accelerated by the free stream, it experiences baroclinic torque and RTI on its windward side. Several models based on the linear stability analysis of RTI on a liquid layer of finite thickness (Mikaelian Reference Mikaelian1990, Reference Mikaelian1996) have been proposed to predict the critical Weber number (Joseph et al. Reference Joseph, Belanger and Beavers1999; Theofanous et al. Reference Theofanous, Li and Dinh2004). However, the significance of the RTI, and whether the linear stability model captures the nonlinear development of the bag and the bag morphology change from a simple axisymmetric bag to more complex shapes, remain uncertain, despite its presence on the interface (Guildenbecher et al. Reference Guildenbecher, López-Rivera and Sojka2009). It has been suggested that the Laplace pressure on the edge of the drop/disk contributes to hindering the bag formation or development (Guildenbecher et al. Reference Guildenbecher, López-Rivera and Sojka2009), yet solid evidence to support the argument remains absent.

The goal of the present study is to investigate the aerobreakup of an isolated drop at moderate Weber numbers through detailed interface-resolved 3-D numerical simulation. By using advanced numerical techniques, including the mass–momentum consistent volume-of-fluid method (Arrufat et al. Reference Arrufat, Crialesi-Esposito, Fuster, Ling, Malan, Pal, Scardovelli, Tryggvason and Zaleski2020; Zhang, Popinet & Ling Reference Zhang, Popinet and Ling2020), balanced-force surface tension discretization (Popinet Reference Popinet2009), and adaptive mesh refinement, we aim to resolve fully the two-phase turbulent interfacial flows involved in aerobreakup through large-scale parallel computations. The drop's initial diameter and fluid properties are kept unchanged, and the free-stream gas velocity is varied for a parametric study. Although typically the lateral radius of the drop increases monotonically in time (Flock et al. Reference Flock, Guildenbecher, Chen, Sojka and Bauer2012; Opfer et al. Reference Opfer, Roisman, Venzmer, Klostermann and Tropea2014; Jackiw & Ashgriz Reference Jackiw and Ashgriz2021), the overall deformation is a complex process consisting of different phases with distinct features. The high-level details revealed by the simulation results will be used to identify the dominant mechanisms that dictate the deformation in each phase, and also to characterize the effect of ${We}$.

For the range of ${We}$ considered, the drop will deform from its initial spherical shape to a forward bag with the opening facing the upstream direction. Although it is of great interest to study the rupture of thin bag sheets and the statistics of the droplets generated by the bag and rim breakups (Guildenbecher et al. Reference Guildenbecher, Gao, Chen and Sojka2017; Jackiw & Ashgriz Reference Jackiw and Ashgriz2022), the mesh resolution required to resolve fully the sheet rupture and hole formation is beyond the current available computational capability. If a liquid sheet breaks due to molecular forces, then the thickness must be reduced to tens of nanometres. For simulations of millimetre drops, a fully resolved simulation would need to cover over six orders of magnitude in length scales, which is obviously impractical even with today's computer power. Therefore, the present study will focus mainly on the drop deformation and bag formation and development before the bag sheet rupture occurs. The present simulations can be considered fully resolved and mesh-independent up to the early stage of the bag inflation, but not for the sheet rupture and child drop statistics. Nevertheless, the simulation results still provide important insights into the bag rupture mechanisms, such as the hole–hole interaction, which remain not fully understood. Since the occurrence of holes in the liquid sheet is random, ensemble averaging and statistics of multiple realizations (e.g. hole appearing locations and the number of holes) will be required to characterize fully the rupture dynamics and the statistics of the droplets formed (Mostert, Popinet & Deike Reference Mostert, Popinet and Deike2022; Tang, Adcock & Mostert Reference Tang, Adcock and Mostert2023), though such studies are outside the scope of the present work.

The rest of the paper will be organized as follows. Subsection 2.1 introduces the governing equations, and § 2.2 describes the numerical methods used in the present simulations. The physical parameters and simulation set-up are presented in § 2.3. Before discussing the simulation results, § 3 defines the characteristic length and time scales used to characterize the drop shape and gas flows. Grid-refinement and validation studies are presented in § 4. The simulation results identify different deformation phases, which are discussed in sequence in § 5. The effect of drop deformation on the aerodynamic drag and lift exerted on the drop is discussed in § 6. Finally, § 7 concludes the key findings of the present study.

2. Simulation methods

2.1. Governing equations

The two-phase interfacial flows are governed by the incompressible Navier–Stokes equations with surface tension,

(2.1)\begin{gather} \rho \left(\frac{\partial{u_i}}{\partial{t}} + u_i\,\frac{\partial{u_j}}{\partial{x_j}}\right) ={-}\frac{\partial{p}}{\partial{x_i}} + \frac{\partial{}}{\partial{x_j}}\left[ \mu\left( \frac{\partial{u_i}}{\partial{x_j}} + \frac{\partial{u_j}}{\partial{x_i}} \right) \right] + \sigma \kappa\delta_s n_i, \end{gather}
(2.2)\begin{gather}\frac{\partial{u_i}}{\partial{x_i}} =0 , \end{gather}

where $\rho, u_i, p, \mu$ represent density, velocity vector, pressure and viscosity, respectively. The Dirac distribution function $\delta _s$ is localized on the interface. The surface tension coefficient $\sigma$ is constant, and $\kappa$ and $n_i$ represent the curvature and normal vector of the interface.

The gas and liquid phases are distinguished by the liquid volume fraction $c$, the evolution of which follows the advection equation

(2.3)\begin{equation} \frac{\partial{c}}{\partial{t}} + u_i\,\frac{\partial{c }}{\partial{x_i}} = 0 . \end{equation}

After spatial discretization, the cells with only liquid or gas will exhibit $c=1$ and 0, respectively, while for cells containing the gas–liquid interface, $0< c<1$. The density and viscosity are both defined based on the arithmetic mean:

(2.4)\begin{gather} \rho = \rho_l c + \rho_g (1-c) , \end{gather}
(2.5)\begin{gather}\mu = \mu_l c + \mu_g (1-c) . \end{gather}

2.2. Numerical methods

The governing equations (2.1)–(2.3) are solved using the open-source, multiphase flow solver Basilisk. The Basilisk solver uses a finite-volume method for spatial discretization. The projection method is used to incorporate the incompressibility condition. The advection equation (2.3) is solved via a geometrical volume-of-fluid (VOF) method (Scardovelli & Zaleski Reference Scardovelli and Zaleski1999). The advection of momentum across the interface is conducted consistently with the VOF advection (Arrufat et al. Reference Arrufat, Crialesi-Esposito, Fuster, Ling, Malan, Pal, Scardovelli, Tryggvason and Zaleski2020; Zhang et al. Reference Zhang, Popinet and Ling2020). The mass–momentum consistency is essential for multiphase flows with large density contrast (Zhang et al. Reference Zhang, Popinet and Ling2020). The balanced-force method is used to discretize the singular surface tension term in the momentum equation (Popinet Reference Popinet2009). The interface curvature required to calculate surface tension is computed based on the height-function method (Popinet Reference Popinet2009). The staggered-in-time discretization of the volume fraction/density and pressure leads to a formally second-order-accurate time discretization (Popinet Reference Popinet2009). An adaptive quadtree/octree mesh is used to discretize the computational domain, which allows adaptive mesh refinement in user-defined regions. The mesh adaptation is based on the wavelet estimate of the discretization errors of the liquid volume fraction and velocity (van Hooft et al. Reference van Hooft, Popinet, van Heerwaarden, van der Linden, de Roode and van de Wiel2018). The parallelization of the solver is done through a tree decomposition to guarantee high parallel performance even if a large number of levels of octree cells are used. Numerous validation studies for the Basilisk solver can be found on the Basilisk website and also in our previous studies (Sakakeeny & Ling Reference Sakakeeny and Ling2020, Reference Sakakeeny and Ling2021; Zhang et al. Reference Zhang, Popinet and Ling2020; Sakakeeny et al. Reference Sakakeeny, Deshpande, Deb, Alvarado and Ling2021).

2.3. Simulation set-up

The spherical drop is initially placed in a computational domain filled with stationary gas. We have considered both 2-D-axisymmetric and 3-D domains, as shown in figures 1(a) and 1(b), respectively. At $t=0^+$, a uniform velocity boundary condition (BC) is imposed on the left boundary of the domain, while the pressure outflow boundary condition is applied to the right boundary. Due to the incompressibility condition, the gas is suddenly accelerated to $U_0$ in an infinitesimal time (one time step in the simulation).

Figure 1. Schematics of the computational domains for (a) 2-D-axisymmetric and (b) 3-D simulations.

All lateral boundaries in the 3-D domain are considered as slip walls. For the 2-D domain, the bottom is the axis and the top is a slip wall. The 2-D domain is a square with edge length $l/d_0=16$, while the 3-D domain is a cube with edge length $l/d_0=32$. The domain size is sufficient to resolve the wake behind the drop during the time considered. For all 2-D and 3-D simulations, the drop is initially placed $x_0/d_0=3$ away from the inlet. In the 3-D simulations, the initial location of the drop is at the centre of the $y$$z$ cross-section.

The physical parameters used in the present simulations are chosen to be similar to the experiment of Jackiw & Ashgriz (Reference Jackiw and Ashgriz2021). The liquid and gas are water and air at room temperature, and their fluid properties are given in table 1. The initial drop diameter is fixed at $d_0=1.9$ mm. The corresponding gas-to-liquid density and viscosity ratios are thus small, ${r}=0.0012$ and ${m}=0.018$, respectively. The Ohnesorge number ${Oh}=0.0026$ is very small, indicating that the effect of liquid viscosity on drop breakup is small compared to that of surface tension, and the latter is the dominant force to resist the drop deformation/breakup induced by interaction with the gas stream. Therefore, the Weber number ${We}$ is the key dimensionless parameter that characterizes the aerobreakup dynamics. A parametric study of $We$ is performed here by varying $U_0$ from 18.7 to $24.0\ {\rm m}\ {\rm s}^{-1}$. The Reynolds number will vary from approximately 2400 to 3000 correspondingly. More cases were simulated, but we will focus the discussion on the five cases shown in table 2.

Table 1. Fluid properties for simulation cases.

Table 2. Simulation cases and key parameters.

The 2-D/3-D domains are discretized by quadtree/octree meshes, which are adapted dynamically based on the wavelet estimates of the discretization errors of the liquid volume fraction and all velocity components (van Hooft et al. Reference van Hooft, Popinet, van Heerwaarden, van der Linden, de Roode and van de Wiel2018). The minimum cell size is controlled by the maximum refinement level $\mathcal {L}$, i.e. $\varDelta _{min}=l/2^{\mathcal {L}}$. For 2-D simulations, $\mathcal {L}$ has been varied from 12 to 15, corresponding to 256 to 2048 minimum quadtree cells across the initial drop diameter, i.e. $N=d_0/\varDelta _{min}=256$ to 2048. Due to the higher computational cost for 3-D simulations, we have used a different mesh adaptation strategy. As will be shown later, the mesh resolution required to capture the early deformation of the drop is significantly lower than that required to resolve the thin liquid sheet in the bag. Therefore, we have used a maximum refinement level $\mathcal {L}=12$ to 14, which is equivalent to $N=128$ or 512 to start the simulations, for the purpose of confirming that the resolution is enough to capture the drop deformation until the bag is formed. As the bag grows and the sheet thickness decreases, $\mathcal {L}$ is then increased up to 16 ($N=2048$). For the case ${We}=10.9$, since a thin bag sheet is never formed, $\mathcal {L}=12$ ($N=256$) is used throughout the simulation.

According to the knowledge of the authors, the current mesh resolution is significantly higher than all previous numerical studies, including both 2-D and 3-D simulations in the literature, while the domain is large enough to resolve the wake (Jain et al. Reference Jain, Tyagi, Prakash, Ravikrishna and Tomar2019; Marcotte & Zaleski Reference Marcotte and Zaleski2019). For the 3-D domain, the mesh for $N=2048$ corresponds to 16 levels of adaptively refined octree cells, which is equivalent to $2.8\times 10^{14}$ uniform Cartesian cells. Generally, the total number of octree cells increases over time, as the drop surface area increases and the wake develops. For the case ${We}=15.3$, the number of octree cells reaches approximately 500 million. The high-performance tree-decomposition parallelization technique in the Basilisk solver is essential to guarantee efficient simulations using such large numbers of levels (up to 16), computational cores (up to 3584), and octree cells (up to 500 million).

For the present study, the drop diameter is 1.9 mm, and the minimum cell size for $N=2048$ is approximately $\varDelta _{min} = 0.9\ \mathrm {\mu } {\rm m}$, which is still significantly larger than the physical cutoff length scale dictated by van der Waals forces (${\sim }O(10\ \text {nm})$). Therefore, the interfaces’ pinching and hole formation induced by van der Waals forces will not be captured in the simulation. The hole nucleation in the liquid sheet here is due to the numerical cutoff length, i.e. the minimum cell size $\varDelta _{min}$. When the sheet thickness is smaller than approximately $2\varDelta _{min}$, the flow and pressure in the liquid cannot be well resolved, and the thin region of the liquid sheet represented by the VOF field will be perturbed, and numerical pinching of the interfaces will occur. The numerical breakup leads to earlier hole formation, and as a result, the bag will break at a size smaller than what was observed in experiments. Nevertheless, as indicated in previous experimental studies, holes are observed in the liquid sheet with thickness larger than the length for active molecular forces (Lhuissier & Villermaux Reference Lhuissier and Villermaux2012; Opfer et al. Reference Opfer, Roisman, Venzmer, Klostermann and Tropea2014), probably due to tiny bubbles in the liquid sheet. A more detailed discussion of the effect of mesh resolution on the bag breakup dynamics will be given later, in the results section.

The 2-D simulations were run on the Baylor University cluster Kodiak using 4–36 cores (Intel Xeon Gold 6140 processor). The most refined simulation ($N=2048$) takes approximately 20 days using 36 cores. The 3-D simulations were run on the TACC-Stampede2 (Intel Xeon Platinum 8160) and TACC-Frontera (Intel Xeon Platinum 8280) machines, using up to 3584 cores. The simulation time varies with cases, and the longest one takes approximately 50 days.

3. Parameters to characterize drop aerobreakup

Before we present and discuss the results, we will first introduce the parameters to be measured in the simulation to characterize the drop shape, dynamics and turbulent flows involved in the drop aerobreakup process.

3.1. Drop morphology

To characterize the drop shape at a given time, the maximum and minimum interfacial positions along the Cartesian coordinates were measured, i.e. $x_{max}$, $x_{min}$, $y_{max}$, $y_{min}$, $z_{max}$, $z_{min}$, as shown in figure 2(a). Furthermore, we also measured the maximum and minimum interfacial positions along the $x$-axis (along the streamwise direction), $x_{max,a}$, $x_{min,a}$. Based on these measurements, several characteristic length scales can be obtained.

  1. (i) Length of the drop, $L=x_{max}- x_{min}$.

  2. (ii) Lateral radius of the drop, $R=(y_{max}-y_{min}+z_{max}-z_{min})/4$. When the drop shape is axisymmetric, the maximum lateral radius is $R=y_{max}=-y_{min}=z_{max}=-z_{min}$; otherwise, $R$ is the average for the $y$- and $z$-directions.

  3. (iii) Thickness of the sheet along the $x$-axis, $h_{a}=x_{max,a}-x_{min,a}$. At early times, when the drop shape is axisymmetric and both windward and leeward sides are convex, $h_a=L$. At later times, when the drop deforms to a bag, $h_a$ represents the sheet thickness at the centre of the bag, as shown in figure 2(b).

  4. (iv) Length of the forward bag, $L_{fb}=x_{min,a}- x_{min}$. Here, ‘forward bag’ refers to the bag with the opening facing the upstream direction.

Figure 2. (a) Representative snapshot of the drop surface and velocity magnitude on the central $x$$y$ plane, with annotations showing the characteristic length scales for the drop shape. (b) Time evolution of $h_a=x_{max,a}-x_{min,a}$ for ${We}=15.3$, indicating the time ranges resolved by different mesh resolutions. The horizontal lines indicate the minimum cell size for each mesh. The dimensionless variables are denoted by $\hat {,}$ and defined in (3.10ae) and (3.11).

3.2. Turbulent gas flow and drop dynamics

For the range of ${Re}$ considered, the gas flow in the wake of the drop lies in the chaotic vortex shedding or the subcritical turbulent wake regimes, according to the regime map for a solid sphere (Tiwari et al. Reference Tiwari, Pal, Bale, Minocha, Patwardhan, Nandakumar and Joshi2020b). The gas enstrophy is then used to characterize the gas turbulence, which is calculated as

(3.1)\begin{equation} \varOmega_g = \frac{1}{\mathbb{V}}\int (1-c)\,|\boldsymbol{\omega}|^2 \,{\rm d}V , \end{equation}

where $\boldsymbol {\omega }$ is the vorticity vector, and $\mathbb {V}$ is the volume of the computational domain. The normalized gas enstrophy is defined as $\hat {\varOmega }_g=\varOmega _g d_0/U_0^2$.

The aerodynamic drag exerted on the drop will cause the drop to accelerate along the streamwise direction. The mean velocity of the drop in the $x$-direction is calculated by integrating over all the liquid cells in the domain:

(3.2)\begin{equation} u_d = \frac{\displaystyle\int cu\,{\rm d}V}{\displaystyle\int c\,{\rm d}V} . \end{equation}

Note that this definition is valid only before breakup occurs. Then the drag coefficient can be defined as

(3.3)\begin{equation} C_D = \frac{2 m_d}{\rho_g (U_0-u_d)^2 {\rm \pi}R^2}\,\frac{{\rm d} u_d}{{\rm d} t}, \end{equation}

where $m_d$ is the mass of the drop. Here, $C_D$ is defined based on the instantaneous relative velocity ($U_0-u_d$), and the drop frontal area is estimated by the lateral radius (${\rm \pi} R^2$). As a result, the variation of $C_D$ is generally not influenced by the time variation of $u_d$ and $R$.

The asymmetric drop deformation and the turbulent wake will introduce lift on the drop. The lift coefficients in the transverse directions are defined as

(3.4a,b)\begin{equation} C_{y} = \frac{2 m_d}{\rho_g (U_0-u_d)^2 {\rm \pi}R^2}\,\frac{{\rm d} v_d}{{\rm d} t}, \quad C_{z} = \frac{2 m_d}{\rho_g (U_0-u_d)^2 {\rm \pi}R^2}\,\frac{{\rm d} w_d}{{\rm d} t}, \end{equation}

where $v_d$ and $w_d$ are the mean drop velocities in the $y$- and $z$-directions, respectively, similar to $u_d$.

3.3. Characteristic time scales for drop deformation

The early-time deformation of the drop is driven by the pressure variation in the radial direction, which is in turn induced by the stagnation gas flow on the windward surface of the drop. The viscous and surface tension effects are secondary to the early-time deformation. Then simple scaling analysis shows that the time scale governing the drop deformation is (Ranger & Nicholls Reference Ranger and Nicholls1969; Villermaux & Bossa Reference Villermaux and Bossa2011)

(3.5)\begin{equation} \tau_d = \frac{d_0}{U_0 \sqrt{r}}. \end{equation}

The scaling $\tau _d\sim {r}^{-1/2}$ has been confirmed by the parametric study of Marcotte & Zaleski (Reference Marcotte and Zaleski2019). It was shown that the evolutions of $R$ for different ${r}$ collapse approximately if $t$ is scaled by $\tau _d$. This time scale $\tau _d$ was first introduced by Ranger & Nicholls (Reference Ranger and Nicholls1969) based on the drag on the drop and the resulting acceleration. However, it was shown by Marcotte & Zaleski (Reference Marcotte and Zaleski2019) that the time scale $\tau _d$ actually does not collapse the drop velocity for different ${r}$. In the present study, ${r}$ and $d_0$ are kept constant, so $\tau _d$ varies due to $U_0$.

The surface tension and liquid viscosity resist the drop deformation, and the corresponding time scales are

(3.6)\begin{gather} \tau_s = \sqrt{ \frac{\rho_l d_0^3}{\sigma}}, \end{gather}
(3.7)\begin{gather}\tau_{vl} =\rho_l d_0^2/\mu_l . \end{gather}

The time scale ratios are related to the key dimensionless parameters, i.e. $\tau _s/\tau _{vl}={Oh}$ and ${\tau _s}/{\tau _d} = \sqrt {We}$. For the cases considered here, ${Oh}\sim O(10^{-3})$ is very small, and ${We}\sim O(10)$. As a result, $\tau _{vl} \gg \tau _s > \tau _d$. Therefore, $\tau _{vl}$ is too large to be relevant, and surface tension is the dominant resisting force. Furthermore, since $\tau _s > \tau _d$, we expect the early-time drop deformation will be insensitive to ${We}$.

3.4. Characteristic time scales for drop acceleration

When a stationary drop is suddenly exposed to the free stream, it experiences an impulsive gas acceleration and a continuous non-zero relative velocity. The resulting aerodynamic drag drives the drop to move along the streamwise direction. This treatment can be considered as an approximation of the passage of a shock wave with the post-shock velocity equal to $U_0$, neglecting the compressibility effect, as discussed by Marcotte & Zaleski (Reference Marcotte and Zaleski2019).

The overall drag can be divided into quasi-steady, pressure-gradient, added-mass and Basset history forces (Maxey & Riley Reference Maxey and Riley1983; Ling et al. Reference Ling, Parmar and Balachandar2013). The last three are unsteady contributions, which are triggered mainly by the impulsive acceleration. The pressure-gradient and added-mass forces, often referred to as the inviscid unsteady forces, are active only at $t=0^+$, when the surrounding gas is suddenly accelerated from 0 to $U_0$. In the simulation, this impulse spans one time step, and the integration of the impulse is $U_0$. Therefore, the drop velocity jumps over the first time step due to the inviscid unsteady forces (including added-mass and pressure-gradient forces) as follows (Ling, Haselbacher & Balachandar Reference Ling, Haselbacher and Balachandar2011; Ling et al. Reference Ling, Parmar and Balachandar2013):

(3.8)\begin{equation} u_d(0^+)= \frac{3{r}}{2}\,U_0. \end{equation}

Similar estimates of the velocity jump have been proposed by Marcotte & Zaleski (Reference Marcotte and Zaleski2019) and Hadj-Achour et al. (Reference Hadj-Achour, Rimbert, Gradeck and Meignen2021). Marcotte & Zaleski (Reference Marcotte and Zaleski2019) found that the velocity jump scales with ${r}$, but the scaling coefficient $1/2$ is different from the $3/2$ in (3.8) since they did not include the pressure gradient force. The viscous-unsteady (Basset history) force will last for a finite period of time, characterized by the viscous-unsteady time scale $\tau _{vu}$ (Ling et al. Reference Ling, Parmar and Balachandar2013). Due to the small value of ${r}$ considered here, the contributions of the unsteady forces to the increase in drop velocity are generally small (Ling et al. Reference Ling, Parmar and Balachandar2013). For cases with larger ${r}$, additional attention to the unsteady forces will be required. For the present cases, the quasi-steady force is the dominant force that accelerates the drop. The time scale for the quasi-steady drag is referred to as the response time, $\tau _{qs}$. For ${r}\ll 1$ (Ling et al. Reference Ling, Parmar and Balachandar2013),

(3.9)\begin{equation} \tau_{qs} = \frac{\rho_g d_0^2}{36\mu_g}\,\varPhi, \end{equation}

where $\nu _g=\mu _g/\rho _g$, and $\varPhi$ is the correction factor to the Stokes drag, accounting for the effect of $Re$ and the drop shape. In the limit of zero ${Re}$ and ${We}$, the drop acts like a solid sphere in the Stokes limit, and $\varPhi =1$. For the range of ${Re}$ considered here, $\tau _{qs}\sim O(10^{-1}\ \textrm {s})$. As a result, drop breakup occurs on a time scale much smaller than $\tau _{qs}$ when the drop velocity $u_d$ remains significantly lower than the free-stream velocity $U_0$.

Finally, we define dimensionless variables using $d_0$, $U_0$ and $\rho _g$ as characteristic scales, namely

(3.10ae)\begin{equation} \hat{x}=x/d_0,\quad \hat{L}=L/d_0,\quad \hat{R}=R/d_0,\quad \hat{u} = u/U_0,\quad \hat{p} = p/(\rho_g U_0^2). \end{equation}

Due to the focus on the drop deformation, $\tau _d$ is selected as the characteristic time scale. The dimensionless time is then defined as

(3.11)\begin{equation} \hat{t} = t/\tau_d . \end{equation}

4. Verification and validation

4.1. Grid-refinement studies

The time evolutions of the drop length $\hat {L}$ and radius $\hat {R}$ for different mesh resolutions are shown in figure 3. The initial mesh resolutions are $N=128$, $256$ and $512$. The same mesh refinement strategy has been used for all three meshes, i.e. when the drop deforms to a bag and the bag sheet thickness decreases to approximately 4 cells, refinement level will be increased until $N=2048$, as shown in figure 2(b). It can be seen from figure 3 that the results for $N=256$ and $512$ match very well. The results for $N=128$ are also similar in general, though small deviations are observed for $\hat {t}>1.3$ when the forward bag forms. Therefore, one can conclude that $N=512$ is sufficient to yield converged results for the drop deformation until the bag ruptures, and thus is sufficient to determine the breakup criteria.

Figure 3. Time evolutions of (a) the drop length $\hat {L}$ and (b) the drop radius $\hat {R}$, for $We=15.3$, obtained from the 3-D simulations. The experimental results by Opfer et al. (Reference Opfer, Roisman, Venzmer, Klostermann and Tropea2014), Flock et al. (Reference Flock, Guildenbecher, Chen, Sojka and Bauer2012) and Jackiw & Ashgriz (Reference Jackiw and Ashgriz2021) are shown for comparison.

In order to assess the adequacy of the mesh resolution in resolving the turbulent gas flow and its effect on the drag force, we examine the evolution of the drag coefficient $C_D$ and the gas enstrophy (see figure 4). Both $C_D$ and $\varOmega _g$ exhibit non-monotonic behaviour due to the development of the turbulent wake and the drop deformation. The results obtained with meshes $N=256$ and $512$ show good agreement, with only minor discrepancies for $\hat {t}\gtrsim 1$. Given the inherently chaotic nature of the gas flow, this level of agreement is considered satisfactory.

Figure 4. Time evolutions of (a) drag coefficient $C_D$ and (b) gas enstrophy $\hat {\varOmega }_g=\varOmega _g d_0/U_0^2$ for ${We}=15.3$. The 3-D simulation results for two different mesh resolutions, $N=256$ and 512, are shown. In (b), the results for $N=256$ were obtained by the mesh refinement $\mathcal {L}=14$ without further increase, as in other cases.

4.2. Experimental validation

The simulation results obtained for the case ${We}=15.3$ are validated against available experimental data for the drop length $\hat {L}$ and radius $\hat {R}$. Specifically, comparison is made with the experiments of Jackiw & Ashgriz (Reference Jackiw and Ashgriz2021) (water, ${We}=15.3$ and 16.0), Opfer et al. (Reference Opfer, Roisman, Venzmer, Klostermann and Tropea2014) (ethylene glycol, ${We}=15.1$), and Flock et al. (Reference Flock, Guildenbecher, Chen, Sojka and Bauer2012) (ethyl alcohol, ${We}=12.7$). The parameters employed for the present simulations are chosen to be similar to those adopted in the experiments conducted by Jackiw & Ashgriz (Reference Jackiw and Ashgriz2021) (JA). Although the dimensionless parameters for the two other experiments are not identical to those in the present study, the small values of ${Oh}$ and ${r}$, and the large value of ${Re}$, in all cases suggest that the aerobreakup dynamics for similar ${We}$ is expected to be comparable to the present cases. Thus the experimental data serve as an important validation benchmark for the present numerical simulations.

It can be observed from figure 3 that the simulation results for both $\hat {L}$ and $\hat {R}$ exhibit remarkable agreement with the experimental data of JA and Opfer et al. (Reference Opfer, Roisman, Venzmer, Klostermann and Tropea2014) at early times. The deviations from the experimental results of Flock et al. (Reference Flock, Guildenbecher, Chen, Sojka and Bauer2012) are relatively small, given that the experimental parameters, such as ${We}=12.7$, do not match the present simulations exactly. The simulation results for $\hat {R}$ deviate from the JA experimental data for the same ${We}=15.3$ at approximately $\hat {t}=0.7$, but they match quite well with the JA experimental results for a slightly larger ${We}=16$ and the other two experiments. The discrepancy may be due to the high degree of variation inherent in such experiments. Unlike the results of Opfer et al. (Reference Opfer, Roisman, Venzmer, Klostermann and Tropea2014) and Flock et al. (Reference Flock, Guildenbecher, Chen, Sojka and Bauer2012), which are averaged data for multiple experiments, those of JA correspond to single experimental runs and thus exhibit higher uncertainty. Moreover, in JA's experiment, the drop is suspended from a needle, which may significantly influence the development of the drop radius, as discussed in the appendix of their paper.

4.3. Limitations of 2-D axisymmetric simulations

Due to the high computational cost of 3-D simulations, 2-D axisymmetric simulations have been used widely in numerical studies of drop aerobreakup (Jain et al. Reference Jain, Tyagi, Prakash, Ravikrishna and Tomar2019; Marcotte & Zaleski Reference Marcotte and Zaleski2019; Stefanitsis et al. Reference Stefanitsis, Malgarinos, Strotos, Nikolopoulos, Kakaras and Gavaises2019a). However, previous studies for bubbles (Blanco & Magnaudet Reference Blanco and Magnaudet1995; Magnaudet & Mougin Reference Magnaudet and Mougin2007) and drops (Rimbert et al. Reference Rimbert, Escobar, Meignen, Hadj-Achour and Gradeck2020) have also indicated that 2-D axisymmetric simulations may not be sufficient to resolve the asymmetric wake when ${Re}$ and ${We}$ are not small. It remains unclear to what extent (such as time duration and ranges of ${Re}$ and ${We}$) a 2-D axisymmetric simulation is valid in resolving drop aerobreakups. In the present study, we have performed both 2-D and 3-D simulations using identical numerical methods and initial/boundary conditions. Therefore, the difference between the results characterize the effect of the artificial axisymmetric constraint in the 2-D simulations on the drop.

The temporal evolutions of $\hat {L}$ and $\hat {R}$ for both 2-D and 3-D simulations are shown in figure 5. The 2-D simulation results for two different mesh resolutions, $N=512$ and $N=1024$, agree remarkably well, indicating that the 2-D results presented here are mesh-independent. The discrepancy between the 2-D and 3-D results is not related to the mesh resolution. The 2-D and 3-D results match very well for $\hat {t}\lesssim 0.5$, but the deviation grows over time. In general, the 3-D results agree much better with the experimental data. The 2-D simulation significantly underestimates the drop length compared to the 3-D simulation and experimental results, as shown in figure 5(a). This indicates that the 2-D simulations fail to capture the bag development. Significant discrepancies can also be observed in the drop velocity and drag coefficient, as shown in figures 5(c) and 5(d). For $1\lesssim \hat {t} \lesssim 1.6$, the value of $C_D$ predicted by the 2-D simulation is only approximately half of that obtained from the 3-D simulation.

Figure 5. Comparison between 2-D-axisymmetric and 3-D simulation results for $We=15.3$, including (a) drop length $\hat {L}$, (b) drop radius $\hat {R}$, (c) drop velocity $u_d$, and (d) drag coefficient $C_D$. The experimental results by Opfer et al. (Reference Opfer, Roisman, Venzmer, Klostermann and Tropea2014), Flock et al. (Reference Flock, Guildenbecher, Chen, Sojka and Bauer2012) and Jackiw & Ashgriz (Reference Jackiw and Ashgriz2021) are shown in (a,b) for comparison.

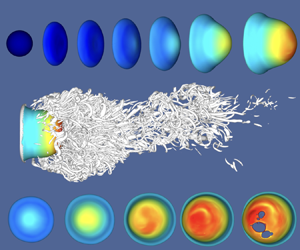
The poor prediction of the 2-D simulation is due to the fact that it cannot resolve the turbulent wake accurately. The pressure fields obtained from both 2-D and 3-D simulations are shown in figures 6(a) and 6(b), respectively. The vortical structures at different times for the 3-D simulation, visualized by the $\lambda _2$ criterion, are shown in figure 6(c) to illustrate the development of the wake. The wake is initially approximately axisymmetric and later transitions to being fully 3-D and turbulent. The artificial axisymmetric constraint in the 2-D simulation limits the azimuthal development of the wake, leading to high pressure near the leeward pole and a low-pressure region in the symmetric vortex ring, as seen in figure 6(a) at $\hat {t}=0.78$. In contrast, the gas pressure near the leeward pole is lower and more uniform in the turbulent wake for the 3-D results. The different pressure distributions result in different drags on the drop. The high pressure on the leeward pole in the 2-D simulation also hinders the development of the bag, which is the reason for the discrepancy for $\hat {L}$ observed in figure 5(a). Actually, the 2-D simulation fails to capture the correct shape of the bag, as seen at $\hat {t}=1.76$ in figures 6(a) and 6(b). While the 3-D simulation shows a bag curved forward shape, the 2-D bag bends upstream near the centre, showing a ‘bag-stem’ shape. The maximum bag curvature and minimum sheet thickness in the 2-D bag are near the 45-degree corner, where the rupture of the bag and the hole will appear first. This is not consistent with the experiment and 3-D simulation results, and is purely a numerical artefact.

Figure 6. Time evolutions of the pressure field on the $x$$y$ plane using (a) 2-D-axisymmetric and (b) 3-D simulations. (c) Vortical structures using 3-D simulations. The results are for the case ${We}=15.3$. The colour on the drop surface in (c) represents the velocity magnitude. See movies in the supplementary materials available at https://doi.org/10.1017/jfm.2023.708.

In summary, for drops with high ${Re}$, the 2-D simulation can capture only the early-time drop dynamics and deformation ($\hat {t}\lesssim 0.7$), when the wake remains approximately axisymmetric. Even though the drop shape for ${We}=15.3$ remains approximately axisymmetric for a longer time, it will not be captured correctly by the 2-D axisymmetric simulation. A full 3-D simulation, though expensive, is necessary to resolve the drop aerobreakup.

5. Different phases in drop morphological evolution

The shape deformation of a drop is a complex process consisting of multiple phases with distinct features and dominant physics. We will use the case ${We}=12.0$ to illustrate the different deformation phases, as shown in figure 7. In figures 7(a) and 7(b), we have presented the temporal evolution of pressure $\hat {p}$ and $y$-velocity $\hat {u}_y$ inside the drop on the central $x$$y$ plane. The corresponding drop surfaces, coloured with the velocity magnitude, are shown in figure 7(c). The drop radius $\hat {R}$ has been used commonly in previous studies to describe drop deformation, and it increases monotonically over time. However, its rate of change ${\rm d}\hat {R}/{\rm d}\hat {t}$ exhibits a non-monotonic variation over time, as shown in figure 7(d), from which different phases can be identified.

  1. (i) Phase I, ellipsoid deformation: ${\rm d}\hat {R}/{\rm d}\hat {t}$ increases over time with a decreasing rate and gradually approaches a plateau. The deformation is driven by the stagnation pressure on the windward surface. The drop shape is similar to an ellipsoid, and the thickness in the streamwise direction decreases over time.

  2. (ii) Phase II, disk formation: ${\rm d}\hat {R}/{\rm d}\hat {t}$ rises quickly again as the drop extends laterally, forming a circular disk.

  3. (iii) Phase III, disk deformation: ${\rm d}\hat {R}/{\rm d}\hat {t}$ decreases over time. The deceleration of the drop edge and equator is due to surface tension at the drop periphery.

  4. (iv) Phase IV, bag development: ${\rm d}\hat {R}/{\rm d}\hat {t}$ is approximately constant, indicating that forces reach equilibrium at the edge rim. The sheet thickness near the centre continues to decrease, and the thin region of the bag starts to curve toward downstream, forming a forward bag.

  5. (v) Phase V, bag inflation: ${\rm d}\hat {R}/{\rm d}\hat {t}$ increases rapidly due to the inflation of the forward bag.

Figure 7. Temporal evolutions of (a) pressure $p$ and (b) $y$-velocity in the drop on the central $x$$y$ plane. (c) Drop surface coloured with velocity magnitude. (d) Drop lateral radius $\hat {R}$ and its rate of change ${\rm d}\hat {R}/{\rm d}\hat {t}$ for ${We}=12.0$. Different phases of deformation are defined and indicated.

After the above phases, there is an additional phase, phase VI, for the bag rupture, which is not shown in figure 7. These phases have not been addressed systematically in previous studies, probably because little attention has been paid to the evolution of ${\rm d}\hat {R}/{\rm d}\hat {t}$. The key features of drop deformation in each phase and the effect of ${We}$ will be discussed in subsequent subsections.

5.1. Phase I: ellipsoid deformation

In phase I, the windward surface remains convex, so $L_{fb}=0$. Stagnation flows are formed near the windward and leeward poles (see points W and L in figure 7a). On the windward surface, the gas pressure is high near the stagnation point and decreases along the surface in the lateral direction. If the viscous effect is ignored, then the gas pressure near the stagnation point is given as

(5.1)\begin{equation} p_g(r) = p_g(0)-\rho_g{\frac{a^2U^2}{8d_0^2}}\,r^2, \end{equation}

where $r$ is the radial coordinate from the $x$-axis. The stretching rate of the stagnation flow, $a$, varies with the shape of the windward surface geometry, e.g. $a=6$ for a spherical surface, and $a={\rm \pi} /4$ for a flat disk (Villermaux & Bossa Reference Villermaux and Bossa2009). The liquid pressure inside the drop can be estimated as the sum of the gas pressure and the Laplace pressure,

(5.2)\begin{equation} p_l(r)=p_g(r)+\sigma\kappa, \end{equation}

which exhibits a variation in $r$ similar to that for $p_g$. The gradient of $p_l$ drives the extension of the drop in the radial direction, as shown in figure 7(b) at $\hat {t}=0.14$. If the liquid flow is modelled as one-dimensional and inviscid (due to the low ${Oh}$ for the present cases), then the momentum equation can be expressed as

(5.3)\begin{equation} \rho_l \left(\frac{\partial u_r}{\partial t} +u_r\,\frac{\partial u_r}{\partial r}\right)={-}\frac{\partial{p_l}}{\partial{r}}, \end{equation}

which can be integrated from $r=0$ to $R$ to yield

(5.4)\begin{equation} R\,\frac{{\rm d}^2 R}{{\rm d}t^2} = \frac{2(p_l(0)-p_l(R))}{\rho_l}. \end{equation}

Combining (5.2), an evolution equation for $\hat {R}$ can be obtained (Villermaux & Bossa Reference Villermaux and Bossa2009; Kulkarni & Sojka Reference Kulkarni and Sojka2014; Jackiw & Ashgriz Reference Jackiw and Ashgriz2021):

(5.5)\begin{equation} \frac{{\rm d}^2 \hat{R}}{{\rm d}\hat{t}^2}\,\frac{1}{\hat{R}}=\left(\frac{a}{2}\right)^2\left[1-{\frac{8}{a^2{We}} \frac{(\hat{\kappa}_E-\hat{\kappa}_W)}{\hat{R}^2}}\right], \end{equation}

where $\hat {\kappa }_W$ and $\hat {\kappa }_E$ are the curvatures at the windward pole ($r=0$, point W) and the lateral edge ($r=\hat {R}$, point E).

5.1.1. Asymptotic early-time dynamics

At $t=0$, $\hat {\kappa }_W=\hat {\kappa }_E=1/\hat {R}0$, so (5.5) reduces to

(5.6)\begin{equation} \left(\frac{{\rm d}^2 \hat{R}}{{\rm d}\hat{t}^2}\right)_{t=0}=\frac{a^2}{8}, \end{equation}

indicating that the drop deformation in the asymptotic limit is independent of ${We}$ and is determined purely by $a$. This universal early-time behaviour is consistent with the time scale analysis above (i.e. $\tau _{vl} \gg \tau _s > \tau _d$) and is also confirmed by the simulation results; see figure 8. It is observed that ${\rm d}\hat {R}/{\rm d}\hat {t}$ for all cases collapses very well at early times ($\hat {t}\lesssim 0.15$) for the range of ${We}$ considered ($10.9\le We\le 18$).

Figure 8. Early-time evolution of (a) rate of change of drop radius ${\rm d}\hat {R}/{\rm d}\hat {t}$ and (b) drop velocity $\hat {u}_d$, for different ${We}$. The inviscid compressible flow simulation results for shock–droplet interaction by Meng & Colonius (Reference Meng and Colonius2018) are shown in (b) for comparison.

Similarly, the results for the drop velocity $u_d$ also collapse in the early time ($\hat {t}\lesssim 0.3$); see figure 8(b). The initial jump of $u_d$ at $t=0^+$ is observed, which is due to the impulsive gas acceleration and the resulting inviscid-unsteady forces. Therefore, the velocity jump is also independent of ${We}$ and ${Re}$. The velocity jump $\hat {u}(t=0^+)\approx 0.002$ agrees well with the prediction given by (3.8). The results from the inviscid compressible flow simulation of Meng & Colonius (Reference Meng and Colonius2018) are also shown for comparison. In their simulations, the stationary water drop is hit by a planar air shock of Mach number $M_s=1.47$. Due to the compressibility effect, the drop velocity ‘jump’ occurs in a finite period of time ($\hat {t}\lesssim 0.04$). Nevertheless, the subsequent evolution of $u_d$ agrees well with the present simulations, assuming incompressible flows. The good agreement affirms that the early-time drop dynamics for the ranges of ${We}$ and ${Oh}$ considered is independent of viscous and surface tension effects.

5.1.2. Effect of ${We}$

The inviscid results of Meng & Colonius (Reference Meng and Colonius2018) deviate from the present cases at later times $\hat {t}\gtrsim 0.3$ due to the effect of surface tension. Additional 3-D simulations were performed for higher ${We}$, and it is shown that the present simulation results for ${We}=42$ and 72 agree well with the results of the inviscid simulation results for the whole time range shown. This indicates that the compressibility effect on drop breakup induced by weak shocks on the drop velocity is secondary, and the incompressible flow simulations can yield a reasonable estimate for shock-induced drop aerobreakup.

Deviations among different cases for ${\rm d}\hat {R}/{\rm d}\hat {t}$ arise after approximately $\hat {t}=0.2$, as shown in figure 8(a). It can be observed that ${\rm d}\hat {R}/{\rm d}\hat {t}$ for different ${We}$ eventually reaches different plateau values. As the curvatures of the windward surface decrease, the stagnation flow is modified, and the pressure gradient that drives the lateral expansion is reduced. Simultaneously, the curvature at the lateral edge increases, and as a result, the retraction force due to surface tension increases. The balance between the surface tension and stagnation pressure brings ${\rm d}\hat {R}/{\rm d}\hat {t}$ to a constant. For cases with larger ${We}$, the retraction force from the lateral edge is smaller, thus it takes slightly longer for ${\rm d}\hat {R}/{\rm d}\hat {t}$ to reach the plateau, and the plateau values of ${\rm d}\hat {R}/{\rm d}\hat {t}$ are also higher.

The above discussions focus mainly on the windward surface. Due to flow separation, the pressure field on the leeward side is different from the windward counterpart, as shown in figure 7(a). Generally, the pressure at the leeward pole is lower. Nevertheless, the pressure decreases radially even faster due to the vortex ring formed behind the separation point. As a result, the leeward surface curvature decreases faster and turns from convex to concave earlier ($\hat {t}=0.28$) than the windward counterpart.

5.1.3. Modelling early-time evolution of drop radius $R$

The evolution of the drop radius $R$ is dictated mainly by windward surface deformation. The shape of the drop can be approximated as ellipsoidal. Then $\kappa _W$ and $\kappa _E$ can be expressed in terms of $R$ as $\kappa _W = h_a/R^2$ and $\kappa _E=4R/h_a^2 + 1/R$, where $h_a=d_0^3/4R^2$ is the thickness of the drop for an ellipsoid. By substituting the estimates of curvatures into (5.5), we obtain

(5.7)\begin{equation} \frac{{\rm d}^2 \hat{R}}{{\rm d}\hat{t}^2}\,\frac{1}{\hat{R}}=\left(\frac{a}{2}\right)^2\left[1-{\frac{64}{a^2{We}}}\left( 8 \hat{R}^3 +\frac{1}{8 \hat{R}^3} -\frac{1}{32 \hat{R}^6} \right) \right] . \end{equation}

Similar models have been developed by Villermaux & Bossa (Reference Villermaux and Bossa2009) (VB) and were then extended by Kulkarni & Sojka (Reference Kulkarni and Sojka2014) (KS) and Jackiw & Ashgriz (Reference Jackiw and Ashgriz2021) (JA). The difference between the present model (5.7) and the previous ones lies in the different estimates of $\kappa _W$ and $\kappa _E$. In the VB and KS models, the drop is assumed to be a cylindrical disk with a rounded edge, so the windward surface is flat ($\kappa _W=0$), and only the principal curvature on the $x$$y$ plane is considered for the edge, namely $\kappa _E=2/h_a$, where $h_a=d_0^3/6R^2$ for a cylinder. As a result, (5.5) becomes

(5.8)\begin{equation} \left(\frac{{\rm d}^2 \hat{R}}{{\rm d}\hat{t}^2}\,\frac{1}{\hat{R}}\right)_{KS}=\left(\frac{a}{2}\right)^2\left[1-{\frac{96}{a^2\,{We}}} \right]. \end{equation}

Note that this expression holds for both the VB and KS models; the difference between the two lies in the different values of $a$. In the JA model, the drop was first considered as a disk, so $\kappa _W=0$ and $\kappa _E=2/h_a+1/R$, with the second principal curvature added compared to the KS model. Nevertheless, when relating $h_a$ to $R$, they have used the relation for an ellipsoid, so $h_a=d_0^3/4R^2$. Eventually, they obtained

(5.9)\begin{equation} \left(\frac{{\rm d}^2 \hat{R}}{{\rm d}\hat{t}^2}\,\frac{1}{\hat{R}}\right)_{JA}=\left(\frac{a}{2}\right)^2\left[1-{\frac{64}{a^2\,{We}}} \left( 1+ \frac{1}{8\hat{R}^3}\right) \right]. \end{equation}

Based on experimental observations, they argued that for a short time $\hat {t}<\hat {t}_{bal}=1/8$, the drop radius $R$ remains unchanged, and then $R$ increases linearly. Therefore, (5.9) can be simplified further as

(5.10)\begin{equation} \left(\frac{{\rm d}\hat{R}}{{\rm d}\hat{t}}\right)_{JA2}= \begin{cases} 0{,} & \text{if } \hat{t}\le \hat{t}_{bal}, \\[6pt] \left(\dfrac{a}{2}\right)^2\left[1-\dfrac{128}{a^2\,{We}} \right] \dfrac{\hat{t}_{bal}}{2}, & \text{if } \hat{t}> \hat{t}_{bal}, \end{cases} \end{equation}

which is referred to as the JA2 model here, to distinguish it from (5.9). In the present model, we have used the geometric features of an ellipsoid to estimate $\kappa _W$, $\kappa _E$, and the relation between $h_a$ and $R$ consistently. This treatment leads to an important feature, the $We$-independent asymptotic limit at $t=0$ (see (5.6)), being captured correctly. It can be shown easily that none of the above models guarantees this feature.

To close the above models, the stretching rate of the stagnation flow, $a$, remains to be determined. In the VB model, $a$ is taken to be 4, which is an arbitrary intermediate chosen between the two limits $a=6$ and ${\rm \pi} /4$ for sphere and cylinder. Both VB and KS proposed that the condition ${\rm d}^2R/{\rm d}t^2 =0$ can be used to determine the critical Weber number ${We}_{cr}$; i.e. when ${We}<{We}_{cr}$, ${\rm d}^2R/{\rm d}t^2<0$, then $R$ will not increase over time and the drop will be stable. The value $a=4$ used by VB will lead to ${We}_{cr}=6$, which does not agree with experimental observations for drop aerobreakup. That is why KS proposed $a=2\sqrt {2}$, so that according to their model (5.8), ${\rm d}^2R/{\rm d}t^2 =0$ will yield ${We}_{cr}=12$, which agrees with the experimental observations. Nevertheless, this way to estimate $a$ is problematic since both experimental and simulation results show that ${\rm d}^2R/{\rm d}t^2>0$ is not a necessary condition for the drop to be unstable. A good counterexample is the case ${We}=10.9$, for which ${\rm d}^2R/{\rm d}t^2>0$ at an early time. However, the drop is eventually stable. Generally, the KS model significantly underpredicts the temporal growth of $R$ at an early time; see figures 9(b) and 9(d). In particular, for the case ${We}=12.0$, the KS model will yield ${\rm d}^2R/{\rm d}t^2=0$, and as a result, $R$ would not grow in time (see figures 9a,c), which is obviously incorrect.

Figure 9. Comparison between the present simulation and model results for ${\rm d}\hat {R}/{\rm d}\hat {t}$ and $\hat {R}$ and predictions of other models for (a,c) ${We}=12.0$ and (b,d) ${We}=15.3$. The results for other models are shown as well: VB, KS, TAB, Rimbert represent the models of Villermaux & Bossa (Reference Villermaux and Bossa2009), Kulkarni & Sojka (Reference Kulkarni and Sojka2014), O'Rourke & Amsden (Reference O'Rourke and Amsden1987) and Rimbert et al. (Reference Rimbert, Escobar, Meignen, Hadj-Achour and Gradeck2020); JA and JA2 represent the two models of Jackiw & Ashgriz (Reference Jackiw and Ashgriz2021) ((5.9) and (5.10)). The results for the model of Rimbert et al. (Reference Rimbert, Escobar, Meignen, Hadj-Achour and Gradeck2020) are based on the corrected parameter $K_C$. Refer to the text for more details.

In the JA model, the value of $a$ for a sphere was used, i.e. $a=6$. In contrast to the KS model, the JA model significantly overpredicts the evolution of $\hat {R}$ and ${\rm d}\hat {R}/{\rm d}\hat {t}$. Among the VB, KS and JA models, the VB model actually matches the best with the present simulation results for the initial development of $\hat {R}$ and ${\rm d}\hat {R}/{\rm d}\hat {t}$ for $\hat {t}\lesssim 0.25$. Nevertheless, a common issue of all these models is that they fail to capture the trend that ${\rm d}\hat {R}/{\rm d}\hat {t}$ gradually reaches a plateau at $\hat {t}\approx 0.3$. The constant ${\rm d}\hat {R}/{\rm d}\hat {t}$ was observed in the experiments of JA, which motivated them to add this assumption in the original JA model, leading to the simplified JA2 model that approximates ${\rm d}\hat {R}/{\rm d}\hat {t}$ as a piecewise constant function of time; see (5.10). This simplification reduces the discrepancy between the model predictions and the simulation results. However, as shown in figures 9(a,b), the evolution of ${\rm d}\hat {R}/{\rm d}\hat {t}$ in reality does not change abruptly.

In a recent study by Rimbert et al. (Reference Rimbert, Escobar, Meignen, Hadj-Achour and Gradeck2020), the potential flow solution around a spheroid was used to estimate the gas pressure on the drop surface. Therefore, their model does not require ad hoc models for the stagnation flow features, such as the stretching rate of the stagnation flow, $a$, and the time-varying pressure work on the drop is expressed as a function of $\hat {R}$. The drop deformation in time is determined through an energy approach, namely the time derivative of the sum of kinetic and surface energy is equal to the pressure and viscous works. In the original paper, the authors seem to have missed a factor $1/2$ in the kinetic energy parameter $K_C$. The predictions of the model by Rimbert et al. (Reference Rimbert, Escobar, Meignen, Hadj-Achour and Gradeck2020) with the corrected $K_C$ are shown in figure 9. It can be observed that the model agrees remarkably well with the present simulation results at early times, though it generally overpredicts the evolutions of ${\rm d}\hat {R}/{\rm d}\hat {t}$ and $\hat {R}$ at later times when the drop deviates from the spheroidal shape.

By introducing a small perturbation at the initial spherical state, $\hat {\epsilon }=2\hat {R}-1$, the model of Rimbert et al. (Reference Rimbert, Escobar, Meignen, Hadj-Achour and Gradeck2020) (with corrected $K_C$) can be simplified to a linear form, i.e.

(5.11)\begin{equation} \frac{{\rm d}^2 \hat{\epsilon}}{{\rm d}\hat{t}^2}+40{\frac{Oh}{\sqrt{We}}}\,\frac{{\rm d} \hat{\epsilon}}{{\rm d} \hat{t}} + \left(\frac{64}{We} -\frac{684}{35} \right)\hat{\epsilon} = 3. \end{equation}

The constant $3$ on the right-hand side is determined by the pressure work of the gas flow, estimated from the potential flow solution, and the kinetic energy within the liquid drop. At time zero, $\hat {\epsilon }={\rm d}\hat {\epsilon }/{\rm d}\hat {t}=0$, so we have

(5.12)\begin{equation} \left(\frac{{\rm d}^2 \hat{\epsilon}}{{\rm d}\hat{t}^2}\right)_{t=0} = 3, \quad \mathrm{or}\quad \left(\frac{{\rm d}^2 \hat{R}}{{\rm d}\hat{t}^2}\right)_{t=0} =\frac{3}{2}, \end{equation}

which yields an analytical solution for the initial slope of ${\rm d}\hat {R}/{\rm d}\hat {t}$, i.e. $({{\rm d}\hat {R}}/{{\rm d}\hat {t}})_{t=0}=3/2$. Consistent with (5.6), the model of Rimbert et al. (Reference Rimbert, Escobar, Meignen, Hadj-Achour and Gradeck2020) also indicates that the initial slope of ${\rm d}\hat {R}/{\rm d}\hat {t}$ is independent of ${We}$ and ${Oh}$.

To predict the evolution of $\hat {R}$ in phase I, a simple model is proposed here by incorporating a time varying $a$. First, by combining (5.6) and (5.12), one can determine the initial value of $a$, i.e. $a_0=a(t=0)=\sqrt {({\rm d}^2R/{\rm d}t^2)_{t=0}}= \sqrt {12}$. The value is lower than 6 even though the initial drop shape is spherical, and the difference is related to the simplified pressure distribution on the drop surface, i.e. (5.1). As the drop deforms and the windward surface curvature decreases, $a$ decreases over time and eventually reaches $a_1$. The time variation of $a$ is modelled simply by an error function as

(5.13)\begin{equation} a = a_0 - (a_0-a_1)\,\mathrm{erf} (\hat{t}/\hat{\tau}_a), \end{equation}

where $a_1=2.5$ is the asymptotic value of $a$ at the end of phase I, and $\tau _a=0.35$ is the transition time, found based on the simulation results. Though the present model ((5.7) and (5.13)) requires simulation results to calibrate the model parameters, (5.13) is independent of ${We}$ and thus can be used to predict the evolution of $R$ in phase I for other values of ${We}$ that are not simulated here. It is also worth noting that previous models (except JA2) predict continuous growth of ${\rm d}\hat {R}/{\rm d}\hat {t}$, which is inconsistent with the present simulation results and experimental data of Jackiw & Ashgriz (Reference Jackiw and Ashgriz2021). By using a decaying $a$, the present model agrees very well with the simulation results; see figures 9(a) and 9(b).

Finally, as the TAB model (O'Rourke & Amsden Reference O'Rourke and Amsden1987) is used widely in the literature, its results are also shown in figure 9 for comparison. It can be observed that the TAB model underpredicts the initial growths of ${\rm d}\hat {R}/{\rm d}\hat {t}$ and $\hat {R}$.

5.2. Phase II: disk formation

A distinct feature of phase II is that ${\rm d}\hat {R}/{\rm d}\hat {t}$ increases again after it reaches the plateau at the end of phase I, as shown in figure 7(d). As shown in figure 7(a), as the pressure at point E increases, the growth of ${\rm d}\hat {R}/{\rm d}\hat {t}$ slows down at the end of phase I. In phase II, the liquid turns to flow towards a new low-pressure location, the point N marked in the figure. The low pressure is related to small curvature at point N on the $x$$y$ plane, which is in turn related to the deformation of the leeward surface in phase I. It can be observed that the $y$-velocity at point N increases faster than that at point E, as shown for $\hat {t}=0.42$ to 0.68 in figure 7(b). As a result, the lateral extension velocity of the drop increases again. At approximately $\hat {t}=0.56$, the point N passes the point R, becoming the new location determining $R$. As the drop deforms, the curvature at point N increases, and the drop gradually deforms from an approximate ellipse to a disk with rounded edge. At the end of phase II, the Laplace pressure at the new periphery N becomes comparable to the stagnation pressure near the windward pole. Then ${\rm d}^2\hat {R}/{\rm d}\hat {t}^2=0$, and ${\rm d}\hat {R}/{\rm d}\hat {t}$ reaches a local maximum.

It is worth mentioning that the model given in (5.5) can also be used to predict the drop deformation in this phase, with certain adaptation. The additional complexity is to estimate the time variation of the principal curvature $\kappa _N$ on the $x$$y$ plane since the shape of the drop is neither an ellipse nor a disk in the transition. In this study, we focus on discussions of the flow physics and will leave the model development for future work.

The appearance of a local maximum in ${\rm d}\hat {R}/{\rm d}\hat {t}$ is a distinctive feature of the bag breakup regime. As ${We}$ increases and the drop breakup mode transitions to the multi-mode regime, ${\rm d}\hat {R}/{\rm d}\hat {t}$ will increase monotonically. Here, we denote the time corresponding to ${\rm d}^2\hat {R}/{\rm d}\hat {t}^2=0$ in phase II as $\hat {t}^*$. The zero acceleration of $\hat {R}$ indicates a force balance at the drop periphery. When ${We}$ is too large, the surface tension will not be sufficient to establish such a balance. Marcotte & Zaleski (Reference Marcotte and Zaleski2019) suggested that the force balance at the drop periphery is achieved when the rim is formed, which is consistent with the present results. They also suggested that rim formation is a critical feature in determining whether the drop will break in the bag modes (Rayleigh–Taylor piercing mode) or in the shear modes (shear-induced entrainment mode). Nevertheless, the present results show that rim formation will not be achieved even in the multi-mode regime, and that ${We}$ does not need to reach high values in the shear breakup regime to prevent rim formation.

The Laplace pressure at the drop periphery at $\hat {t}^*$ can be estimated by assuming that the drop exhibits the shape of a disk:

(5.14)\begin{equation} \hat{p}_{La}^* = \frac{\sigma \kappa_N}{\rho_g U_0^2} = \frac{1}{We} \left(12{\hat{R}{^*}}^2 +{\frac{1}{\hat{R}{^*}}}\right), \end{equation}

where $\hat {R}^*$ is the dimensionless drop radius for $\hat {t}=\hat {t}^*$. The values of $\hat {p}_{La}^*$ for different ${We}$ are shown in figure 10. Marcotte & Zaleski (Reference Marcotte and Zaleski2019) suggested that the Laplace pressure when the rim is formed is in equilibrium with the liquid fluid inertia:

(5.15)\begin{equation} \hat{p}_{MZ}^* = \frac{\rho_l ({\rm d}R/{\rm d}t)^2}{\rho_g U_0^2} = \left(\frac{{\rm d} \hat{R}}{{\rm d} \hat{t}}\right)^2. \end{equation}

They further proposed to approximate ${\rm d}R/{\rm d}t$ by the Dimotakis speed, namely $U_0\sqrt {r}$. However, it can be observed in figure 8(a) that $U_0\sqrt {r}$ significantly overpredicts ${\rm d}\hat {R}/{\rm d}\hat {t}$ at $\hat {t}^*$. By using the corrected $({\rm d}\hat {R}/{\rm d}\hat {t})$ obtained from simulations, it can be observed from figure 10 that the liquid inertia is significantly lower than $\hat {p}_{La}^*$, thus it is unlikely to be the force that balances the Laplace pressure when the rim is formed.

Figure 10. (a) Comparison of Laplace pressure (5.14) with liquid inertia (5.15) and gas pressure differences estimated by the VB (5.16) and present (5.17) models as a function of ${We}$ when the rim is formed. (b) Comparison of the drop lateral radius when the rim is formed, $\hat {R}^*$, measured from the present simulation and the model prediction (5.18).

According to the one-dimensional inviscid model (5.4), when ${\rm d}^2\hat {R}/{\rm d}\hat {t}^2=0$, the liquid pressure at the disk centre and the rim should be in equilibrium, $p_l(0)= p_l(R)$. Since the curvature at the windward pole is approximately zero at this time, $p_l(0)\approx p_g(0)$; see also figure 7(a) at $\hat {t}=0.68$. The liquid pressure at the periphery is $p_l(R)=p_g(R)+p_{La}$. As a result, the Laplace pressure at the rim is actually balanced by the gas pressure difference $\hat {p}_{g,dif}=p_g(0)-p_g(R)$. Villermaux & Bossa (Reference Villermaux and Bossa2009) have proposed estimating $p_g(R)$ using the stagnation pressure on the windward surface, namely (5.1):

(5.16)\begin{equation} \left(\hat{p}_{g,dif}^*\right)_{VB}= \frac{p_g(0)-p_g(R)}{\rho_g U_0^2} = \frac{a^2\hat{R}^2}{8}, \end{equation}

where $a={\rm \pi} /4$ for a disk. However, the computed pressure field (see figure 7a) indicates that the gas pressure above the periphery of the drop, $p_g(R)$, is dictated only by stagnation flow at the windward surface when the drop exhibits an ellipsoidal shape in phase I. When the drop becomes a disk in phases II and III, the gas flows over the drop periphery without much influence from the windward surface, and as a result, $p_g(R) \approx 0$. Therefore, we estimate the gas pressure difference between the disk centre and periphery as

(5.17)\begin{equation} \hat{p}_{g,dif}^*= \frac{p_g(0)}{\rho_g U_0^2} = \frac{1}{2}. \end{equation}

The results of $(\hat {p}_{g,dif}^*)_{VB}$ and $\hat {p}_{g,dif}^*$ are shown in figure 10, and it can be observed that the present estimate $\hat {p}_{g,dif}^*$ agrees better with $\hat {p}_{La}^*$, affirming that the rim formation and the maximal radial expansion velocity before inflation are established when the gas stagnation pressure at the windward pole is in equilibrium with the Laplace pressure at the periphery rim. Furthermore, the pressure balance $\hat {p}_{La}^*=\hat {p}_{g,dif}^*$ yields

(5.18)\begin{equation} \frac{1}{We} \left(12{\hat{R}{^*}}^2 +{\frac{1}{\hat{R}{^*}}}\right)= \frac{1}{2}, \end{equation}

which can be used to predict $\hat {R}^*$ as a function of ${We}$ for the bag breakup regime. Figure 10(b) shows the comparison between the simulation results for $\hat {R}^*$ and the prediction from the model. It can be observed that the increasing trend of $\hat {R}^*$ with ${We}$ is captured. The agreement between the model predictions and the simulation measurements is generally good for ${We}=10.9$ to 15. However, the discrepancy is much larger for ${We}=18$, since this case is in the transition to the multi-mode regime.

5.3. Phase III disk deformation

After ${\rm d}\hat {R}/{\rm d}\hat {t}$ reaches a local maximum at the end of phase II, it starts to decrease over time in phase III, when the disk deforms; see figure 7(d). The RTI contributes to the subsequent deformation of the windward and leeward surfaces of the disk. As the drop accelerates towards the right, the baroclinic torque induced by the misalignment between the pressure and density gradients destabilizes the windward surface of the disk and stabilizes the leeward counterpart; see $\hat {t}=0.92$ in figure 7. The deformation of the two surfaces squeezes the liquid to move from the disk centre towards the edge rim (see the distribution of $\hat {u}_y$ in figure 7b), resulting in a rapid decrease of disk thickness at the centre $h_a$ and an increase in $\hat {R}$.

There are two mechanisms induced by surface tension that hinder the disk deformation, resulting in the deceleration of the disk edge in the radial direction (${\rm d}^2\hat {R}/{\rm d}\hat {t}^2<0$). The first mechanism is the surface tension corresponding to the deformation of the windward surface and the resulting curvature on the $x$$y$ plane. This surface force is accounted for in the stability analysis of RTI on a flat surface or a planar liquid layer with surface tension (Mikaelian Reference Mikaelian1990, Reference Mikaelian1996), which is used to predict the most unstable wavelengths on the windward surface (Joseph et al. Reference Joseph, Belanger and Beavers1999; Theofanous et al. Reference Theofanous, Li and Dinh2004). The second mechanism is the surface force from the rounded edge of the disk. As the radius of curvature is smaller at the lateral edge, a higher pressure develops at the edge, and the resulting pressure gradient resists the disk's lateral expansion, as shown in figure 7 at $\hat {t}=1.11$. Similar to phases I and II, the second mechanism is the dominant one, and the competition between this mechanism and the Rayleigh–Taylor baroclinic torque seems to determine the drop deformation in this phase.

Though the effect of ${We}$ can be seen already from ${\rm d}\hat {R}/{\rm d}\hat {t}$ at the end of phase II, the differences in the drop shapes do not become obvious until phase III; see the temporal evolutions of the characteristic length scales in figure 11. Phase III is characterized by the decrease of ${\rm d}\hat {R}/{\rm d}\hat {t}$ in time, and it is observed that phase III starts at approximately $\hat {t}= 0.7$ and ends at approximately $\hat {t}=1.2$ for all cases except ${We}=10.9$.

Figure 11. Time evolutions of (a) the drop radius $\hat {R}$, (b) the drop length $\hat {L}$, (c) the rate of change of $\hat {R}$, (d) the bag length $L_{fb}$, and (e) the bag sheet thickness along the $x$-axis, for different ${We}$.

The evolutions of $\hat {L}_{fb}$ and $\hat {h}_a$ in phase III also showed distinct behaviours; see figure 11. When the drop windward/leeward surfaces become concave, it is hard to measure these two parameters in experiment, but it is easy in the simulation. Due to the definition of $\hat {L}_{fb}$, it remains zero until the windward surface becomes concave in phase III. Though the RTI contributes to the deformation of the windward surface, the growth of $\hat {L}_{fb}$ in the linear regime (when $\hat {L}_{fb}$ is small) is linear instead of exponential. While an exponential growth is expected for the linear RTI on an infinitely flat layer of finite thickness, a possible reason for not observing it here is the surface tension effect at the edge of the disk. The rapid growth of $\hat {L}_{fb}$ for ${We}=15.3$ and 18.0 at later times may appear to be exponential, but it is due to the bag inflation, which will be discussed later, and is not related to the linear stability development. It can be seen that $\hat {h}_a$ decreases monotonically in time, but the rate of decrease in phase III is higher than that in phase II. In addition, kinks are observed in the evolutions of $h_a$ for cases with ${We}\le 12$ at approximately $\hat {t}=1.1$, after which the rate of decrease is significantly reduced. For the case ${We}=10.9$, the slow decrease of $\hat {h}_a$ prevents it from reaching the threshold of approximately 0.2 (i.e. the disk thickness remains larger than 20 % of the original drop diameter). As will be shown later, the thick layer at the disk centre hinders the bag growth, and a topology change never happens for this case. It is noteworthy that even a slight increase in ${We}$ – for instance, from ${We}=11.5$ to 12.0 – can cause $\hat {h}_a$ to surpass the critical threshold, leading to the eventual piercing of the bag.

To better illustrate the flow inside the drop and its impact on the drop deformation, the time evolutions of $\hat {u}_y$ inside the drop for different ${We}$ are also shown in figure 12. It is confirmed that the velocity distributions within the drop for different ${We}$ are generally similar for phases I and II, and distinctions among different cases arise in phase III. Due to the approximate flow symmetry, $\hat {u}_y$ is close to zero near the centre of the disk ($y=0$) and is generally positive and negative in the top and bottom portions of the drop in phases I and II for all cases, indicating that the liquid flows outwards from the disk centre. The signs of $\hat {u}_y$ are generally similar in phase III, but the radial flow is not driven by the liquid pressure gradient inside the drop as in phases I and II, but by the RTI on the windward surface. As shown in figure 7(a) at $\hat {t}=1.11$, the pressure actually increases along the radial direction and drives an inward flow back towards the centre, as can be seen in the small regions of $\hat {u}_y<0$ near the right top corner of the disk for $\hat {t}=1.04$. For ${We}=10.9$ and 11.5, the inward flow gradually overcomes the outward counterpart, as the region for $\hat {u}_y<0$ in the upper half of the drop grows in time. Eventually, the lateral deformation of the disk changes from expansion to contraction. For ${We}\le 12$, the outward flow dominates, and the liquid continues to flow away from the centre, leading to a continuous decrease of $h_a$, as shown in figure 11.

Figure 12. Temporal evolution of the $y$-velocity ($u_y$) on the central $x$$y$ plane inside the drop for different ${We}$ values: (a) 10.9, (b) 11.5, (c) 12.0, (d) 15.3, and (e) 18.0. The points C and D marked in (d,e) indicate the concave locations on the perturbed windward surface due to drop deformation. Different deformation phases for ${We}=12.0$ are indicated in (c).

5.4. Phase IV: bag development

The evolution of ${\rm d}\hat {R}/{\rm d}\hat {t}$ shown in figure 7(d) also exhibits a phase for which ${\rm d}\hat {R}/{\rm d}\hat {t}$ is approximately constant, referred to as phase IV. In this phase, the thin centre of the disk starts to bend towards downstream, forming a forward bag. Here, we define a ‘forward bag’ as a curved liquid layer with the opening facing upstream. Based on this definition, a ‘bag’ is formed for all cases; see figure 12. The formation of the bag is due to the baroclinic torque on the unstable windward surface overcoming its counterpart on the stable leeward surface, which in turn is caused by the larger pressure difference on the windward surface. The deformation of the bag enhances liquid flow from the disk centre to the edge, balancing the forces at the edge rim of the disk such that ${\rm d}^2\hat {R}/{\rm d}\hat {t}^2=0$. Phase IV ends when the bag inflates and ${\rm d}\hat {R}/{\rm d}\hat {t}$ increases rapidly again.

5.4.1. Criteria for bag piercing

The evolutions of the characteristic lengths and internal flows for different ${We}$ are shown in figures 11 and 12. It can be seen that the constant ${\rm d}\hat {R}/{\rm d}\hat {t}$ is obvious only for ${We}\le 12$ and thus is a near-${We}_{cr}$ feature. For cases with higher ${We}$, the bags start to inflate right after they are formed. Among the three lower ${We}$ cases considered here, the bag for ${We}=10.9$ is stable, the edge of the bag retracts (${\rm d}\hat {R}/{\rm d}\hat {t}<0$), and the thickness of the bag turns to increase in time (${\rm d}\hat {h}_a/{\rm d}\hat {t}>0$). Topology change does not happen (vibration breakup may occur in a long time, but this is outside the scope of this study). In contrast, for ${We}=12.0$, the bag is unstable, $\hat {R}$ increases, and $\hat {h}_a$ decreases, and eventually the bag inflates and is pierced through by the gas flow. The results for ${We}=11.5$ show an interesting breakup mode that is less understood, i.e. both $\hat {R}$ and $\hat {h}_a$ decrease over time. As a result, the bag will rupture similar to the unstable case ${We}=12.0$, but the remaining rim retracts back to form a big drop like the stable case ${We}=10.9$. Since the drop for ${We}=11.5$ will not fragment into a large number of small drops, we consider the case ${We}=12.0$ to represent the dynamics of aerobreakup at critical conditions, thus ${We}_{cr}=12.0$, which is consistent with previous experiments for water drops. Nevertheless, the results for ${We}=11.5$ show that bag piercing does not guarantee a complete fragmentation of the bag. The range of ${We}$ for such behaviour is quite narrow for the density ratios and Reynolds numbers considered, and further investigation of this breakup mode will be relegated to future study.

The linear RTI model with surface tension and viscous effects for an accelerating infinite planar liquid sheet has been proposed to predict the critical condition, such as ${We}_{cr}$ (Joseph et al. Reference Joseph, Belanger and Beavers1999; Theofanous et al. Reference Theofanous, Li and Dinh2004, Reference Theofanous, Mitkin, Ng, Chang, Deng and Sushchikh2012), based on the linear stability analysis (Mikaelian Reference Mikaelian1990, Reference Mikaelian1996). It was suggested that when the most unstable wavelength is smaller than the disk diameter, a bag will be formed and eventually pierced through by the gas. Although such models, along with other assumptions, capture reasonably the variation of ${We}_{cr}$ over ${Oh}$, the hypotheses of the model are not fully consistent with the flow physics. First, the effect of surface tension at the disk edge was not considered in the model. This simplification is acceptable for perturbations of small wavelengths but not for those with wavelengths comparable to the disk radius $R$. Furthermore, the previous models predict disk/bag stability based on the linear dynamics of RTI. However, a perturbation that grows in the linear regime (when its amplitude $\hat {L}_{fb}$ is small) does not guarantee its continuous nonlinear growth at later times, and the case ${We}=10.9$ explained above is a good example of that.

For cases with ${We}\le 15.3$, the forward bag formed is approximately a symmetric spherical shell, and the tip of the bag is located near the central $x$-axis. Such bags are referred to as ‘simple’ bags here, and theoretical models have been proposed to predict their formation and development (Villermaux & Bossa Reference Villermaux and Bossa2009; Kulkarni & Sojka Reference Kulkarni and Sojka2014). It is considered that the acceleration of the bag tip, which is perpendicular to the free stream, is driven by the pressure difference $(\Delta p)_a$ across the liquid sheet:

(5.19)\begin{equation} \frac{{\rm d}^2 L_{fb}}{{\rm d}t^2} = \frac{(\Delta p)_a}{\rho_l h_a}. \end{equation}

In this simple model, surface tension and liquid viscosity are ignored. Extensions to incorporate these effects have been made by Kulkarni & Sojka (Reference Kulkarni and Sojka2014). Since the pressure is hard to measure in experiments, Villermaux & Bossa (Reference Villermaux and Bossa2009) approximates the pressure on the leeward side to be the free-stream pressure, and that on the windward side to be the stagnation pressure, so $(\Delta p)_a \approx p_g(r=0)$, as given in (5.1). For cases with different ${We}$, $(\Delta p)_a$ is similar, so the different evolution of $L_{fb}$ is due to mainly the different $h_a$. The rate of decrease of $h_a$ generally increases with ${We}$. As a result, $h_a$ for low ${We}$ can be significantly larger than that for high ${We}$; for example, at $\hat {t}=1.5$, $h_a=0.2$ and 0.03 for ${We}=10.5$ and 15.3, respectively, and the former is almost an order of magnitude larger than the latter. If $h_a$ is too large, then the tip acceleration is slow compared to the capillary retraction of the edge rim, and $h_a$ will stop decreasing, and the bag will not be pierced through. For the present cases, the evolutions of $h_a$ for ${We}=10.5$ and 11.0 bifurcate at $\hat {h}_a=0.1\unicode{x2013}0.2$, which seems to indicate that the $h_a$ threshold for bag piercing is approximately 0.2. The value may vary with other parameters that are kept constant in the study, and further investigations are still required to fully confirm this observation.

5.4.2. Transition from simple to ring bags

The bag formed for ${We}=18.0$ exhibits a more complex shape compared to other cases, as shown in figure 13. First, the bag loses the approximate symmetry observed for ${We}=15.3$. Furthermore, the minimum thickness of the disk is located not at the bag centre but rather at a ring around it, as seen in figure 12(e). As the tip accelerates faster at the location with smaller sheet thickness, the interfacial velocity at $\hat {t}=1.82$ shown in figure 13(b) results in the formation of a ‘ring’ bag with a dent at the centre. As the ring bag grows, the liquid is squeezed to move away from the tip in two directions. The outward flowing liquid will gather at the rim, and the inward counterpart will gather at the centre to form a small stem, as seen in figure 12(e). This drop morphology is also known as the ‘bag-stem’ mode. As the ring bag grows, transverse RTI may develop and introduce an azimuthal variation of the bag growth rate, leading to the ‘multi-bag’ mode. A detailed investigation of the bag-stem and multi-bag modes is outside the scope of this paper. However, the present results provide a good understanding of the transition from simple to ring bags and lay the foundation for future studies on the bag-stem and multi-bag modes.

Figure 13. Bag morphological evolutions for (a) ${We}=15.3$ (simple bag) and (b) 18.0 (ring bag). The colour represents the velocity magnitude, and the colour scale is the same as in figure 7.

A close look at the drop shapes at $\hat {t}=0.69$ in figure 12 reveals wavy perturbations formed on the windward surface of the disk. The surface is convex at the centre and concave about $\hat {R}/2$ away from the centre. The concave locations are marked as points C and D in figures 12(d) and 12(e). The perturbation wavelength is about $R$, and such a feature holds for all ${We}$, making it an outcome of the early-time deformation and independent of ${We}$. As the drop for ${We}=18.0$ continues to deform, C and D become the locations for the minimum disk thickness where the ring bag is formed. In comparison, for ${We}\le 15.3$, C and D merge at the centre, resulting in the minimum thickness being located at the centre. RTI models based on the linear stability of an infinite liquid layer (Theofanous et al. Reference Theofanous, Li and Dinh2004) have been used to predict the transition from simple to ring bags. It is argued that the transition will occur when the most unstable Rayleigh–Taylor (RT) wavelength $\lambda _{RT}$ satisfies $(2R)/\lambda _{RT}=3$. However, the simulation results presented here suggest a slightly different conclusion. When $\lambda _{RT}$ is smaller than $R$, the perturbation on the windward surface will grow and form the ring bag. When $\lambda _{RT}>R$, even if the location of minimum thickness is initially not at the centre of the bag, it will eventually move back to the centre because the mode with a larger wavelength grows faster.

5.5. Phase V: bag inflation

As the thickness of the bag reduces to a certain level, $\hat {h}_a\lesssim 0.02$, the development of the bag enters phase V, as shown in figure 7. For simple bags, the bag in this phase consists of two regions, the rim and the bag sheet, as seen at $\hat {t}=2.37$ in figure 7. The fraction of the liquid mass in the sheet increases with ${We}$. The ratios between the masses in the sheet and the rim determine the mass fractions of the child droplets generated by the rupture of the sheet and the rim. In phase V, the sheet portion of the bag inflates. The rapid radial expansion of the sheet also enhances the lateral expansion of the edge rim, resulting in a rapid increase of ${\rm d}\hat {R}/{\rm d}\hat {t}$, which is the key feature to distinguish phase V from phase IV. This subsection will focus on the inflation of simple bags.

The sheet inflation is driven mainly by the pressure difference across the liquid sheet. It is shown in figure 7(a) that $(\Delta p)_a$ varies over time. On the windward side, the gas pressure inside the bag is approximately uniform. The pressure in the bag is initially similar to the stagnation pressure of the free stream. However, as the bag inflates and the bag tip velocity increases, the pressure decreases. On the leeward side, due to flow separation on the lateral edge of the bag, the pressure in the wake is generally lower than the free-stream pressure. Different from the pressure on the windward side of the bag, the pressure on the leeward side increases as the bag inflates due to the resulting delay of flow separation.

The model of Villermaux & Bossa (Reference Villermaux and Bossa2009) predicts that the sheet thickness for a disk decays exponentially over time, i.e.

(5.20)\begin{equation} \hat{h}_a \sim \exp({-}4\hat{t}). \end{equation}

Then (5.19) can be integrated, yielding two asymptotic limits:

(5.21)\begin{gather} \hat{L}_{fb} \sim \hat{t}^2 \quad \mathrm{for}\ \hat{t}\ll 1, \end{gather}
(5.22)\begin{gather}\hat{L}_{fb} \sim \exp(4 \hat{t}) \quad \mathrm{for}\ \hat{t}\gg 1. \end{gather}

In the model of Reyssat et al. (Reference Reyssat, Chevy, Biance, Petitjean and Quere2007), the bag was approximated as a spherical shell that extends uniformly in all directions. Also assuming that the pressure difference inside and outside scales with the stagnation pressure, they predicted that

(5.23)\begin{equation} \hat{L}_{fb} \sim (1-b \hat{t})^{{-}2}. \end{equation}

Then through mass conservation, it can be shown that

(5.24)\begin{equation} \hat{h}_a \sim (\hat{L}_{fb})^{{-}2} \sim (1-b\hat{t})^{4}. \end{equation}

The simulation results for $\hat {h}_a$ for ${We}=12.0$ and 15.3 are shown in figure 14(a). It can be observed that the early-time decrease of $\hat {h}_a$ in phases I and II is exponential, similar to the model of Villermaux & Bossa (Reference Villermaux and Bossa2009). However, since at this time range, the drop is not exactly a disk, the expression for $\hat {h}_a$ should be corrected to

(5.25)\begin{equation} \hat{h}_a=\exp(-\hat{t}), \end{equation}

instead of $\exp (-4\hat {t})$ in the original model. When the bag starts to inflate in the long time, the decay of $\hat {h}_a$ switches to a power law, as predicted by the model of Reyssat et al. (Reference Reyssat, Chevy, Biance, Petitjean and Quere2007), i.e.

(5.26)\begin{equation} \hat{h}_a=[1-b(\hat{t}-\hat{t}_{b0})]^{{-}4}, \end{equation}

where $b$ and $\hat {t}_{b0}$ are model coefficients that need to be fitted based on the simulation results. In the figure, $b=0.37$ and 0.58, and $\hat {t}_{b0}=0.4$ and 0.5, for ${We}=12.0$ and 15.3, respectively. The temporal evolutions of $\hat {h}_a$ for ${We}=12.0$ and 15.3 are quite similar until the end of phase III ($\hat {t}\approx 1.2$). Afterwards, $\hat {h}_a$ decays faster for ${We}=15.3$, which is due to mainly the long phase IV for ${We}=12.0$, during which $\hat {h}_a$ decays more gradually.

Figure 14. Time evolutions of (a) sheet thickness $\hat {h}_a$ and (b) bag length $\hat {L}_{fb}$ for the cases ${We}=12.0$ and 15.3. (c) Plot of $\hat {L}_{fb}$ as a function of $\hat {h}_a$.

The evolution of $\hat {L}_{fb}$ is shown in figure 14(b). In the early time of bag inflation, $\hat {L}_{fb}$ increases with time following a power law, similar to (5.21). We have to add a case-dependent parameter $\hat {t}_{b1}$, i.e.

(5.27)\begin{equation} \hat{L}_{fb}=(\hat{t}-\hat{t}_{b1})^{2}, \end{equation}

where the fitted values for $\hat {t}_{b1}$ are 0.6 and 0.7 for ${We}=12.0$ and 15.3, respectively. In the intermediate term, when the drop deforms as a disk, the increase of $\hat {L}_{fb}$ is exponential, as predicted by the model of Villermaux & Bossa (Reference Villermaux and Bossa2009) and (5.22). It is found that

(5.28)\begin{equation} \hat{L}_{fb}=\exp[b_2(\hat{t}-\hat{t}_{b2})], \end{equation}

where $b_2=2.5$ and 4.5, and $\hat {t}_{b2}=1.85$ and 1.55, for ${We}=12.0$ and 15.3, respectively. Similar trends have also been observed in the experiments (Villermaux & Bossa Reference Villermaux and Bossa2009). In the long time, when the bag inflates and deforms as a shell with decreasing thickness, it is observed that $\hat {L}_{fb}$ increases following another power law, similar to (5.23) given by the model of Reyssat et al. (Reference Reyssat, Chevy, Biance, Petitjean and Quere2007), i.e.

(5.29)\begin{equation} \hat{L}_{fb}=[1-b_3(\hat{t}-\hat{t}_{b3})]^{{-}2}, \end{equation}

where $b_3=0.98$ and 1.5, and $\hat {t}_{b3}=2.35$ and 1.68, for ${We}=12.0$ and 15.3, respectively. During bag inflation, $\hat {L}_{fb}$ increases with decreasing $\hat {h}_a$; see figure 14(c). The variation of $\hat {L}_{fb}$ for small $\hat {h}_a$ follows a power law, yet the power index is $-0.38$, instead of $-0.5$ given by (5.24). The agreement between the present simulation results with the theoretical scaling relations indicates that the early stage of bag inflation is well captured.

5.6. Phase VI bag rupture

As the bag sheet thickness continues to decrease, the two interfaces will eventually pinch, forming a hole in the liquid sheet. Generally, holes are formed at different locations at different times. The holes will expand as the rim retracts with the Taylor–Culick velocity (Opfer et al. Reference Opfer, Roisman, Venzmer, Klostermann and Tropea2014; Ling et al. Reference Ling, Fuster, Zaleski and Tryggvason2017; Agbaglah Reference Agbaglah2021). When different holes merge, the liquid sheet rupture completely, producing numerous small filaments and droplets, and the remaining rim. The bag rupture process for ${We}=12.0$ is shown in figure 15.

Figure 15. Time evolution of the drop surface from $\hat {t}=t/\tau _d=2.51$ to 2.58 for ${We}=12.0$, showing the breakup of the bag due to appearance and merging of holes. The colour on the interfaces represents the velocity magnitude. The three different views are shown for each time.

5.6.1. Effect of numerical breakup

In an ideal scenario without any tiny bubbles or contaminants in the liquid sheet and with no thermal fluctuations, as considered in the present simulations, the two interfaces will eventually pinch, resulting in holes in the liquid sheet. Van der Waals forces become important to the interfacial dynamics when the sheet thickness is between approximately 10 and 100 nm, and the interactions between van der Waals forces and surface tension typically dictate the sheet rupture and hole formation. The critical sheet thickness at which holes first appear due to van der Waals forces is referred to as the physical cutoff length, which is of the order of tens of nanometres. While the rupture dynamics of a stationary free liquid sheet has been studied extensively (Erneux & Davis Reference Erneux and Davis1993; Ida & Miksis Reference Ida and Miksis1996), the rupture of a dynamic moving sheet is less understood, and the corresponding critical sheet thickness could be significantly larger, as indicated in the drop aerobreakup experiment by Opfer et al. (Reference Opfer, Roisman, Venzmer, Klostermann and Tropea2014). The minimum cell size in a 3-D simulation, referred to as the numerical cutoff length, is significantly larger than the physical counterpart, and therefore the interface pinching occurs earlier in the simulation. When the liquid sheet thickness reduces to approximately twice the minimum cell size of the octree mesh, numerical error in VOF reconstruction will act as a perturbation on the interfaces, which eventually causes numerical pinching between the two interfaces of the sheet. The interface pinching will form small holes in the liquid sheet. The numerical breakup of the VOF method has both pros and cons. On one hand, it will allow topology change automatically, and no additional procedure is required as needed for other methods like the front-tracking method (Lu & Tryggvason Reference Lu and Tryggvason2018). On the other hand, the length scale for pinching to occur is related to mesh resolution. As a result, it will not produce mesh-independent results for liquid sheet breakup and hole formation. Recently, the manifold death method has been proposed by Chirco et al. (Reference Chirco, Maarek, Popinet and Zaleski2022) to model sheet rupture. Thin sheets are detected by taking quadratic moments of an indicator obtained from the VOF function, then pinching is induced manually based on a user-defined cutoff length that is independent of the cell size. The manifold death method has been applied recently to simulate bag breakup by Chirco et al. (Reference Chirco, Maarek, Popinet and Zaleski2022) and Tang et al. (Reference Tang, Adcock and Mostert2023), and it was observed that the method reduces the influence of numerical breakup on hole formation. Nevertheless, since the cutoff length scale in the manifold death method needs to be larger than the cell size, it will not produce ‘more physical’ results unless the mesh resolution is comparable to the physical length scale. The larger numerical cutoff length, which is approximately $1\ \mathrm {\mu } {\rm m}$ in the present simulation, will cause hole formation earlier than in reality, and as a result, the numerical simulation will not be able to capture the late stage of bag inflation and the bag rupture.

In spite of the limitations of the numerical simulation, the results at different resolutions obtained here are still useful for understanding the bag rupture dynamics, and the results can be used to extrapolate the unresolved stage of bag inflation. The evolution of the total surface area of the drop, normalized by its initial value, i.e. $S/S_0$, for ${We}=12.0$, is shown in figure 16(a). During the interaction between the drop and the free stream, the gas kinetic energy is transferred to the surface energy of the drop, thus the surface area increases over time. After holes are formed, the surface area will change to decrease due to the capillary expansion of the holes. Therefore, $S$ reaches the maximum value at approximately the onset time for sheet breakup. As the mesh resolution increases from $N=512$ to 2048, the breakup is delayed, and we can resolve the bag until $S/S_0\approx 5.5$ with $N=2048$. According to figure 14(a) and the fitted function (5.26), one can estimate the breakup time for a given physical cutoff length smaller than the minimum cell size. Then, based on the estimated breakup time, extrapolation from figure 16(a) can be used to estimate the surface area when the bag breaks according to the physical cutoff length.

Figure 16. Effect of mesh resolution on the bag bursting for ${We}=12.0$. (a) Time evolution of the drop surface area. (bd) Drop surfaces when the holes are just formed for different mesh resolutions $N=512$, 1024, 2048, respectively.

The bag morphology when holes are just formed is shown in figures 16(b), 16(c), and 16(d) for $N=512$, 1024 and 2048, respectively. Typically, the holes formed due to the lack of resolution in VOF reconstruction exhibit irregular shapes. Yet after they are formed, surface tension tends to regularize the shape of the hole and to form a rim on the edge of the hole. For $N=512$, many small holes are formed simultaneously, thus holes start to interact with each other before the rim gets a chance to develop. With the most refined mesh, $N=2048$, only three small holes are formed initially, and the subsequent evolutions of rims and holes are well captured; see also figure 15.

5.6.2. Hole dynamics and drop formation

After a hole is formed, the capillary retraction of the rim causes the hole to expand. The rim retraction velocity is the Taylor–Culick velocity $U_{TC}=\sqrt {2 \sigma /\rho _l h}$, where $h$ is the sheet thickness near the rim. As the sheet thickness in the bag is quite uniform, the rim retraction velocity is approximately constant and agrees well with $U_{TC}$ (Ling et al. Reference Ling, Fuster, Zaleski and Tryggvason2017; Agbaglah Reference Agbaglah2021). Nevertheless, as the rim moves along the curved liquid sheet, it experiences a centripetal acceleration along the radial direction of the bag; see figure 17(a). Along with the density difference, an RTI is triggered along the rim. The development of RTI leads to the formation of fingers normal to the rim pointing outwards. The subsequent Rayleigh–Plateau instability of the fingers detaches droplets. The process of finger formation and drop detachment at the rim is shown in figure 17(b). The colour on the interface represents the velocity magnitude, from which the interfacial velocity variation along the rim can be recognized. Similar drop formation processes were also observed in bubble bursting (Lhuissier & Villermaux Reference Lhuissier and Villermaux2012).

Figure 17. The RTI due to centripetal acceleration of the rim, forming fingers at the rim, which later detach to form child droplets. The results are for ${We}=12.0$ and $\hat {t}=2.534$–2.589, with increment 0.008. The colour on the interfaces represents the velocity magnitude; see figure 15 for the colour scale.

Figure 18 shows the interaction between two holes. It can be observed that when the rims of different holes collide, a new fish-shaped liquid lamella is formed, the disintegration of which produces a large number of small droplets. The hole–hole interaction has been investigated recently by Agbaglah (Reference Agbaglah2021) and Tang et al. (Reference Tang, Adcock and Mostert2023) through numerical simulation. The simulation results of Agbaglah (Reference Agbaglah2021) show that the collision of rims forms a rim instead of a lamella as observed here and in the results of Tang et al. (Reference Tang, Adcock and Mostert2023). The discrepancy is probably due to the fact that the sheet thicknesses considered by Agbaglah (Reference Agbaglah2021) are larger than those in the present cases. The small sheet thickness leads to a higher rim retraction velocity when they collide. This is also why the lamella formation was not observed in the present simulations with coarser meshes. Neel, Lhuissier & Villermaux (Reference Neel, Lhuissier and Villermaux2020) suggested characterizing the rim collision dynamics using the Weber number ${We}_{h}$, defined based on $U_{TC}$ and rim radius. It can be shown that ${We}_{h}$ is proportional to the ratio between the holes’ distance and the sheet thickness. When ${We}_{h}$ is sufficiently large, the rim collision will generate an expanding lamella with transverse modulation on the rim. The lamella will also break later to form a distribution of child droplets.

Figure 18. Interactions between rims of different holes when the hole-merging occurs. The results are for ${We}=12.0$ and $\hat {t}=t/\tau _d=2.544$–2.562 with increment 0.004. The colour on the interfaces represents the velocity magnitude; see figure 15 for the colour scale.

While the present simulations are useful in revealing the qualitative droplet formation mechanisms, the larger numerical cutoff length scale will not allow for a quantitative prediction of the statistics of the droplets formed from the bag rupture. Such a prediction will be possible only if one can use a mesh resolution down to the physical cutoff length, or if a subgrid sheet model can be developed to represent the unresolved sheet inflation and breakup dynamics. These tasks are relegated to future works.

6. Turbulent wake and drop dynamics

6.1. Effect of drop deformation on the aerodynamic drag and lift

In the aerobreakup process, the drop accelerates due to aerodynamic drag. As discussed in § 3.3, the unsteady contributions to the drag, triggered by the impulsive gas acceleration, to the drop velocity are generally small due to the low gas-to-liquid density ratio. The drop acceleration is dictated mainly by the quasi-steady drag corresponding to the relative velocity $U_0-u_d$. The shape deformation has a strong impact on the quasi-steady drag and the resulting drop acceleration. The temporal evolutions of the normalized drop velocity $\hat {u}_d$, for different ${We}$, are shown in figure 19(a). When ${We}$ increases, the drop deforms more significantly, and the drop velocity increases faster. It can be seen that the drop velocity reaches approximately 18 % of $U_0$ for ${We}=18.0$ when the drop breaks, compared to approximately 12 % for ${We}=15.3$.

Figure 19. Time evolutions of (a) streamwise velocity of the drop $u_c$, (b) drop Reynolds number $Re_d$, (c) drag coefficient $C_D$, and (d,e) lift coefficients in the lateral $y$- and $z$-directions, for drops at different ${We}$.

The lateral radius $R$ is the characteristic length for the gas flow around the drop, based on which the instantaneous drop Reynolds number is defined as

(6.1)\begin{equation} {Re}_d = \frac{\rho_g (U_0-u_d) 2R}{\mu_g} . \end{equation}

The evolutions of ${Re}_d$ for different ${We}$ are shown in figure 19(b). At time zero, ${Re}_d={Re}$. As time evolves, the differences in ${Re}_d$ for different cases are magnified. Though the relative velocity $U_0-u_d$ decreases over time, ${Re}_d$ increases, thanks to the rapid increase of $R$. For ${We}=18.0$, ${Re}_d$ can increase to almost three times its initial value. For the cases ${We}=10.9$ and 11.5, when $\hat {R}$ turns to decrease at later time, ${Re}_d$ also decreases. For all the cases considered, ${Re}_d$ varies between approximately 2000 and 8000. For a solid sphere, this range of ${Re}_d$ lies in the chaotic vortex shedding regime and subcritical turbulent wake regime (Tiwari et al. Reference Tiwari, Pal, Bale, Minocha, Patwardhan, Nandakumar and Joshi2020a). The shedding of the turbulent wake can be observed in figure 6(c).

Since the drag coefficient $C_D$ is defined (see (3.3)) based on the instantaneous relative velocity and drop radius, the time variations of $U_0-u_d$ and $R$ actually do not contribute to changes in $C_D$ over time. While a constant $C_D$ is often assumed in previous studies (Marcotte & Zaleski Reference Marcotte and Zaleski2019), a non-monotonic time evolution of $C_D$ is observed here, as shown in figure 19(c), which is due to the complex drop shape deformation in different phases. Once again, we take the case ${We}=12.0$ as the representative example to explain the physics behind it. When the drop remains approximately a sphere at early time, $C_D\approx 0.5$, which is expected for a spherical drop with large density and viscosity contrast. Then, as the drop deforms into an ellipsoid with decreasing streamwise thickness in phase I, $C_D$ increases until it reaches a local maximum. When the drop continues to deform into a disk in phase II, $C_D$ increases again until it reaches a plateau value of approximately 1, which is similar to the typical $C_D$ for a thin, flat circular disk. When the disk deforms into a bag in phases III and IV due to RTI, the change in the drop shape is relatively small, so $C_D$ increases slowly. When the bag inflates in phase V, as the bag shape becomes more aligned with the gas flow, $C_D$ decreases. The amplitude of variation in $C_D$ is generally more profound for cases with larger ${We}$.

6.2. Effect of transient development of gas flow

The present configuration involves a sudden exposure of the drop to the free stream, which causes the boundary layer around the drop to take a finite time to develop, as shown in figure 6(c). This boundary layer development contributes to viscous-unsteady drag and the resulting large amplitude variation of $C_D$ near $\hat {t}=0$. Despite the high Reynolds numbers, the flow remains approximately axisymmetric in phase I, and the transition to a turbulent wake does not occur until phase II. The formation of the disk in phase II enhances flow separation and accelerates the transition of the wake to turbulence. When the wake becomes turbulent, the gas pressure on the leeward side of the drop increases, as shown at $\hat {t}=0.79$ in figure 6(b). Consequently, the drag decreases at $\hat {t}\approx 0.6$–0.7, as shown in figure 19(c). The breakdown of wake symmetry induces lift on the drop. The lift coefficients in the lateral $y$- and $z$-directions are initially zero since the flow around the drop is approximately axisymmetric, but $C_y$ and $C_z$ become non-zero and start to oscillate in time approximately $\hat {t}=0.4$, as shown in figures 19(d) and 19(e). The low-frequency oscillation observed in the lift coefficients is related to the shedding of the wake. The wake features are consistent with the range of ${Re}$ for the present cases.

7. Conclusions

Detailed numerical simulations were performed in the present study to investigate the drop aerobreakup in the moderate Weber number (${We}$) regime. We have considered an ideal configuration, in which an initially stationary and spherical drop is subjected to a uniform gas stream. The liquid and gas are taken to be water and air, and the drop size is fixed at 1.9 mm, following the experiment of Jackiw & Ashgriz (Reference Jackiw and Ashgriz2021). A parametric study is carried out by varying the gas stream velocity ($U_0$). Due to the interaction with the uniform gas stream, the drop deforms from a sphere to a forward bag with the opening facing upstream. When ${We}$ is sufficiently high, the bag is unstable and will eventually inflate and be pierced through by the gas stream.

The numerical simulations were performed using the Basilisk solver. The mass–momentum consistent volume-of-fluid method is used to captured the sharp gas–liquid interface. The computational domain is discretized using quadtree/octree mesh, and an adaptive mesh refinement technique is employed to reduce the total number of cells. To resolve the bag inflation and rupture dynamics, the finest mesh used in the simulation is equivalent to 2048 cells across the initial drop diameter.

The key findings of the present study are summarized as follows.

  1. (i) High-resolution 3-D simulation is necessary to capture drop aerobreakup. Both 2-D axisymmetric and 3-D simulations were performed, using identical numerical methods and initial/boundary conditions. The converged 2-D simulation results are shown to be significantly different from the 3-D simulation and experimental results, because 2-D simulations cannot resolve the turbulent wake, and as a result, will not be able to capture the correct bag shape and drop acceleration. Grid-refinement studies were performed for the 3-D simulations, and the adaptive mesh with a minimum cell size equivalent to 512 cells across the initial drop diameter is sufficient to yield mesh-independent results for the drop shape, drag coefficient and gas enstrophy. The 3-D simulation results are compared against previous experiments, and good agreement is achieved.

  2. (ii) Different phases in the drop morphological evolution are identified. The non-monotonic evolution of the rate of change of the lateral drop radius (${\rm d}R/{\rm d}t$) shows clearly different phases in the overall process, including (I) ellipsoid deformation, (II) disk formation, (III) disk deformation, (IV) bag development, (V) bag inflation, and (VI) bag rupture.

  3. (iii) The asymptotic early-time drop dynamics is independent of ${We}$. In the asymptotic limit of $t\to 0$, the evolutions of the drop shapes for different ${We}$ collapse. This ${We}$ independence in early-time drop dynamics is consistent with the time scale analysis and is affirmed further by the good agreement between drop velocities obtained by the present simulations and the inviscid compressible simulations in previous studies.

  4. (iv) A new internal-flow deformation model is proposed for phase I. The drop deforms as an ellipsoid in phase I, and the deformation is dictated by the internal flow, which is, in turn, driven by the stagnation flow near the windward pole. An improved internal-flow deformation model is proposed, which respects the ${We}$-independent asymptotic limit at time zero. The results of the present model show better agreement with the present simulation results, compared to previous models.

  5. (v) The disk is formed when the Laplace pressure at the edge is in balance with the stagnation pressure. The drop deforms towards a disk with a rounded edge in phase II. The edge rim of the disk is formed when ${\rm d}R/{\rm d}t$ reaches a local maximum, namely ${\rm d}^2R/{\rm d}t^2=0$, and the Laplace pressure at the edge rim reaches a balance with the gas stagnation pressure on the windward surface.

  6. (vi) The RTI dictates the thinning of the disk centre. When the disk is accelerated along the streamwise direction, the windward surface is unstable while the leeward surface is stable. The development of the RTI becomes the dominant mechanism for the continuous drop lateral extension and the thinning of the disk centre in phase III. The surface tension at the edge rim resists the RTI development, and as a result, ${\rm d}R/{\rm d}t$ decreases in time.

  7. (vii) Bag piercing does not guarantee bag fragmentation. When the thin disk centre curves downstream, the disk deforms to a forward bag. The bag can be pierced through by the gas stream only if the minimum thickness of the disk can decrease to be lower than a threshold, which is approximately 20 % of the original drop diameter. More importantly, when ${We}$ is just lower than ${We}_{cr}$, the bag can be pierced through but does not fragment into droplets, as the ring rim will retract towards the centre and eventually will turn back to a big drop.

  8. (viii) Evolutions of the bag length and sheet thickness follow similar power laws when the bag inflates. In phase V, the rapid inflation of the bag causes the rim lateral velocity ${\rm d}R/{\rm d}t$ to increase rapidly over time. The increase of the bag length and the decrease of the sheet thickness follow exponential functions initially and then switch to power laws. The agreement with the power-law scaling actually indicates that the sheet expands uniformly in all directions when the bag inflates. That is because the gas pressure is approximately uniform inside the bag.

  9. (ix) Hole–hole interaction is important to the disintegration of the bag. The numerical cutoff length is significantly larger than the physical counterpart, thus the bags in the simulations break earlier than in reality. Nevertheless, the simulation results for the most refined mesh well capture the dynamics of holes. When two holes merge, the collision between the two rims forms a lamella first, then the lamella disintegrates into small droplets.

  10. (x) The drop morphological change has a strong impact on the drag coefficient. The evolutions of the drop deformation and acceleration are coupled closely. Due to the low gas-to-liquid density ratio, the drop acceleration is due mainly to the quasi-steady drag. Although the relative velocity $U_0-u_d$ decreases in time, the instantaneous Reynolds number increases with $R$. The non-monotonic evolution of the drag coefficient $C_D$ is caused mainly by the change of drop shape; $C_D$ decreases over time as the bag inflates, and the flow separation is delayed.

Supplementary material

Supplementary movies are available at https://doi.org/10.1017/jfm.2023.708.

Acknowledgements

The XSEDE/ACCESS and Frontera programmes have provided the computational resources that contributed to the simulation results reported in this paper. The Baylor High Performance and Research Computing Services (HPRCS) have been used for the simulation and data processing. The authors would also like to acknowledge S. Zaleski, N. Rimbert, J. McFarland and F. Marcotte for helpful discussions. The present simulations were performed using the Basilisk solver, which is made available by S. Popinet and other collaborators.

Funding

This research is supported by the ACS Petroleum Research Fund (no. 62481-ND9) and the NSF (no. 1942324).

Declaration of interests

The authors report no conflict of interest.

References

Agbaglah, G.G. 2021 Breakup of thin liquid sheets through hole–hole and hole–rim merging. J. Fluid Mech. 911, A23.CrossRefGoogle Scholar
Apte, S.V., Gorokhovski, M. & Moin, P. 2003 LES of atomizing spray with stochastic modeling of secondary breakup. Intl J. Multiphase Flow 29, 15031522.CrossRefGoogle Scholar
Arrufat, T., Crialesi-Esposito, M., Fuster, D., Ling, Y., Malan, L., Pal, S., Scardovelli, R., Tryggvason, G. & Zaleski, S. 2020 A momentum-conserving, consistent, volume-of-fluid method for incompressible flow on staggered grids. Comput. Fluids 215, 104785.CrossRefGoogle Scholar
Balachandar, S. 2009 A scaling analysis for point particle approaches to turbulent multiphase flows. Intl J. Multiphase Flow 35, 801810.CrossRefGoogle Scholar
Blanco, A. & Magnaudet, J. 1995 The structure of the axisymmetric high-Reynolds number flow around an ellipsoidal bubble of fixed shape. Phys. Fluids 7, 12651274.CrossRefGoogle Scholar
Burelbach, J.P., Bankoff, S.G. & Davis, S.H. 1988 Nonlinear stability of evaporating/condensing liquid films. J. Fluid Mech. 195, 463494.CrossRefGoogle Scholar
Chang, C.-H., Deng, X. & Theofanous, T.G. 2013 Direct numerical simulation of interfacial instabilities: a consistent, conservative, all-speed, sharp-interface method. J. Comput. Phys. 242, 946990.CrossRefGoogle Scholar
Chirco, L., Maarek, J., Popinet, S. & Zaleski, S. 2022 Manifold death: a volume of fluid implementation of controlled topological changes in thin sheets by the signature method. J. Comput. Phys. 467, 111468.CrossRefGoogle Scholar
Chou, W.-H. & Faeth, G.M. 1998 Temporal properties of secondary drop breakup in the bag breakup regime. Intl J. Multiphase Flow 24, 889912.CrossRefGoogle Scholar
Dai, Z. & Faeth, G.M. 2001 Temporal properties of secondary drop breakup in the multimode breakup regime. Intl J. Multiphase Flow 27, 217236.CrossRefGoogle Scholar
Erneux, T. & Davis, S.H. 1993 Nonlinear rupture of free films. Phys. Fluids A 5, 11171122.CrossRefGoogle Scholar
Flock, A.K., Guildenbecher, D.R., Chen, J., Sojka, P.E. & Bauer, H.-J. 2012 Experimental statistics of droplet trajectory and air flow during aerodynamic fragmentation of liquid drops. Intl J. Multiphase Flow 47, 3749.CrossRefGoogle Scholar
Gao, J., Guildenbecher, D.R., Reu, P.L., Kulkarni, V., Sojka, P.E. & Chen, J. 2013 Quantitative, three-dimensional diagnostics of multiphase drop fragmentation via digital in-line holography. Opt. Lett. 38, 18931895.CrossRefGoogle ScholarPubMed
Guildenbecher, D.R., Gao, J., Chen, J. & Sojka, P.E. 2017 Characterization of drop aerodynamic fragmentation in the bag and sheet-thinning regimes by crossed-beam, two-view, digital in-line holography. Intl J. Multiphase Flow 94, 107122.CrossRefGoogle Scholar
Guildenbecher, D.R., López-Rivera, C. & Sojka, P.E. 2009 Secondary atomization. Exp. Fluids 46, 371.CrossRefGoogle Scholar
Hadj-Achour, M., Rimbert, N., Gradeck, M. & Meignen, R. 2021 Fragmentation of a liquid metal droplet falling in a water pool. Phys. Fluids 33, 103315.CrossRefGoogle Scholar
Han, J. & Tryggvason, G. 1999 Secondary breakup of axisymmetric liquid drops. I. Acceleration by a constant body force. Phys. Fluids 11, 36503667.CrossRefGoogle Scholar
Han, J. & Tryggvason, G. 2001 Secondary breakup of axisymmetric liquid drops. II. Impulsive acceleration. Phys. Fluids 13, 15541565.CrossRefGoogle Scholar
Harper, E.Y., Grube, G.W. & Chang, I.-D. 1972 On the breakup of accelerating liquid drops. J. Fluid Mech. 52, 565591.CrossRefGoogle Scholar
Hinze, J.O. 1955 Fundamentals of the hydrodynamic mechanism of splitting in dispersion processes. AIChE J. 1, 289295.CrossRefGoogle Scholar
van Hooft, J.A., Popinet, S., van Heerwaarden, C.C., van der Linden, S.J.A., de Roode, S.R. & van de Wiel, B.J.H. 2018 Towards adaptive grids for atmospheric boundary-layer simulations. Boundary-Layer Meteorol. 167, 421443.CrossRefGoogle ScholarPubMed
Hsiang, L.-P. & Faeth, G.M. 1992 Near-limit drop deformation and secondary breakup. Intl J. Multiphase Flow 18, 635652.CrossRefGoogle Scholar
Hsiang, L.-P. & Faeth, G.M. 1995 Drop deformation and breakup due to shock wave and steady disturbances. Intl J. Multiphase Flow 21, 545560.CrossRefGoogle Scholar
Ida, M.P. & Miksis, M.J. 1996 Thin film rupture. Appl. Maths Lett. 9, 3540.CrossRefGoogle Scholar
Jackiw, I.M. & Ashgriz, N. 2021 On aerodynamic droplet breakup. J. Fluid Mech. 913, A33.CrossRefGoogle Scholar
Jackiw, I.M. & Ashgriz, N. 2022 Prediction of the droplet size distribution in aerodynamic droplet breakup. J. Fluid Mech. 940, A17.CrossRefGoogle Scholar
Jain, M., Prakash, R.S., Tomar, G. & Ravikrishna, R.V. 2015 Secondary breakup of a drop at moderate Weber numbers. Proc. R. Soc. Lond. A 471, 20140930.Google Scholar
Jain, S.S., Tyagi, N., Prakash, R.S., Ravikrishna, R.V. & Tomar, G. 2019 Secondary breakup of drops at moderate Weber numbers: effect of density ratio and Reynolds number. Intl J. Multiphase Flow 117, 2541.CrossRefGoogle Scholar
Jalaal, M. & Mehravaran, K. 2014 Transient growth of droplet instabilities in a stream. Phys. Fluids 26, 012101.CrossRefGoogle Scholar
Jing, L. & Xu, X. 2010 Direct numerical simulation of secondary breakup of liquid drops. Chinese J. Aeronaut. 23, 153161.CrossRefGoogle Scholar
Joseph, D.D., Belanger, J. & Beavers, G.S. 1999 Breakup of a liquid drop suddenly exposed to a high-speed airstream. Intl J. Multiphase Flow 25, 12631303.CrossRefGoogle Scholar
Kekesi, T., Amberg, G. & Wittberg, L.P. 2014 Drop deformation and breakup. Intl J. Multiphase Flow 66, 110.CrossRefGoogle Scholar
Kulkarni, V. & Sojka, P.E. 2014 Bag breakup of low viscosity drops in the presence of a continuous air jet. Phys. Fluids 26, 072103.CrossRefGoogle Scholar
Lee, C.S. & Reitz, R.D. 2001 Effect of liquid properties on the breakup mechanism of high-speed liquid drops. Atomiz. Spray 11, 119.Google Scholar
Lhuissier, H. & Villermaux, E. 2012 Bursting bubble aerosols. J. Fluid Mech. 696, 544.CrossRefGoogle Scholar
Ling, Y., Fuster, D., Zaleski, S. & Tryggvason, G. 2017 Spray formation in a quasiplanar gas–liquid mixing layer at moderate density ratios: a numerical closeup. Phys. Rev. Fluids 2, 014005.CrossRefGoogle Scholar
Ling, Y., Haselbacher, A. & Balachandar, S. 2011 Importance of unsteady contributions to force and heating for particles in compressible flows. Part 1: modeling and analysis for shock–particle interaction. Intl J. Multiphase Flow 37, 10261044.CrossRefGoogle Scholar
Ling, Y., Parmar, M. & Balachandar, S. 2013 A scaling analysis of added-mass and history forces and their coupling in dispersed multiphase flows. Intl J. Multiphase Flow 57, 102114.CrossRefGoogle Scholar
Liu, A.B. & Reitz, R.D. 1993 Mechanisms of air-assisted liquid atomization. Atomiz. Spray 3, 5575.CrossRefGoogle Scholar
Liu, Z. & Reitz, R.D. 1997 An analysis of the distortion and breakup mechanisms of high speed liquid drops. Intl J. Multiphase Flow 23, 631650.CrossRefGoogle Scholar
Lu, J. & Tryggvason, G. 2018 Direct numerical simulations of multifluid flows in a vertical channel undergoing topology changes. Phys. Rev. Fluids 3 (8), 084401.CrossRefGoogle Scholar
Magnaudet, J. & Mougin, G. 2007 Wake instability of a fixed spheroidal bubble. J. Fluid Mech. 572, 311337.CrossRefGoogle Scholar
Marcotte, F. & Zaleski, S. 2019 Density contrast matters for drop fragmentation thresholds at low Ohnesorge number. Phys. Rev. Fluids 4, 103604.CrossRefGoogle Scholar
Maxey, M.R. & Riley, J.J. 1983 Equation of motion for a small rigid sphere in a nonuniform flow. Phys. Fluids 26, 883889.CrossRefGoogle Scholar
Mei, R., Lawrence, C.J. & Adrian, R.J. 1991 Unsteady drag on a sphere at finite Reynolds number with small fluctuations in the free-stream velocity. J. Fluid Mech. 233, 613631.CrossRefGoogle Scholar
Meng, J.C. & Colonius, T. 2018 Numerical simulation of the aerobreakup of a water droplet. J. Fluid Mech. 835, 11081135.CrossRefGoogle Scholar
Mikaelian, K.O. 1990 Rayleigh–Taylor and Richtmyer–Meshkov instabilities in multilayer fluids with surface tension. Phys. Rev. A 42, 7211.CrossRefGoogle ScholarPubMed
Mikaelian, K.O. 1996 Rayleigh–Taylor instability in finite-thickness fluids with viscosity and surface tension. Phys. Rev. E 54, 3676.CrossRefGoogle ScholarPubMed
Miksis, M., Vanden-Broeck, J.-M. & Keller, J.B. 1981 Axisymmetric bubble or drop in a uniform flow. J. Fluid Mech. 108, 89100.CrossRefGoogle Scholar
Mostert, W., Popinet, S. & Deike, L. 2022 High-resolution direct simulation of deep water breaking waves: transition to turbulence, bubbles and droplets production. J. Fluid Mech. 942, A27.CrossRefGoogle Scholar
Neel, B., Lhuissier, H. & Villermaux, E. 2020 ‘Fines’ from the collision of liquid rims. J. Fluid Mech. 893, A16.CrossRefGoogle Scholar
Opfer, L., Roisman, I.V., Venzmer, J., Klostermann, M. & Tropea, C. 2014 Droplet–air collision dynamics: evolution of the film thickness. Phys. Rev. E 89, 013023.CrossRefGoogle ScholarPubMed
O'Rourke, P.J. & Amsden, A.A. 1987 The TAB method for numerical calculation of spray droplet breakup. Tech. Rep. LA-UR-2105. Los Alamos National Laboratory.CrossRefGoogle Scholar
Pai, M.G. & Subramaniam, S. 2006 Modeling interphase turbulent kinetic energy transfer in Lagrangian–Eulerian spray computations. Atomiz. Spray 16, 807826.CrossRefGoogle Scholar
Park, J.-H., Yoon, Y. & Hwang, S.-S. 2002 Improved TAB model for prediction of spray droplet deformation and breakup. Atomiz. Spray 12, 387401.CrossRefGoogle Scholar
Pilch, M. & Erdman, C.A. 1987 Use of breakup time data and velocity history data to predict the maximum size of stable fragments for acceleration-induced breakup of a liquid drop. Intl J. Multiphase Flow 13, 741757.CrossRefGoogle Scholar
Popinet, S. 2009 An accurate adaptive solver for surface-tension-driven interfacial flows. J. Comput. Phys. 228 (16), 58385866.CrossRefGoogle Scholar
Ranger, A.A. & Nicholls, J.A. 1969 Aerodynamic shattering of liquid drops. AIAA J. 7, 285290.Google Scholar
Reyssat, E., Chevy, F., Biance, A.-L., Petitjean, L. & Quere, D. 2007 Shape and instability of free-falling liquid globules. Europhys. Lett. 80, 34005.CrossRefGoogle Scholar
Rimbert, N., Escobar, S.C., Meignen, R., Hadj-Achour, M. & Gradeck, M. 2020 Spheroidal droplet deformation, oscillation and breakup in uniform outer flow. J. Fluid Mech. 904, A15.CrossRefGoogle Scholar
Sakakeeny, J., Deshpande, C., Deb, S., Alvarado, J.L. & Ling, Y. 2021 A model to predict the oscillation frequency for drops pinned on a vertical planar surface. J. Fluid Mech. 928, A28.CrossRefGoogle Scholar
Sakakeeny, J. & Ling, Y. 2020 Natural oscillations of a sessile drop on flat surfaces with mobile contact lines. Phys. Rev. Fluids 5, 123604.CrossRefGoogle Scholar
Sakakeeny, J. & Ling, Y. 2021 Numerical study of natural oscillations of supported drops with free and pinned contact lines. Phys. Fluids 33, 062109.CrossRefGoogle Scholar
Scardovelli, R. & Zaleski, S. 1999 Direct numerical simulation of free-surface and interfacial flow. Annu. Rev. Fluid Mech. 31, 567603.CrossRefGoogle Scholar
Sharma, S., Singh, A.P., Rao, S.S., Kumar, A. & Basu, S. 2021 Shock induced aerobreakup of a droplet. J. Fluid Mech. 929, A27.CrossRefGoogle Scholar
Stefanitsis, D., Malgarinos, I., Strotos, G., Nikolopoulos, N., Kakaras, E. & Gavaises, M. 2017 Numerical investigation of the aerodynamic breakup of diesel and heavy fuel oil droplets. Intl J. Heat Fluid Flow 68, 203215.CrossRefGoogle Scholar
Stefanitsis, D., Malgarinos, I., Strotos, G., Nikolopoulos, N., Kakaras, E. & Gavaises, M. 2019 a Numerical investigation of the aerodynamic breakup of droplets in tandem. Intl J. Multiphase Flow 113, 289303.CrossRefGoogle Scholar
Stefanitsis, D., Strotos, G., Nikolopoulos, N., Kakaras, E. & Gavaises, M. 2019 b Improved droplet breakup models for spray applications. Intl J. Heat Fluid Flow 76, 274286.CrossRefGoogle Scholar
Strotos, G., Malgarinos, I., Nikolopoulos, N. & Gavaises, M. 2016 Predicting droplet deformation and breakup for moderate Weber numbers. Intl J. Multiphase Flow 85, 96109.CrossRefGoogle Scholar
Tang, K., Adcock, T. & Mostert, W. 2023 Bag film breakup of droplets in uniform airflows. J. Fluid Mech. 970, A9.Google Scholar
Tanner, F.X. 1997 Liquid jet atomization and droplet breakup modeling of non-evaporating diesel fuel sprays. SAE Trans. J. Engines 106, 127140.Google Scholar
Taylor, G.I. 1949 The shape and acceleration of a drop in a high-speed air stream. In The Scientific Papers of G.I. Taylor. Vol. III. Aerodynamics and the Mechanics of Projectiles and Explosions (ed. G.K. Batchelor). Cambridge University Press.Google Scholar
Theofanous, T.G. 2011 Aerobreakup of Newtonian and viscoelastic liquids. Annu. Rev. Fluid Mech. 43, 661690.CrossRefGoogle Scholar
Theofanous, T.G. & Li, G.J. 2008 On the physics of aerobreakup. Phys. Fluids 20, 052103.CrossRefGoogle Scholar
Theofanous, T.G., Li, G.J. & Dinh, T.-N. 2004 Aerobreakup in rarefied supersonic gas flows. Trans. ASME J. Fluid Engng 126, 516527.CrossRefGoogle Scholar
Theofanous, T.G., Li, G.J., Dinh, T.-N. & Chang, C.-H. 2007 Aerobreakup in disturbed subsonic and supersonic flow fields. J. Fluid Mech. 593, 131170.CrossRefGoogle Scholar
Theofanous, T.G., Mitkin, V.V. & Ng, C.L. 2013 The physics of aerobreakup. III. Viscoelastic liquids. Phys. Fluids 25, 032101.CrossRefGoogle Scholar
Theofanous, T.G., Mitkin, V.V., Ng, C.L., Chang, C.H., Deng, X. & Sushchikh, S. 2012 The physics of aerobreakup. II. Viscous liquids. Phys. Fluids 24, 022104.CrossRefGoogle Scholar
Tiwari, S.S., Pal, E., Bale, S., Minocha, N., Patwardhan, A.W., Nandakumar, K. & Joshi, J.B. 2020 a Flow past a single stationary sphere, 1. Experimental and numerical techniques. Powder Technol. 365, 115148.CrossRefGoogle Scholar
Tiwari, S.S., Pal, E., Bale, S., Minocha, N., Patwardhan, A.W., Nandakumar, K. & Joshi, J.B. 2020 b Flow past a single stationary sphere, 2. Regime mapping and effect of external disturbances. Powder Technol. 365, 215243.CrossRefGoogle Scholar
Vanden-Broeck, J.-M. & Keller, J.B. 1980 Deformation of a bubble or drop in a uniform flow. J. Fluid Mech. 101, 673686.CrossRefGoogle Scholar
Villermaux, E. & Bossa, B. 2009 Single-drop fragmentation determines size distribution of raindrops. Nat. Phys. 5, 697702.CrossRefGoogle Scholar
Villermaux, E. & Bossa, B. 2011 Drop fragmentation on impact. J. Fluid Mech. 668, 412.CrossRefGoogle Scholar
Wert, K.L. 1995 A rationally-based correlation of mean fragment size for drop secondary breakup. Intl J. Multiphase Flow 21, 10631071.CrossRefGoogle Scholar
Williams, M.B. & Davis, S.H. 1982 Nonlinear theory of film rupture. J. Colloid Interface Sci. 90 (1), 220228.CrossRefGoogle Scholar
Yang, W., Jia, M., Sun, K. & Wang, T. 2016 Influence of density ratio on the secondary atomization of liquid droplets under highly unstable conditions. Fuel 174, 2535.CrossRefGoogle Scholar
Zhang, B., Popinet, S. & Ling, Y. 2020 Modeling and detailed numerical simulation of the primary breakup of a gasoline surrogate jet under non-evaporative operating conditions. Intl J. Multiphase Flow 130, 103362.CrossRefGoogle Scholar
Zhao, H., Liu, H.-F., Xu, J.-L., Li, W.-F. & Lin, K.-F. 2013 Temporal properties of secondary drop breakup in the bag-stamen breakup regime. Phys. Fluids 25, 054102.CrossRefGoogle Scholar
Figure 0

Figure 1. Schematics of the computational domains for (a) 2-D-axisymmetric and (b) 3-D simulations.

Figure 1

Table 1. Fluid properties for simulation cases.

Figure 2

Table 2. Simulation cases and key parameters.

Figure 3

Figure 2. (a) Representative snapshot of the drop surface and velocity magnitude on the central $x$$y$ plane, with annotations showing the characteristic length scales for the drop shape. (b) Time evolution of $h_a=x_{max,a}-x_{min,a}$ for ${We}=15.3$, indicating the time ranges resolved by different mesh resolutions. The horizontal lines indicate the minimum cell size for each mesh. The dimensionless variables are denoted by $\hat {,}$ and defined in (3.10ae) and (3.11).

Figure 4

Figure 3. Time evolutions of (a) the drop length $\hat {L}$ and (b) the drop radius $\hat {R}$, for $We=15.3$, obtained from the 3-D simulations. The experimental results by Opfer et al. (2014), Flock et al. (2012) and Jackiw & Ashgriz (2021) are shown for comparison.

Figure 5

Figure 4. Time evolutions of (a) drag coefficient $C_D$ and (b) gas enstrophy $\hat {\varOmega }_g=\varOmega _g d_0/U_0^2$ for ${We}=15.3$. The 3-D simulation results for two different mesh resolutions, $N=256$ and 512, are shown. In (b), the results for $N=256$ were obtained by the mesh refinement $\mathcal {L}=14$ without further increase, as in other cases.

Figure 6

Figure 5. Comparison between 2-D-axisymmetric and 3-D simulation results for $We=15.3$, including (a) drop length $\hat {L}$, (b) drop radius $\hat {R}$, (c) drop velocity $u_d$, and (d) drag coefficient $C_D$. The experimental results by Opfer et al. (2014), Flock et al. (2012) and Jackiw & Ashgriz (2021) are shown in (a,b) for comparison.

Figure 7

Figure 6. Time evolutions of the pressure field on the $x$$y$ plane using (a) 2-D-axisymmetric and (b) 3-D simulations. (c) Vortical structures using 3-D simulations. The results are for the case ${We}=15.3$. The colour on the drop surface in (c) represents the velocity magnitude. See movies in the supplementary materials available at https://doi.org/10.1017/jfm.2023.708.

Figure 8

Figure 7. Temporal evolutions of (a) pressure $p$ and (b) $y$-velocity in the drop on the central $x$$y$ plane. (c) Drop surface coloured with velocity magnitude. (d) Drop lateral radius $\hat {R}$ and its rate of change ${\rm d}\hat {R}/{\rm d}\hat {t}$ for ${We}=12.0$. Different phases of deformation are defined and indicated.

Figure 9

Figure 8. Early-time evolution of (a) rate of change of drop radius ${\rm d}\hat {R}/{\rm d}\hat {t}$ and (b) drop velocity $\hat {u}_d$, for different ${We}$. The inviscid compressible flow simulation results for shock–droplet interaction by Meng & Colonius (2018) are shown in (b) for comparison.

Figure 10

Figure 9. Comparison between the present simulation and model results for ${\rm d}\hat {R}/{\rm d}\hat {t}$ and $\hat {R}$ and predictions of other models for (a,c) ${We}=12.0$ and (b,d) ${We}=15.3$. The results for other models are shown as well: VB, KS, TAB, Rimbert represent the models of Villermaux & Bossa (2009), Kulkarni & Sojka (2014), O'Rourke & Amsden (1987) and Rimbert et al. (2020); JA and JA2 represent the two models of Jackiw & Ashgriz (2021) ((5.9) and (5.10)). The results for the model of Rimbert et al. (2020) are based on the corrected parameter $K_C$. Refer to the text for more details.

Figure 11

Figure 10. (a) Comparison of Laplace pressure (5.14) with liquid inertia (5.15) and gas pressure differences estimated by the VB (5.16) and present (5.17) models as a function of ${We}$ when the rim is formed. (b) Comparison of the drop lateral radius when the rim is formed, $\hat {R}^*$, measured from the present simulation and the model prediction (5.18).

Figure 12

Figure 11. Time evolutions of (a) the drop radius $\hat {R}$, (b) the drop length $\hat {L}$, (c) the rate of change of $\hat {R}$, (d) the bag length $L_{fb}$, and (e) the bag sheet thickness along the $x$-axis, for different ${We}$.

Figure 13

Figure 12. Temporal evolution of the $y$-velocity ($u_y$) on the central $x$$y$ plane inside the drop for different ${We}$ values: (a) 10.9, (b) 11.5, (c) 12.0, (d) 15.3, and (e) 18.0. The points C and D marked in (d,e) indicate the concave locations on the perturbed windward surface due to drop deformation. Different deformation phases for ${We}=12.0$ are indicated in (c).

Figure 14

Figure 13. Bag morphological evolutions for (a) ${We}=15.3$ (simple bag) and (b) 18.0 (ring bag). The colour represents the velocity magnitude, and the colour scale is the same as in figure 7.

Figure 15

Figure 14. Time evolutions of (a) sheet thickness $\hat {h}_a$ and (b) bag length $\hat {L}_{fb}$ for the cases ${We}=12.0$ and 15.3. (c) Plot of $\hat {L}_{fb}$ as a function of $\hat {h}_a$.

Figure 16

Figure 15. Time evolution of the drop surface from $\hat {t}=t/\tau _d=2.51$ to 2.58 for ${We}=12.0$, showing the breakup of the bag due to appearance and merging of holes. The colour on the interfaces represents the velocity magnitude. The three different views are shown for each time.

Figure 17

Figure 16. Effect of mesh resolution on the bag bursting for ${We}=12.0$. (a) Time evolution of the drop surface area. (bd) Drop surfaces when the holes are just formed for different mesh resolutions $N=512$, 1024, 2048, respectively.

Figure 18

Figure 17. The RTI due to centripetal acceleration of the rim, forming fingers at the rim, which later detach to form child droplets. The results are for ${We}=12.0$ and $\hat {t}=2.534$–2.589, with increment 0.008. The colour on the interfaces represents the velocity magnitude; see figure 15 for the colour scale.

Figure 19

Figure 18. Interactions between rims of different holes when the hole-merging occurs. The results are for ${We}=12.0$ and $\hat {t}=t/\tau _d=2.544$–2.562 with increment 0.004. The colour on the interfaces represents the velocity magnitude; see figure 15 for the colour scale.

Figure 20

Figure 19. Time evolutions of (a) streamwise velocity of the drop $u_c$, (b) drop Reynolds number $Re_d$, (c) drag coefficient $C_D$, and (d,e) lift coefficients in the lateral $y$- and $z$-directions, for drops at different ${We}$.

Ling and Mahmood Supplementary Movie 1

Time evolutions of the drop surface and vortical structures for drop aerobreakup at We=12.0 and Re=2483. The color on the drop surface represents the interfacial velocity magnitude.

Download Ling and Mahmood Supplementary Movie 1(Video)
Video 14.6 MB

Ling and Mahmood Supplementary Movie 2

Time evolutions of the drop surface and vortical structures for drop aerobreakup at We=15.3 and Re=2800. The color on the drop surface represents the interfacial velocity magnitude.

Download Ling and Mahmood Supplementary Movie 2(Video)
Video 6.7 MB

Ling and Mahmood Supplementary Movie 3

Time evolutions of the drop surface and pressure on the central plane for drop aerobreakup at We=12.0 and Re=2483.

Download Ling and Mahmood Supplementary Movie 3(Video)
Video 2.1 MB

Ling and Mahmood Supplementary Movie 4

Time evolutions of the drop surface and pressure on the central plane for drop aerobreakup at We=15.3 and Re=2800.

Download Ling and Mahmood Supplementary Movie 4(Video)
Video 1.1 MB