Hostname: page-component-cd9895bd7-7cvxr Total loading time: 0 Render date: 2024-12-23T18:09:30.052Z Has data issue: false hasContentIssue false

Attenuation of perturbation growth of single-mode SF6–air interface through reflected rarefaction waves

Published online by Cambridge University Press:  15 August 2023

Chenren Chen
Affiliation:
Advanced Propulsion Laboratory, Department of Modern Mechanics, University of Science and Technology of China, Hefei 230026, PR China
He Wang
Affiliation:
Advanced Propulsion Laboratory, Department of Modern Mechanics, University of Science and Technology of China, Hefei 230026, PR China
Zhigang Zhai*
Affiliation:
Advanced Propulsion Laboratory, Department of Modern Mechanics, University of Science and Technology of China, Hefei 230026, PR China
Xisheng Luo
Affiliation:
Advanced Propulsion Laboratory, Department of Modern Mechanics, University of Science and Technology of China, Hefei 230026, PR China
*
Email address for correspondence: [email protected]

Abstract

Attenuation and even freeze-out (amplitude growth stagnation) of the perturbation amplitude growth of a shocked SF$_6$–air interface are first realized in shock-tube experiments through reflected rarefaction waves, which produce reverse baroclinic vorticity offsetting the vorticity deposited by the shock. A theoretical model is constructed to predict the perturbation growth after the impact of rarefaction waves, and seven possibilities of amplitude growth are analysed. Experimentally, a planar air–helium interface is used to produce reflected rarefaction waves. Through changing the perturbation wavelength and the time interval of two impacts, five experiments with specific initial conditions are carried out, and three different possibilities of perturbation growth attenuation are realized.

Type
JFM Rapids
Copyright
© The Author(s), 2023. Published by Cambridge University Press

1. Introduction

The Richtmyer–Meshkov (RM) instability (Richtmyer Reference Richtmyer1960; Meshkov Reference Meshkov1969) occurs when a perturbed interface separating two fluids with different densities is impacted by a shock wave. The initial perturbation amplitudes continuously grow with time, which causes the formation of interpenetrating bubbles (lighter fluids penetrating into heavier ones) and spikes (heavier fluids penetrating into lighter ones), and eventually leads to the flow transitioning to turbulent mixing between the light and heavy components. The development of the RM instability is mainly driven by baroclinic vorticity produced by misalignment of the pressure and density gradients. In inertial confinement fusion (ICF) (Lindl et al. Reference Lindl, Landen, Edwards and Moses2014), the development of the interface perturbation consumes a large amount of laser energy and impedes implosions. As a result, the RM instability is a significant obstacle to the realization of ICF and needs to be attenuated. If additional vorticity, which has the opposite sign to the original vorticity on the interface, is added to the single-shocked interface by a second wave impact, the perturbation growth can be degraded. This provides the possibility to attenuate the RM instability through a second wave impact.

The idea that the RM instability can be attenuated through a second shock impact was first proposed theoretically by Mikaelian (Reference Mikaelian1985). If the amplitude growth rate induced by the second shock exactly cancels the growth rate caused by the first shock, the amplitude growth will stagnate, which is called freeze-out. A simple theoretical model was constructed by Mikaelian (Reference Mikaelian1985) through superimposing the impulsive model (Richtmyer Reference Richtmyer1960) to predict the amplitude growth rate after two shock impacts. Through this model, various approaches to attenuate and even freeze the RM instability were theoretically proposed.

For a light–heavy interface, attenuation and freeze-out of the perturbation were realized through a weaker reflected shock in numerical simulations (Mikaelian Reference Mikaelian2010) and in shock-tube experiments (Chen et al. Reference Chen, Xing, Wang, Zhai and Luo2023). However, in a traditional ICF capsule, the incident shock always travels from the heavy fluid to the light one (Lindl et al. Reference Lindl, Landen, Edwards and Moses2014). For a heavy–light interface, a reflected shock always enhances the perturbation growth (Guo et al. Reference Guo, Cong, Si and Luo2022). In the concept proposed by Mikaelian (Reference Mikaelian1985), to attenuate the perturbation growth of a heavy–light interface after phase reversal, the second shock must propagate in the same direction as the first shock (two successive shock waves). Charakhch'yan (Reference Charakhch'yan2000, Reference Charakhch'yan2001) numerically verified that attenuation and freeze-out of a heavy–light perturbation growth can be realized through the impacts by two successive shock waves. Experimentally, however, it is difficult to generate and precisely control two successive shock waves in a conventional shock tube. Therefore, experimental studies on attenuation and freeze-out of a heavy–light interface perturbation are rare.

When reflected rarefaction waves move from light gas to heavy gas through a shocked interface, baroclinic vorticity of the opposite sign to that deposited by the incident shock will be produced on the shocked heavy–light interface. This provides a possibility to attenuate the RM instability of a heavy–light perturbation through the impact of reflected rarefaction waves. However, the impact of rarefaction waves will generally introduce the Rayleigh–Taylor (RT) instability (Rayleigh Reference Rayleigh1883; Taylor Reference Taylor1950), which complicates the flow. Previous studies mainly focused on the RT instability induced by rarefaction waves (Morgan, Likhachev & Jacobs Reference Morgan, Likhachev and Jacobs2016; Morgan et al. Reference Morgan, Cabot, Greenough and Jacobs2018), and the RM instability induced by rarefaction waves is rarely investigated in shock-tube experiments.

In this work, the perturbation development of a single-mode SF$_6$–air interface accelerated by an incident shock and its reflected rarefaction waves is investigated. A planar air–helium gas interface is used to produce reflected rarefaction waves. The duration of the reflected rarefaction waves interacting with the shocked interface is assumed to be short enough to ignore the RT instability. Through manipulating the perturbation wavelength and the time interval of the two impacts, three different behaviours of the perturbation growth attenuation after the rarefaction waves impact are experimentally realized. We shall first construct a model to predict the amplitude growth rate after the rarefaction waves impact. Then, corresponding experiments are designed according to the model. It will be shown that the amplitude growth is attenuated after the impact of rarefaction waves, and freeze-out is achieved under some designed conditions.

2. Theoretical analysis

There are three assumptions for theoretical analysis. First, the wavenumber ($k$) and amplitude ($a_{{r}}^{-}$) of the perturbation satisfy the small-perturbation hypothesis when the rarefaction waves arrive, i.e. $ka_{{r}}^{-}<1$. Second, the amplitude growth rates induced by the incident shock and the rarefaction waves follow the linear superposition principle (Mikaelian Reference Mikaelian1985), namely, $V_2=V_{{i}}+V_{{r}}$, where $V_2$ is the amplitude growth rate after the rarefaction waves impact, $V_{{i}}$ is the growth rate caused by the incident shock just before the rarefaction waves arrive and $V_{{r}}$ is the linear growth rate induced by the rarefaction waves. Third, the duration of the planar rarefaction waves interacting with the shocked interface is short enough that the RT instability (Rayleigh Reference Rayleigh1883; Taylor Reference Taylor1950) induced by the rarefaction waves can be ignored.

Sketches showing the interactions of a planar shock and reflected rarefaction waves with a single-mode SF$_6$–air interface are presented in figure 1. As the incident shock impacts the interface, the transmitted shock and the reflected rarefaction waves are generated, as shown in figure 1(b). To predict the amplitude development of a single-mode perturbation induced by a planar shock wave, the nonlinear model proposed by Zhang & Guo (Reference Zhang and Guo2016) (the ZG model) is adopted since it has been widely verified in previous work (Liu et al. Reference Liu, Liang, Ding, Liu and Luo2018; Guo et al. Reference Guo, Cong, Si and Luo2022). The ZG model can be described as

(2.1a,b)\begin{equation} V_{{i}}=V_{{i}}^{{{ZG}}}(t) =\frac{1}{2}[V_{{b}}^{{{ZG}}}(t)+V_{{s}}^{{{ZG}}}(t)], \quad V_{{{b/s}}}^{{{ZG}}}(t)={-}\frac{\lvert V_{{i}}^{{0}}\rvert} {1+\theta k\lvert V_{{i}}^{{0}}\rvert t}. \end{equation}

Here $V_{{b}/{s}}$ is the amplitude growth rate of the bubble/spike, where the minus sign denotes that the heavy–light perturbation growth induced by a shock has the opposite direction to the phase of perturbation before impact (Meyer & Blewett Reference Meyer and Blewett1972; Guo et al. Reference Guo, Cong, Si and Luo2022); $V_{{i}}^{{0}}$ is the linear amplitude growth rate of the heavy–light perturbation; and

(2.2)\begin{equation} \theta=\frac{3}{4}\frac{(1+A^+)(3+A^+)}{[3+A^{+}+\sqrt{2}(1+A^{+})^{1/2}]} \frac{[4(3+A^{+})+\sqrt{2}(9+A^{+})(1+A^{+})^{1/2}]} {[(3+A^{+})^2+2\sqrt{2}(3-A^{+})(1+A^{+})^{1/2}]} \end{equation}

is a function of the post-shock Atwood number ($A^+=(\rho ^+_2-\rho ^+_1)/(\rho ^+_2+\rho ^+_1)$, with $\rho ^+_1$ and $\rho ^+_2$ being the densities of the heavy and light fluids on both sides of the perturbed interface after the incident shock impact), with positive Atwood number for bubble and its negative counterpart for spike; $\theta$ represents the effect of Atwood number on the asymptotic growth rate of the perturbation amplitude.

Figure 1. Schematics showing the interaction processes of the incident shock and reflected rarefaction waves with a single-mode SF$_6$–air interface: (a) before and (b) after the incident shock impact; and (c) before and (d) after the reflected rarefaction waves impact. Here $a_0$ is the initial perturbation amplitude; $v_{{s}}$, $v_{{t}}$ and $v_{{f}}$ are the velocities of the incident shock, the transmitted shock and the front of the single-mode reflected rarefaction waves during the interaction of the incident shock with the SF$_6$–air interface; $\Delta u$ ($\Delta u_{{r}}$) and $\Delta u_{1}$ are the jump velocity of the interface induced by the incident shock (rarefaction waves) and the heavy-fluid velocity caused by the incident shock; $a_{{r}}^-$ ($a_{{r}}^+$) is the perturbation amplitude just before (after) the rarefaction waves impact; and $v_{{rf}}$ ($v_{{rt}}$) is the velocity of the rarefaction waves front (tail) relative to the gas before the rarefaction waves.

To accurately predict $V_{{i}}^{{0}}$, the irrotational model proposed by Wouchuk & Nishihara (Reference Wouchuk and Nishihara1997) (the WN model) is used, which can be expressed as

(2.3)\begin{equation} V_{{i}}^{{0}}=ka_0\frac{\rho_{2}^+ \Delta u\left(1-\dfrac{v_{{{t}}}}{v_{{{s}}}}\right) +\rho_{1}^+(\Delta u_{1} -\Delta u)\left(1+\dfrac{v_{{{f}}}}{v_{{{t}}}}\right)}{\rho_{1}^+ + \rho_{2}^+}. \end{equation}

Here $a_0$ is the initial amplitude of the perturbation; $v_{{s}}$, $v_{{t}}$ and $v_{{f}}$ are the velocities of the incident shock, the transmitted shock and the front of the single-mode reflected rarefaction waves during the interaction of the incident shock with the SF$_6$–air interface; and $\Delta u$ and $\Delta u_{1}$ are the jump velocity of the interface induced by the incident shock and the heavy-fluid velocity caused by the incident shock, respectively. These parameters in (2.3) can be calculated using one-dimensional (1-D) gas dynamics theory by providing the initial parameters. Through the ZG model, the perturbation amplitude just before the arrival of the front of planar reflected rarefaction waves can be calculated, i.e. $a_{{r}}^{-}=a_0C_1+\int _{0}^{\Delta t} V_{{i}}^{{{ZG}}}(t)\,{\rm {d}}t$, in which $C_1=1-\Delta u/v_{{s}}$ is the shock compression factor (Meshkov Reference Meshkov1969) and $\Delta t$ is the time interval between impacts of the incident shock and the planar rarefaction waves.

After the planar reflected rarefaction waves impact the perturbed air–SF$_6$ interface, reflected and transmitted rarefaction waves are generated, as shown in figure 1(d), and the perturbation amplitude grows linearly in the RM instability flow. Note that the WN model is not appropriate to predict the growth rate induced by the rarefaction waves because it was constructed based on the fact that the transmitted wave is a shock.

In this work, the modified impulsive model proposed by Vandenboomgaerde, Mügler & Gauthier (Reference Vandenboomgaerde, Mügler and Gauthier1998) (the Van model) is used to accurately predict the linear growth rate ($V_{{r}}$) of a single-mode heavy–light perturbation accelerated by rarefaction waves (Zhou et al. Reference Zhou2021), and the Van model can be expressed as

(2.4)\begin{equation} V_{{r}}={-}k\frac{a_{{r}}^-A^+ + a_{{r}}^+A^r}{2}\Delta u_{{r}}. \end{equation}

Here $\Delta u_{{r}}$ is the interface velocity jump induced by the rarefaction waves; and $a_{{r}}^+$ ($A^{{r}}$) is the perturbation amplitude (Atwood number) just after the rarefaction waves collide with the shocked interface. The perturbation amplitude can be described as $a_{{r}}^+=R a_{{r}}^-$, with $R=1+\Delta u_{{r}}/(v_{{rf}}+v_{{rt}})$ being the rarefaction factor and $v_{{rf}}$ ($v_{{rt}}$) being the velocity of the rarefaction waves front (tail) relative to the gas before the rarefaction waves. By solving the 1-D gas dynamics equations after providing the intensities of the planar shock and rarefaction waves and the initial gas parameters, the parameters in (2.4) can be calculated.

According to the theoretical analysis, $V_2$ can be accurately predicted if the initial parameters are provided. There are seven possibilities for the perturbation development after the rarefaction waves impact, as presented in table 1, and the details of these possibilities are presented as follows. For convenient discussion, we assume $a_0>0$, and therefore $V_{{i}}^0<0$ and $V_{{i}}<0$.

Table 1. The classification of seven possibilities.

Possibility I ($V_2< V_{{i}}<0$): The impact of rarefaction waves occurs before the phase reversal of the perturbation is completed. The perturbation growth induced by the rarefaction waves ($V_{{r}}$) has the same direction as that induced by the shock ($V_{{i}}$). Thus, $V_2$ and $V_{{i}}$ have the same sign and the rarefaction waves impact accelerates the perturbation growth.

Possibility II ($V_2=V_{{i}}<0$): The rarefaction waves reach the balanced position of the shocked interface at the moment when the phase reversal is just finished, i.e. the rarefaction waves impact a flat interface ($a_{{r}}^-=0$). Under the hypotheses above (weak rarefaction waves and small perturbations), the density field near the interface before and after the rarefaction waves impact can be approximately regarded as uniform. Consequently, the rarefaction waves have no effect on the perturbation growth ($V_{{r}}=0$). This specific condition is called the ‘acceleration line’ in this work.

Possibility III ($V_{{i}}< V_2<0$): The rarefaction waves impact occurs when the phase reversal has finished, i.e. $a_{{r}}^-<0$, and $V_{{r}}$ has the opposite direction to $V_{{i}}$. However, $a_{{r}}^-$ is small, and $\lvert V_{{r}} \rvert < \lvert V_{{i}} \rvert$. After the rarefaction waves impact, the perturbation growth rate is attenuated but the perturbation amplitude continues to grow in the same direction as the interface before rarefaction waves impact.

Possibility IV ($V_{{i}}< V_2=0$): $V_{{r}}$ and $V_{{i}}$ have the same magnitudes but different directions, and they almost offset each other. After the rarefaction waves impact, the velocity field in the vicinity of the interface is nearly uniform, and freeze-out of amplitude growth is realized. This specific condition is called the ‘freeze-out line’ in this work.

Possibility V ($-V_{{i}}>V_2>0$): In this situation, $a_{{r}}^-$ is high enough, and $V_{{r}}$ has a slightly larger magnitude than $V_{{i}}$ but the opposite direction to $V_{{i}}$. After the impact of rarefaction waves, the perturbation growth rate is weakened ($V_2<-V_{{i}}$), and the perturbation amplitude first decreases with a smaller rate than that before the rarefaction waves impact. After the second phase reversal is finished, the perturbation amplitude continues to grow and has the same phase as the initial amplitude ($a_0$).

Possibility VI ($-V_{{i}}=V_2>0$): Here, $V_{{r}}$ is twice $V_{{i}}$ in magnitude. Thus, $V_2$ has the same magnitude as $V_{{i}}$ but the opposite direction to $V_{{i}}$. Although the rarefaction waves impact fails to attenuate the perturbation growth rate, the perturbation amplitude decreases first in time with the same rate as that before the rarefaction waves impact. This specific condition is called the ‘reversal acceleration line’ in this work.

Possibility VII ($V_2>-V_{{i}}>0$): $V_{{r}}$ is more than twice $V_{{i}}$ in magnitude. The perturbation amplitude decreases in time until the second phase reversal occurs. The rarefaction waves impact accelerates the perturbation growth but reverses the growth direction.

3. Experimental method

In this work, a planar air–helium gas interface is used to produce weak reflected rarefaction waves. As shown in figure 2(a,b), there are two interfaces, a perturbed one and a planar one. The single-mode perturbed interface (II) separates air (in space B) from SF$_6$ (in space A and driven section), and the planar interface (AI) separates air (in space B) from helium (in space C). The distance between II and AI is defined as $L_0$, which has a linear relationship with $\Delta t$ when the other initial parameters are fixed. The linear relationship between $L_0$ and $\Delta t$ can be solved through 1-D gas dynamics equations. The determination of $L_0$ is important, because a smaller (larger) $L_0$ will result in a smaller (larger) amplitude of the interface at the arrival of the rarefaction waves and consequently a smaller (larger) amplitude growth rate induced by the rarefaction waves. In other words, the amplitude growth rate induced by the rarefaction waves can be manipulated through changing $L_0$, and different attenuation behaviours may be achieved.

Figure 2. Schematics of the soap-film interface generation (a) and initial configuration studied (b). Here AI is the auxiliary air–helium interface; II is the initial SF$_6$–air interface; IS is the incident shock; and $L_0$ is the initial distance between the average positions of II and AI.

The soap-film technique (Liu et al. Reference Liu, Liang, Ding, Liu and Luo2018) is used to create the initial perturbed and planar interfaces. After the soap-film interfaces are formed, SF$_6$ is pumped into the driven section and space A, and helium is pumped into space C. For all experimental runs, the inflation rate and duration are the same to ensure similar volume fractions of SF$_6$ and helium in the spaces as far as possible. Note that the value of $L_0$ will alter the volume of space C. In experiments, the inflation rate and duration are determined to ensure the helium concentration of about 100 % when the volume of space C is the largest. However, because helium diffuses much faster, its concentration cannot be 100 % when the incident shock impacts. The gas concentration is determined by comparing the velocities of the incident shock and the transmitted shock, and the interface velocity jump measured from experiments, with those predicted from 1-D gas dynamics theory.

The experiments are conducted in a horizontal shock tube (Liu et al. Reference Liu, Liang, Ding, Liu and Luo2018; Guo et al. Reference Guo, Cong, Si and Luo2022), and the Mach number of the incident planar shock moving in SF$_6$ is $1.37\pm 0.01$. The post-shock flow field is recorded by high-speed schlieren photography. The frame rate of the high-speed video camera (FASTCAM SA-Z, Photron Ltd) is 50 400 frames per second and the exposure time is $0.36~\mathrm {\mu }{\rm s}$. The spatial resolution of the schlieren image is 0.25 mm pixel$^{-1}$. The ambient pressure and temperature are $101.3\pm 0.1$ kPa and $295\pm 1.5~{\rm K}$.

4. Results and discussion

4.1. Undisturbed case

The developments of the undisturbed II after shock and rarefaction waves impacts are investigated first, and the experimental schlieren images with $L_0$=144 mm are presented in figure 3(a). The initial time is defined as the moment when the incident shock (IS) meets II, and similarly hereinafter. As IS impinges upon II, a transmitted shock wave (TS) and a shocked SF$_6$–air interface (SI) are formed (96 $\mathrm {\mu }$s). Then TS impacts the auxiliary air–helium interface (AI), which produces a shocked air–helium interface (SAI) and planar rarefaction waves moving upstream (394 $\mathrm {\mu }$s). Note that the rarefaction waves in air cannot be captured due to their weak intensity. After the rarefaction waves impact SI, transmitted rarefaction waves (TRW) moving in SF$_6$ and the interface RSI are generated (632 $\mathrm {\mu }$s). Subsequently, RSI moves downstream (969 $\mathrm {\mu }$s). Note that, due to the size limitation of the observation window, the developments of these two interfaces cannot be captured simultaneously by the camera during the whole experimental duration, and only the developments of the perturbed SF$_6$–air interface are highlighted hereinafter.

Figure 3. Evolution of an undisturbed SF$_6$–air interface accelerated by a plane shock and rarefaction waves (a) and the trajectories of the interface and waves (b). Here SI is the shocked SF$_6$–air interface; SAI is the shocked auxiliary air–helium interface; TS is the transmitted shock; RSI is the interface after rarefaction waves impact; TRW is the transmitted rarefaction waves; and $x$ is the distance of the evolving interface from the initial position of II. The symbols (lines) represent the experimental (theoretical) results.

The trajectories of the shock waves and the two interfaces extracted from the experimental schlieren images are shown in figure 3(b). Three experimental runs are performed, and the interface trajectories for these runs are nearly the same. According to the parameters in table 2, the theoretical trajectories of the shock waves and interfaces are also plotted for comparison. Good agreement between experiments and predictions is achieved, verifying the good repeatability and reliability of the experiments. As a result, the parameters in table 2 are considered as the initial parameters in the following experiments. Based on the parameters in table 2, the relationship between $L_0$ (mm) and $\Delta t$ ($\mathrm {\mu }$s) can be described as $L_0=0.237\Delta t$.

Table 2. Experimental parameters: $M_s$ is the incident shock Mach number; $\varphi$(SF$_6$), $\varphi$(air) and $\varphi$(helium) are the volume fractions of SF$_6$ in space A, air in space B and helium in space C, respectively; $A^+$ and $A^{{r}}$ are the post-shock and post-rarefaction waves Atwood numbers; and $\Delta u_{{aui}}$ is the jump velocity of the air–helium interface induced by the transmitted shock. The unit of velocity is m s$^{-1}$.

In the following studies, we focus on the realization of the perturbation growth attenuation (possibilities III–V). Three kinds of single-mode SF$_6$–air interfaces with different $\lambda$ are considered. According to the experimental parameters in undisturbed runs, five different $L_0$, as presented in table 3, are designed to realize different attenuations of the perturbation growth. Three experiments (cases 1–3) are performed by changing $L_0$ to verify different possibilities of the perturbation growth attenuation for the same initial interface condition, and two additional experiments (cases 4 and 5) are performed to achieve freeze-out of the perturbation with different initial interface conditions.

Table 3. Interface parameters and $L_0$ in perturbed cases. Here $k$ and $\lambda$ are the perturbation wavenumber and wavelength; and $V_{{i}}$ is the growth rate of amplitude just before the reflected rarefaction waves arrival. The superscripts ‘$t$’ and ‘$e$’ denote theoretical and experimental results.

For each case, at least three successful experimental runs are performed to ensure the repeatability of experiments. The velocities of the incident shock ($226.2 \pm 1.0$ m s$^{-1}$), the transmitted shock ($431.2 \pm 1.0$ m s$^{-1}$) and the auxiliary air–helium interface ($158.7 \pm 1.0$ m s$^{-1}$) for the different cases are nearly the same. Based on the 1-D gas dynamics theory, the duration of the rarefaction waves interacting with the perturbed interface can be calculated as 13–28 $\mathrm {\mu }$s in different cases, and the jump velocity induced by the rarefaction waves is relatively small ($\Delta u_{{r}} \sim 20$ m s$^{-1}$). Comparing with the previous work on the interaction of the rarefaction waves with a single-mode interface (Liang et al. Reference Liang, Zhai, Luo and Wen2020), it is reasonably assumed that the interaction duration in this work is short enough to ignore the RT instability caused by the rarefaction waves.

4.2. Single-mode cases

When the initial experimental parameters and shock intensity are fixed, the initial interface shape and $L_0$ can determine the possibilities of the perturbation growth. In this work, the initial dimensionless amplitude $ka_0$ is 0.1 and remains constant. The different possibilities of attenuation are achieved through varying $\lambda$ and $L_0$. Note that changing $\lambda$ instead of $ka_0$ is more convenient and effective. For example, when $\lambda =40$ mm and $ka_0=0.1$, $L_0$ is calculated to be about 109 mm to achieve freeze-out of RSI perturbation. If $\lambda$ is changed to 30 mm while $ka_0=0.1$ remains fixed, $L_0$ becomes 82 mm for achieving freeze-out. However, if $ka_0$ is changed to 0.2 while $\lambda$ is fixed as 40 mm, $L_0$ is about 105 mm for achieving freeze-out.

Figure 4 shows the distributions of the perturbation growth possibilities after the reflected rarefaction waves impact in the ($\lambda, L_0$) domain. As analysed in § 2, seven different possibilities are classified by three specific lines. In the following studies, we first fix $\lambda$ as 40 mm but change $L_0$ (cases 1–3 in table 3) to achieve three possibilities (III–V). Then, two additional cases (cases 4 and 5 in table 3) with different $\lambda$ are chosen to verify that the model proposed can accurately predict the freeze-out conditions (possibility IV). The distributions of these five cases in the ($\lambda, L_0$) domain are shown in figure 4.

Figure 4. Distributions of seven possibilities of the perturbation growth after the impact of reflected rarefaction waves in the ($\lambda$, $L_0$) domain.

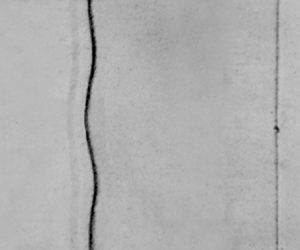
Typical schlieren images of the SF$_6$–air interfaces accelerated by the incident shock and the reflected rarefaction waves for cases 1–5 are provided in figure 5. Taking case 1 as an example, when IS interacts with II, a transmitted shock (TS) and reflected single-mode rarefaction waves (RW$_1$) are generated (87 $\mathrm {\mu }$s). The shocked II (SI) moves downstream and phase reversal occurs. Because the amplitude of II is small, TS quickly recovers to a planar shock. Subsequently, TS impacts AI, generating a transmitted shock moving in helium and reflected rarefaction waves moving in air. These waves are invisible in air due to their weak intensities (326 $\mathrm {\mu }$s). After the rarefaction waves collide with SI, transmitted rarefaction waves (TRW) moving in SF$_6$ can be observed (365 $\mathrm {\mu }$s), and the perturbation amplitude of RSI grows continuously (544–1079 $\mathrm {\mu }$s). In case 2, after the rarefaction waves impact, it is clear that the perturbation amplitude of RSI reduces (694–1190 $\mathrm {\mu }$s). In cases 3–5, after the rarefaction waves impact, the perturbation amplitudes of RSI are almost unchanged, and freeze-out is achieved.

Figure 5. Typical schlieren images showing the interface evolution and wave patterns before and after the impact of rarefaction waves for cases 1–5.

The temporal variations of the dimensionless amplitude for cases before and after the impact of rarefaction waves are plotted in figure 6(a). The time is normalized as $\tau =kV_0^{{e}}(t-t^*)$, where $V_0^e$ is the experimental linear growth rate of the SI amplitude and $t^*$ is the time when the linear growth of the SI amplitude starts (compression phase ends). The growth rate $V_0^{{e}}$ is $5.01\pm 0.12$ m s$^{-1}$ for all cases in this work and $V_{{i}}^0$ is calculated through the WN model to be 5.05 m s$^{-1}$. The amplitude is scaled as $\alpha =k(a-a^*)$, where $a^*$ is the amplitude of SI at $t=t^*$, which differs from the initial amplitude. As shown in figure 6(a), before the rarefaction waves impact, the data for different cases collapse well. The amplitude growth rates before the rarefaction waves can be accurately predicted by the ZG model (Zhang & Guo Reference Zhang and Guo2016), as shown in table 3.

Figure 6. (a) Temporal variations of the dimensionless perturbation amplitude before and after the rarefaction waves impact for cases 1–5. (b) Zoomed-in image showing the stretching effect of the rarefaction waves, as represented by the solid lines.

After the rarefaction waves impact, the interface experiences a rarefaction process, and the amplitude of RSI first increases rapidly for a short time. To clearly show the stretching effect of the rarefaction waves, the results shortly before and after the rarefaction waves impact are zoomed in, as indicated in figure 6(b), in which the stretching effect of the rarefaction waves is represented by solid lines. Then after the start-up process (Lombardini & Pullin Reference Lombardini and Pullin2009), the amplitude growth is attenuated in all cases. In case 1, the amplitude of RSI continues to grow but its growth rate ($V_2^{{t}}=-1.44$ m s$^{-1}$ and $V_2^{{e}}=-1.41\pm 0.04$ m s$^{-1}$, where the superscripts ‘$t$’ and ‘$e$’ denote theoretical and experimental results) is smaller than the counterparts just before the rarefaction waves impact ($V_{{i}}^{{t}}=-4.11$ m s$^{-1}$ and $V_{{i}}^{{e}}=-4.23\pm 0.13$ m s$^{-1}$). In case 2, before the second phase reversal is finished, the amplitude of RSI decreases with a smaller rate ($V_2^{{t}}=1.68$ m s$^{-1}$ and $V_2^{{e}}=1.61\pm 0.05$ m s$^{-1}$) than $V_{{i}}$ ($V_{{i}}^{{t}}=-3.77$ m s$^{-1}$ and $V_{{i}}^{{e}}=-3.75\pm 0.13$ m s$^{-1}$). The linear growth rates after the rarefaction waves impact in these two cases are well predicted by the Van model, as given in figure 6(a). In cases 3–5, the amplitude growth of RSI almost stagnates, and freeze-out of amplitude growth of single-mode SF$_6$–air perturbations with different wavelengths is realized in shock-tube experiments.

In summary, attenuation and even freeze-out of amplitude growth of a shocked single-mode SF$_6$–air interface can be realized through the second impact by reflected rarefaction waves, and the relationship among initial parameters for attenuating the amplitude growth can be accurately predicted by theoretical models.

5. Conclusions

Attenuation and freeze-out of amplitude growth of a shocked single-mode SF$_6$–air interface is first realized through the impact of reflected rarefaction waves both theoretically and experimentally.

Theoretically, the ZG model (Zhang & Guo Reference Zhang and Guo2016) is used to predict the amplitude growth before the rarefaction waves impact and the Van model (Vandenboomgaerde et al. Reference Vandenboomgaerde, Mügler and Gauthier1998) to predict perturbation growth induced by the rarefaction waves. Based on the linear superposition principle, seven possibilities of perturbation growth are classified. It is found that the reflected rarefaction waves can enhance, attenuate and even freeze the interfacial instability. The possibility can be flexibly changed through varying the time interval between the two impacts and the perturbation wavelength by fixing other initial parameters.

Experimentally, a planar air–helium interface is used to produce the reflected rarefaction waves, and the soap-film technique is used to create the initially perturbed and undisturbed interfaces. Five experiments with different initial conditions are carried out, and the schlieren images show that, after the reflected rarefaction waves impact, the amplitude growth of single-mode heavy–light perturbation can be weakened or frozen-out, as accurately predicted by models.

These findings may be helpful for better understanding how to suppress hydrodynamic instabilities in ICF. Note that this work only considers the manipulation of single-mode interface perturbation growth. In a following work, the manipulation of a multimode interface perturbation growth, which is more desirable in ICF, will be considered.

Funding

This work was supported by the National Natural Science Foundation of China (nos 12022201, 91952205 and 12102425) and Youth Innovation Promotion Association CAS.

Declaration of interests

The authors report no conflict of interest.

References

Charakhch'yan, A.A. 2000 Richtmyer–Meshkov instability of an interface between two media due to passage of two successive shocks. J. Appl. Mech. Tech. Phys. 41, 2331.CrossRefGoogle Scholar
Charakhch'yan, A.A. 2001 Reshocking at the non-linear stage of Richtmyer–Meshkov instability. Plasma Phys. Control. Fusion 43, 11691179.CrossRefGoogle Scholar
Chen, C., Xing, Y., Wang, H., Zhai, Z. & Luo, X. 2023 Freeze-out of perturbation growth of single-mode helium-air interface through reflected shock in Richtmyer–Meshkov flows. J. Fluid Mech. 956, R2.CrossRefGoogle Scholar
Guo, X., Cong, Z., Si, T. & Luo, X. 2022 Shock-tube studies of single- and quasi-single-mode perturbation growth in Richtmyer–Meshkov flows with reshock. J. Fluid Mech. 941, A65.CrossRefGoogle Scholar
Liang, Y., Zhai, Z., Luo, X. & Wen, C. 2020 Interfacial instability at a heavy/light interface induced by rarefaction waves. J. Fluid Mech. 885, A42.CrossRefGoogle Scholar
Lindl, J., Landen, O., Edwards, J., Moses, E. & NIC team 2014 Review of the national ignition campaign 2009–2012. Phys. Plasmas 21, 020501.CrossRefGoogle Scholar
Liu, L., Liang, Y., Ding, J., Liu, N. & Luo, X. 2018 An elaborate experiment on the single-mode Richtmyer–Meshkov instability. J. Fluid Mech. 853, R2.CrossRefGoogle Scholar
Lombardini, M. & Pullin, D.I. 2009 Startup process in the Richtmyer–Meshkov instability. Phys. Fluids 21, 044104.CrossRefGoogle Scholar
Meshkov, E.E. 1969 Instability of the interface of two gases accelerated by a shock wave. Fluid Dyn. 4, 101104.CrossRefGoogle Scholar
Meyer, K.A. & Blewett, P.J. 1972 Numerical investigation of the stability of a shock-accelerated interface between two fluids. Phys. Fluids 15, 753759.CrossRefGoogle Scholar
Mikaelian, K.O. 1985 Richtmyer–Meshkov instabilities in stratified fluids. Phys. Rev. A 31, 410419.CrossRefGoogle ScholarPubMed
Mikaelian, K.O. 2010 Analytic approach to nonlinear hydrodynamic instabilities driven by time-dependent accelerations. Phys. Rev. E 81, 016325.CrossRefGoogle ScholarPubMed
Morgan, R.V., Cabot, W.H., Greenough, J.A. & Jacobs, J.W. 2018 Rarefaction-driven Rayleigh–Taylor instability. Part 2. Experiments and simulations in the nonlinear regime. J. Fluid Mech. 838, 320355.CrossRefGoogle Scholar
Morgan, R.V., Likhachev, O.A. & Jacobs, J.W. 2016 Rarefaction-driven Rayleigh–Taylor instability. Part 1. Diffuse-interface linear stability measurements and theory. J. Fluid Mech. 791, 3460.CrossRefGoogle Scholar
Rayleigh, Lord 1883 Investigation of the character of the equilibrium of an incompressible heavy fluid of variable density. Proc. Lond. Math. Soc. 14, 170177.Google Scholar
Richtmyer, R.D. 1960 Taylor instability in shock acceleration of compressible fluids. Commun. Pure Appl. Maths 13, 297319.CrossRefGoogle Scholar
Taylor, G. 1950 The instability of liquid surfaces when accelerated in a direction perpendicular to their planes. I. Proc. R. Soc. Lond. A 201, 192196.Google Scholar
Vandenboomgaerde, M., Mügler, C. & Gauthier, S. 1998 Impulsive model for the Richtmyer–Meshkov instability. Phys. Rev. E 58, 18741882.CrossRefGoogle Scholar
Wouchuk, J.G. & Nishihara, K. 1997 Asymptotic growth in the linear Richtmyer–Meshkov instability. Phys. Plasmas 4, 10281038.CrossRefGoogle Scholar
Zhang, Q. & Guo, W. 2016 Universality of finger growth in two-dimensional Rayleigh–Taylor and Richtmyer–Meshkov instabilities with all density ratios. J. Fluid Mech. 786, 4761.CrossRefGoogle Scholar
Zhou, Y., et al. 2021 Rayleigh–Taylor and Richtmyer–Meshkov instabilities: a journey through scales. Physica D 423, 132838.CrossRefGoogle Scholar
Figure 0

Figure 1. Schematics showing the interaction processes of the incident shock and reflected rarefaction waves with a single-mode SF$_6$–air interface: (a) before and (b) after the incident shock impact; and (c) before and (d) after the reflected rarefaction waves impact. Here $a_0$ is the initial perturbation amplitude; $v_{{s}}$, $v_{{t}}$ and $v_{{f}}$ are the velocities of the incident shock, the transmitted shock and the front of the single-mode reflected rarefaction waves during the interaction of the incident shock with the SF$_6$–air interface; $\Delta u$ ($\Delta u_{{r}}$) and $\Delta u_{1}$ are the jump velocity of the interface induced by the incident shock (rarefaction waves) and the heavy-fluid velocity caused by the incident shock; $a_{{r}}^-$ ($a_{{r}}^+$) is the perturbation amplitude just before (after) the rarefaction waves impact; and $v_{{rf}}$ ($v_{{rt}}$) is the velocity of the rarefaction waves front (tail) relative to the gas before the rarefaction waves.

Figure 1

Table 1. The classification of seven possibilities.

Figure 2

Figure 2. Schematics of the soap-film interface generation (a) and initial configuration studied (b). Here AI is the auxiliary air–helium interface; II is the initial SF$_6$–air interface; IS is the incident shock; and $L_0$ is the initial distance between the average positions of II and AI.

Figure 3

Figure 3. Evolution of an undisturbed SF$_6$–air interface accelerated by a plane shock and rarefaction waves (a) and the trajectories of the interface and waves (b). Here SI is the shocked SF$_6$–air interface; SAI is the shocked auxiliary air–helium interface; TS is the transmitted shock; RSI is the interface after rarefaction waves impact; TRW is the transmitted rarefaction waves; and $x$ is the distance of the evolving interface from the initial position of II. The symbols (lines) represent the experimental (theoretical) results.

Figure 4

Table 2. Experimental parameters: $M_s$ is the incident shock Mach number; $\varphi$(SF$_6$), $\varphi$(air) and $\varphi$(helium) are the volume fractions of SF$_6$ in space A, air in space B and helium in space C, respectively; $A^+$ and $A^{{r}}$ are the post-shock and post-rarefaction waves Atwood numbers; and $\Delta u_{{aui}}$ is the jump velocity of the air–helium interface induced by the transmitted shock. The unit of velocity is m s$^{-1}$.

Figure 5

Table 3. Interface parameters and $L_0$ in perturbed cases. Here $k$ and $\lambda$ are the perturbation wavenumber and wavelength; and $V_{{i}}$ is the growth rate of amplitude just before the reflected rarefaction waves arrival. The superscripts ‘$t$’ and ‘$e$’ denote theoretical and experimental results.

Figure 6

Figure 4. Distributions of seven possibilities of the perturbation growth after the impact of reflected rarefaction waves in the ($\lambda$, $L_0$) domain.

Figure 7

Figure 5. Typical schlieren images showing the interface evolution and wave patterns before and after the impact of rarefaction waves for cases 1–5.

Figure 8

Figure 6. (a) Temporal variations of the dimensionless perturbation amplitude before and after the rarefaction waves impact for cases 1–5. (b) Zoomed-in image showing the stretching effect of the rarefaction waves, as represented by the solid lines.