Article contents
The Development of Industrial Structure in Southern New England
Published online by Cambridge University Press: 03 February 2011
Abstract

- Type
- Notes
- Information
- Copyright
- Copyright © The Economic History Association 1970
References
1 Niemi, Albert W., Jr., “New England: Gross State Product and Productivity, 1948–65” (unpublished doctoral dissertation, University of Connecticut, 1969)Google Scholar.
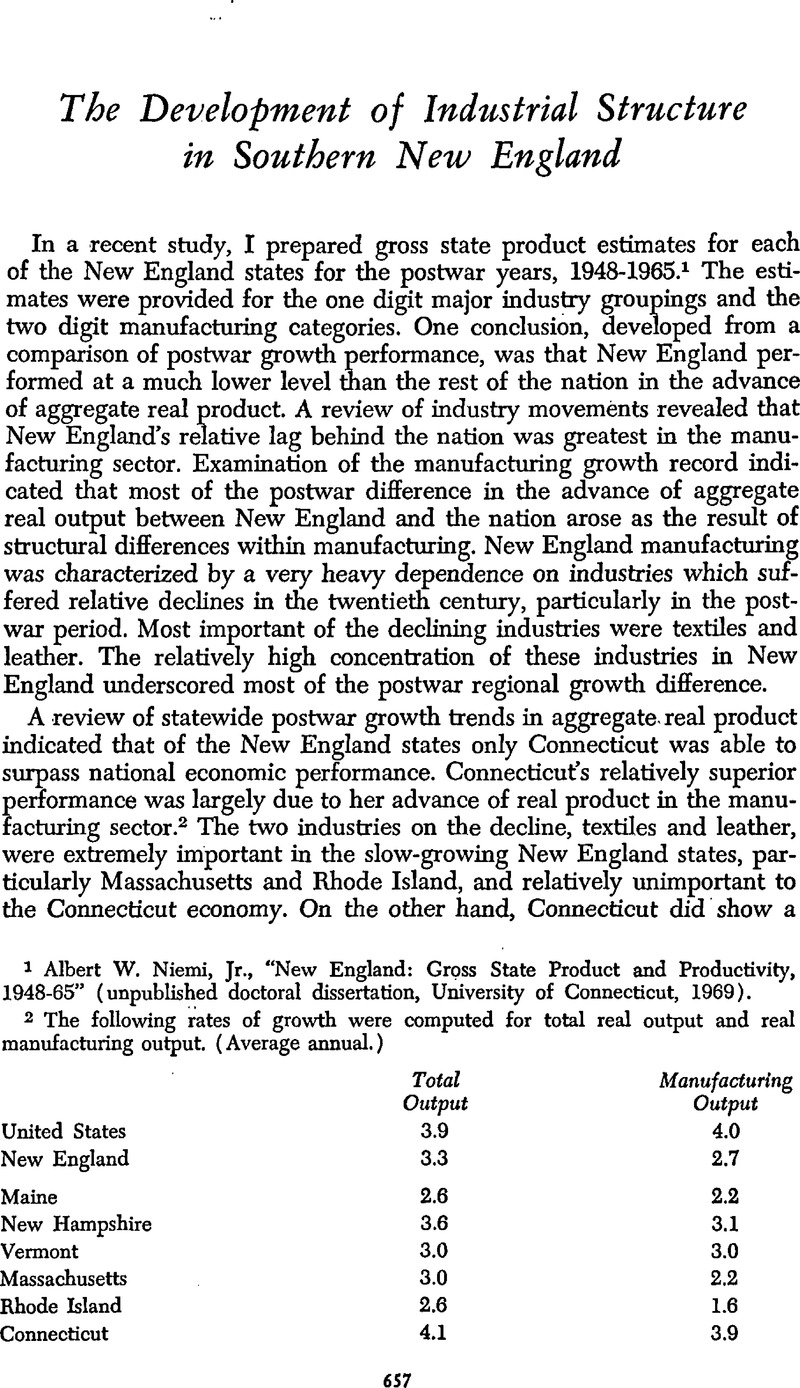
2 The following rates of growth were computed for total real output and real manufacturing output. (Average annual.)

3 Findings from my study indicate large structural differences within southern New England and between New England and the United States.

The structural differences take on added importance in view of the negative growth rates in textiles and leather. The average annual percentage rates of change in real product were as follows: Massachusetts, textiles —3.7 and leather —1.9; Rhode Island, textiles —2.2; and Connecticut, textiles —2.2.
4 The 1860 data were taken from the U.S. Bureau of the Census, Eighth Census of the United States, Manufactures of the United States in 1860, as follows: Massachusetts, pp. 251–57; Rhode Island, pp. 549–51; and Connecticut, pp. 49–52. The industry conversion was made on the basis of the definitions in the 1963 Census of Manufactures, Industry Descriptions, U.S. Department of Commerce.
- 1
- Cited by


