The authors would like to apologise for a mistake in the above-mentioned article by Gonçalves et al. Checking the data, it was found that the position of false-positive and false-negative results were accidently reversed when calculating sensitivity and specificity.
The following errors have been noted:
On the first page, in the abstract:
‘When MC was considered the gold standard for mastitis diagnosis, the calculated diagnostic Se of the MLD was 65·4% (IC95% = 57·4 to 72·8%) and the Sp was 79·3% (IC95% = 71·4 to 85·7%).’
Should read:
‘When MC was considered the gold standard for mastitis diagnosis, the calculated diagnostic Se of the MLD was 78·5% (IC95% = 70·4 to 85·2%) and the Sp was 66·5% (IC95% = 58·6 to 73·7%).’
On page 313, in the second column:
‘When MC was considered the gold standard for mastitis diagnosis, the calculated diagnostic Se of the MLD was 65·4% (IC95% = 57·4 to 72·8%) and the Sp was 79·3% (IC95% = 71·4% to 85·7%). Using MC results as the ‘gold standard,’ Se and Sp of the categorical instrument readout results (healthy or infected) based upon cut-offs ranging from 1–12 are shown in Fig. 2. Sensitivity progressively increased from a minimum of 50·4% at a user setting of 1 to a maximum of 71·3% at a setting of 12 (Fig. 2). Specificity progressively decreased from a maximum of 86·7% at user setting 1 to 66·7% at setting 12 (Fig. 2).’
Should read:
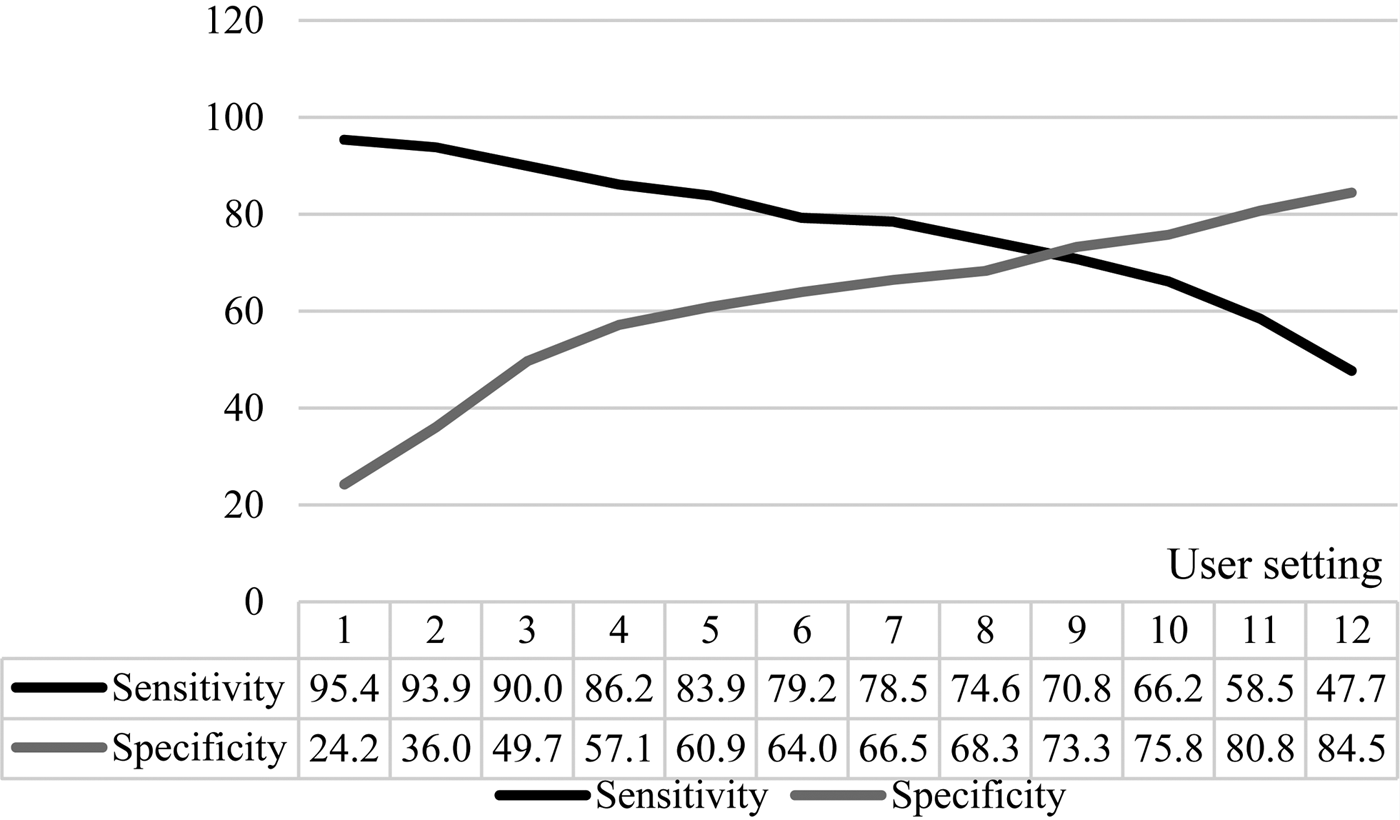
‘When MC was considered the gold standard for mastitis diagnosis, the calculated diagnostic Se of the MLD was 78·5% (IC95% = 70·4 to 85·2%) and the Sp was 66·5% (IC95% = 58·6 to 73·7%). Using MC results as the ‘gold standard,’ Se and Sp of the categorical instrument readout results (healthy or infected) based upon cut-offs ranging from 1–12 are shown in Fig. 2. Sensitivity progressively decreased from a maximum of 95·4% at a user setting of 1 to a minimum of 47·7% at a setting of 12 (Fig. 2). Specificity progressively increased from a minimum of 24·2% at user setting 1 to 84·5% at setting 12 (Fig. 2).’
On page 314, In Figure 2, the sensitivity and specificity results were accidently reversed, since the position of false-positive and false-negative results were mistakenly allocated in the 2 × 2 contingency table used for calculations.
The following is a corrected version of Figure 2:

Fig. 2. Sensitivity and specificity evaluated at different threshold setting of QScout® MLD.
On page 316, in the ‘Discussion’, top of the right column:
‘Our reported Se of 65·4% and Sp of 79·3% were similar to those reported in prior studies. Pilla et al. (2013) reported Se of 73·3% and Sp of 73·6%. Adjustment of user settings from 1 to 12 would allow user optimization of settings. Sensitivities progressively increased from 50·4% at setting 1 to 71·3% at setting 12, while specificities decreased from 86·7% at setting 1 to 66·7% at setting 12 (Fig. 2).’
Should read:
Our reported Se of 78·5% and Sp of 66·5% were similar to those reported in prior studies. Pilla et al. (2013) reported Se of 73·3% and Sp of 73·6%. Adjustment of user settings from 1 to 12 would allow user optimization of settings. Sensitivities progressively decreased from 95·4% at setting 1 to 47·7% at setting 12, while specificities increased from 24·2% at setting 1 to 84·5% at setting 12 (Fig. 2).


