


The published paper contained errors with regards to the placement and numbering of Figures 2–6. The correct Figure and legend combinations are shown below.
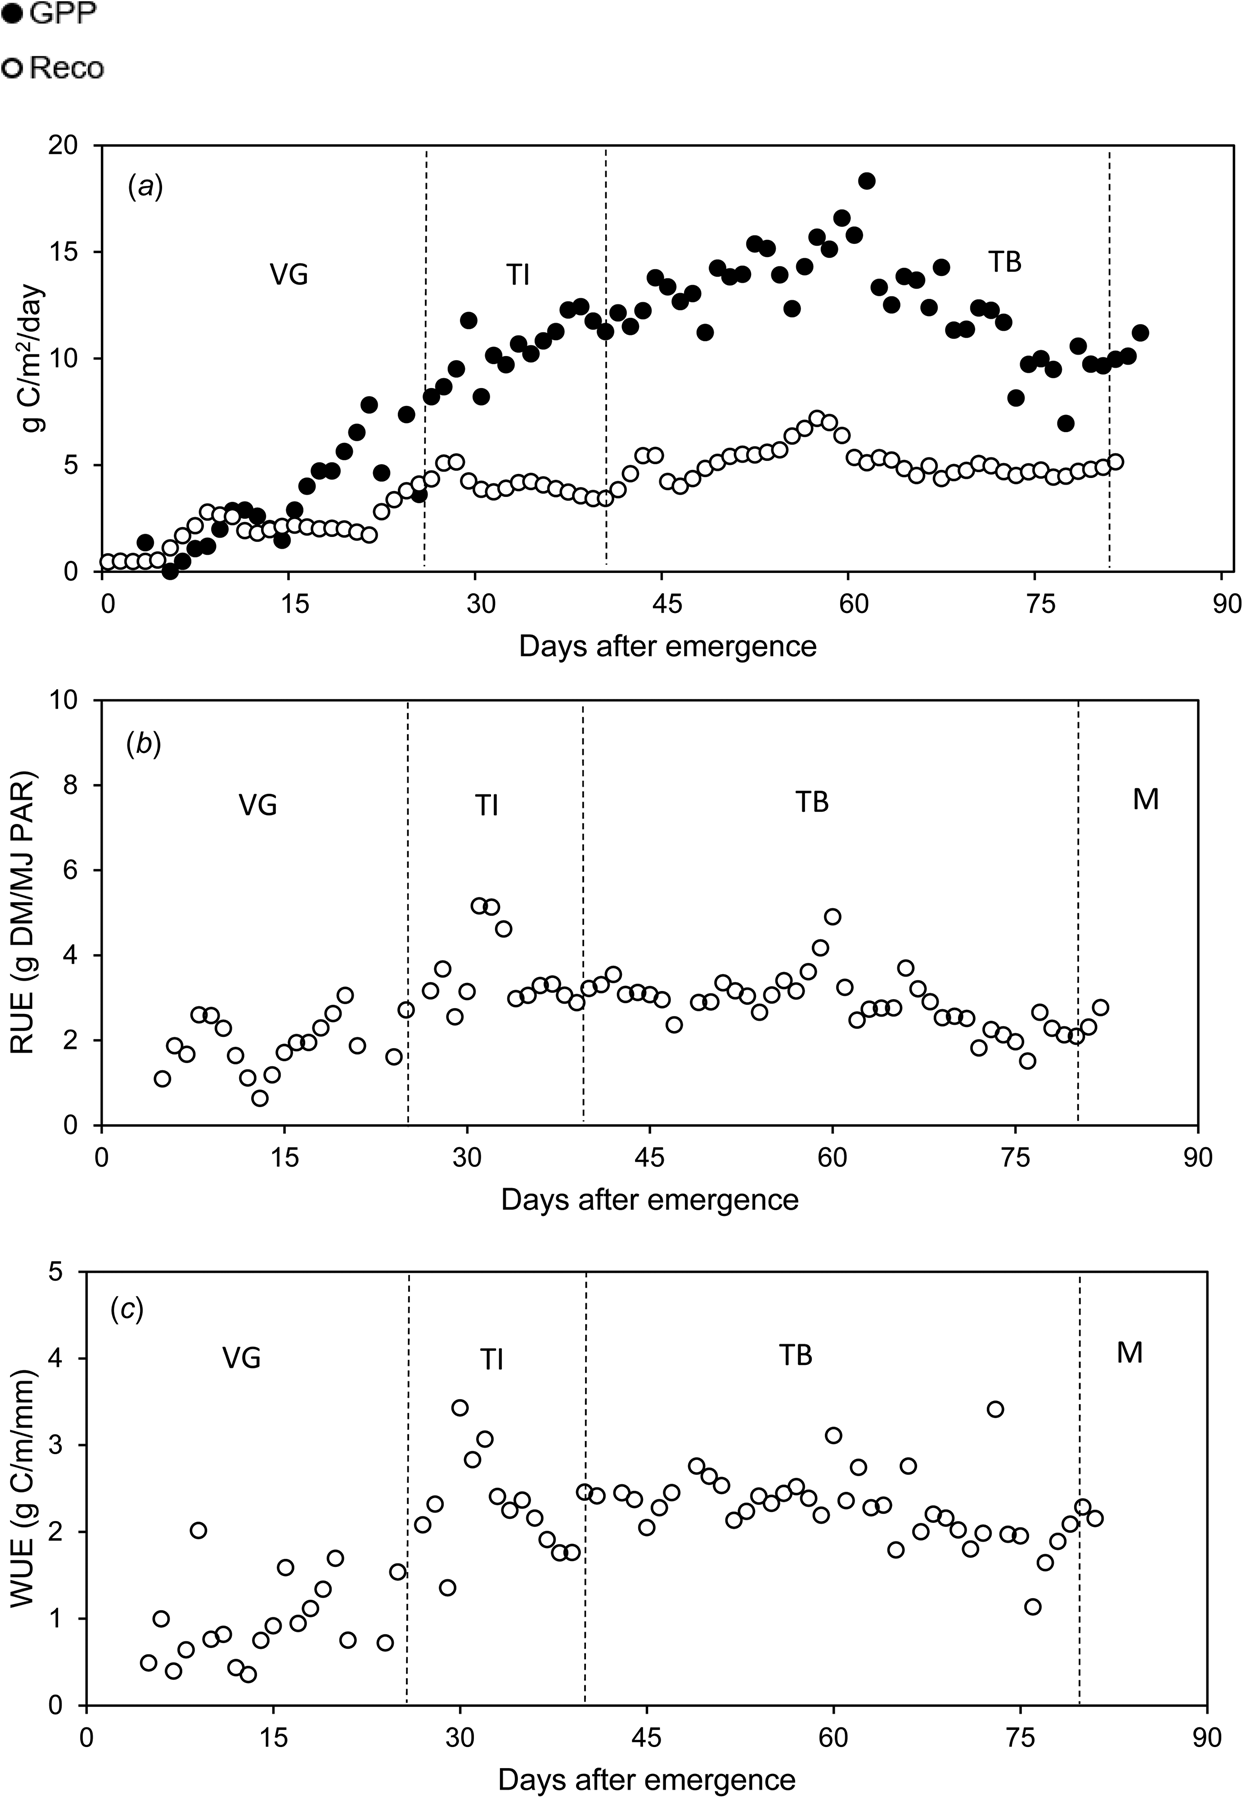
Fig. 2. Seasonal pattern of daily ecosystem respiration (Reco) and gross primary production (GPP) (a), radiation use efficiency (RUE) (b) and water use efficiency (WUE) (c) at Louwna (VG – vegetative growth, TI – tuber initiation, TB – tuber bulking and M – maturation, DM – dry matter, C – carbon, PAR – photosynthetic active radiation).
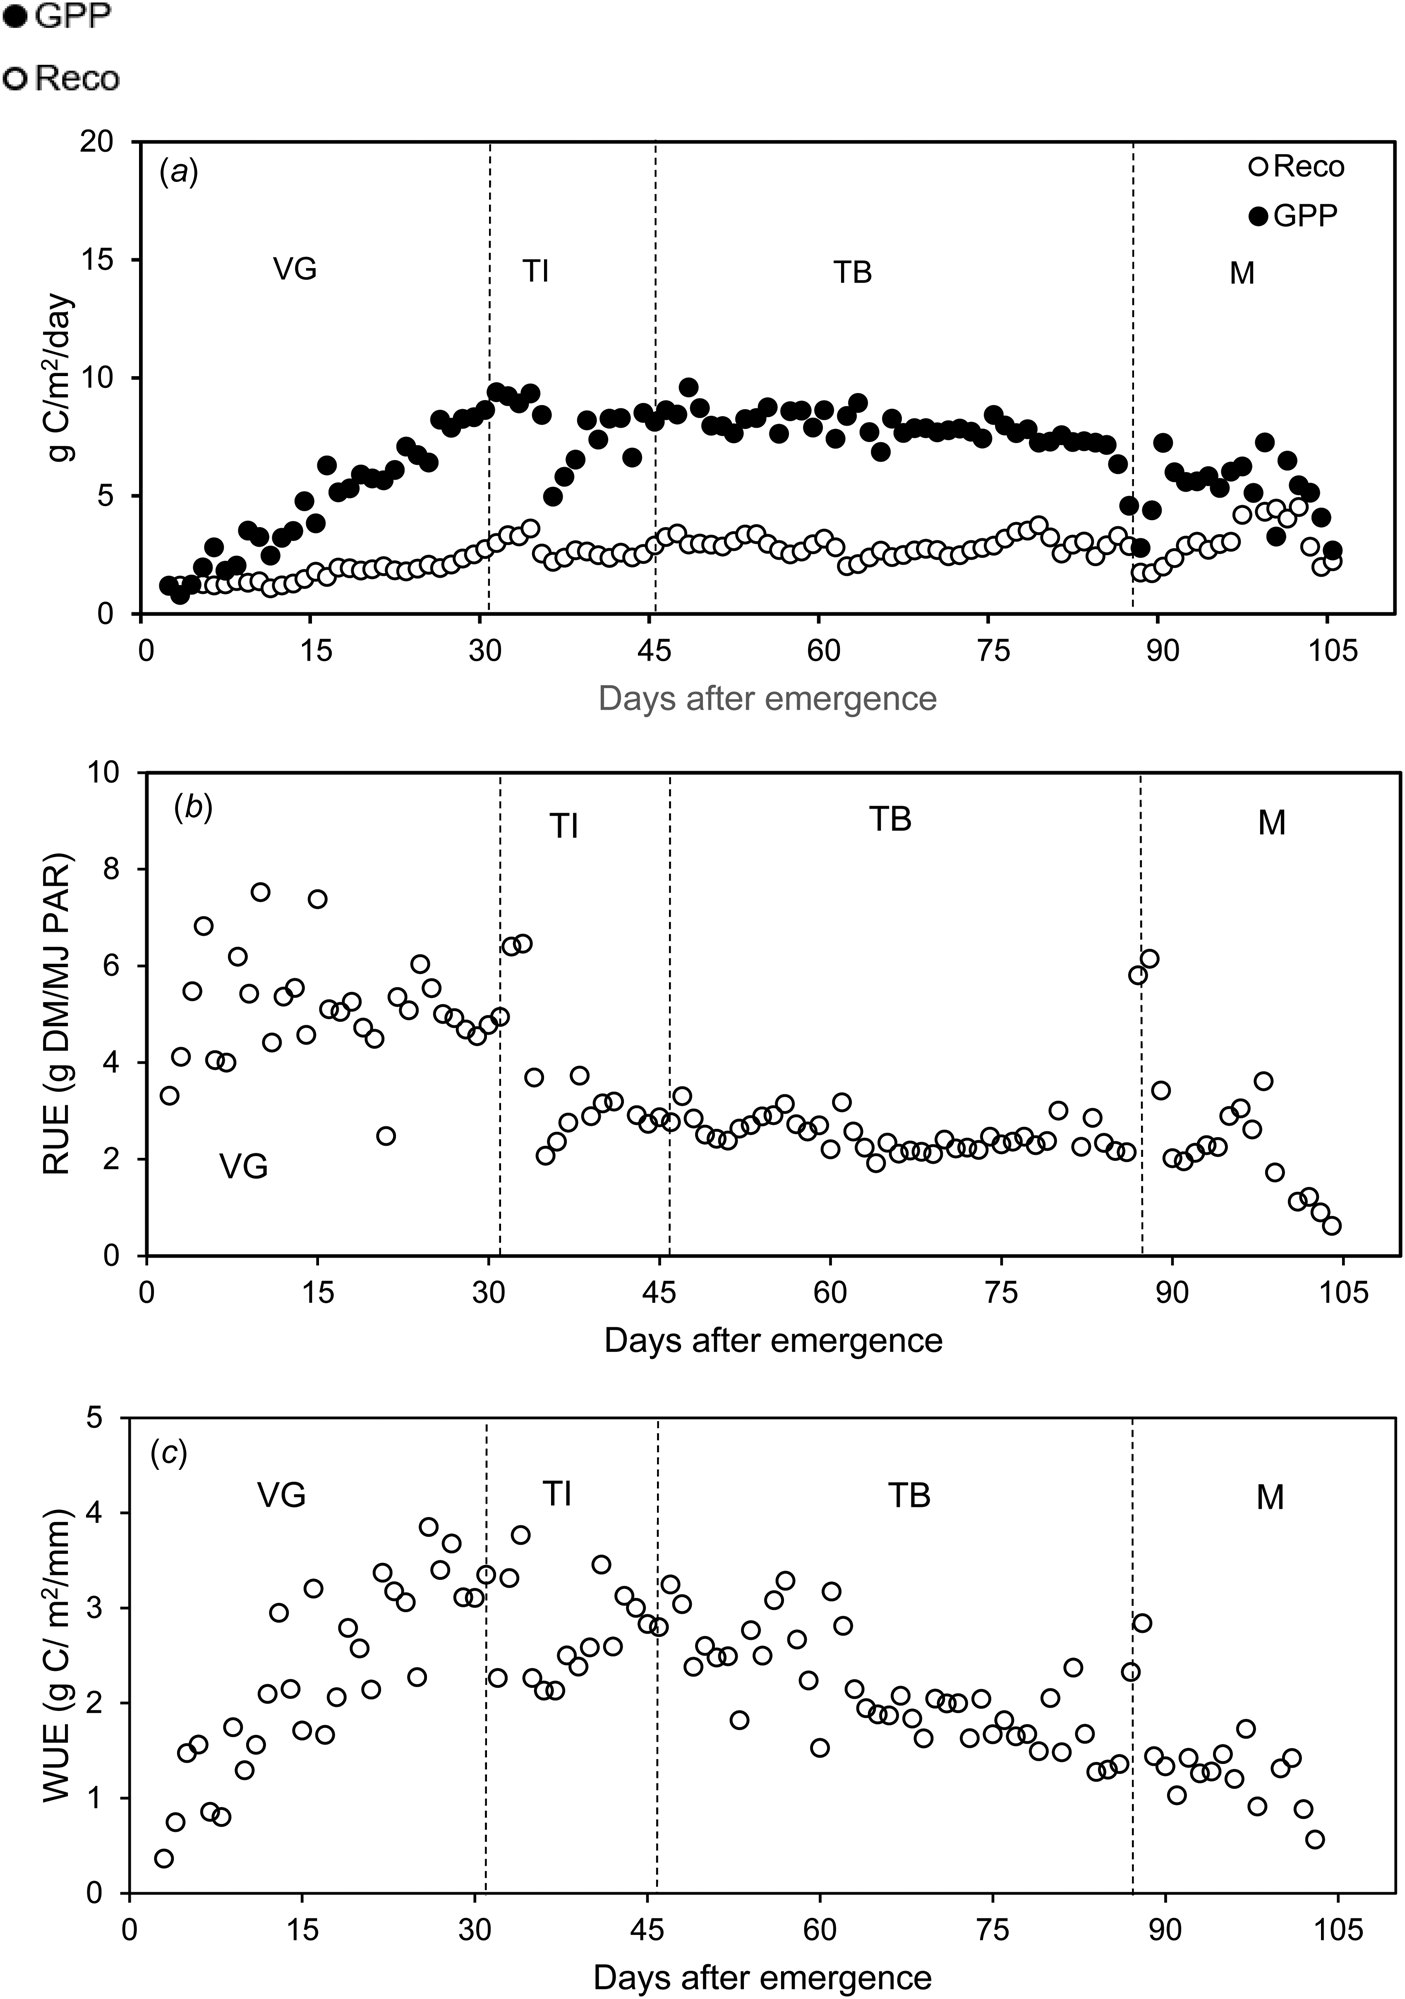
Fig. 3. Seasonal pattern of daily ecosystem respiration (Reco) and gross primary production (GPP) (a), radiation use efficiency (RUE) (b) and water use efficiency (WUE) (c) at Tom Burke (VG – vegetative growth, TI – tuber initiation, TB – tuber bulking and M – maturation, DM – dry matter, C – carbon, PAR – photosynthetic active radiation).
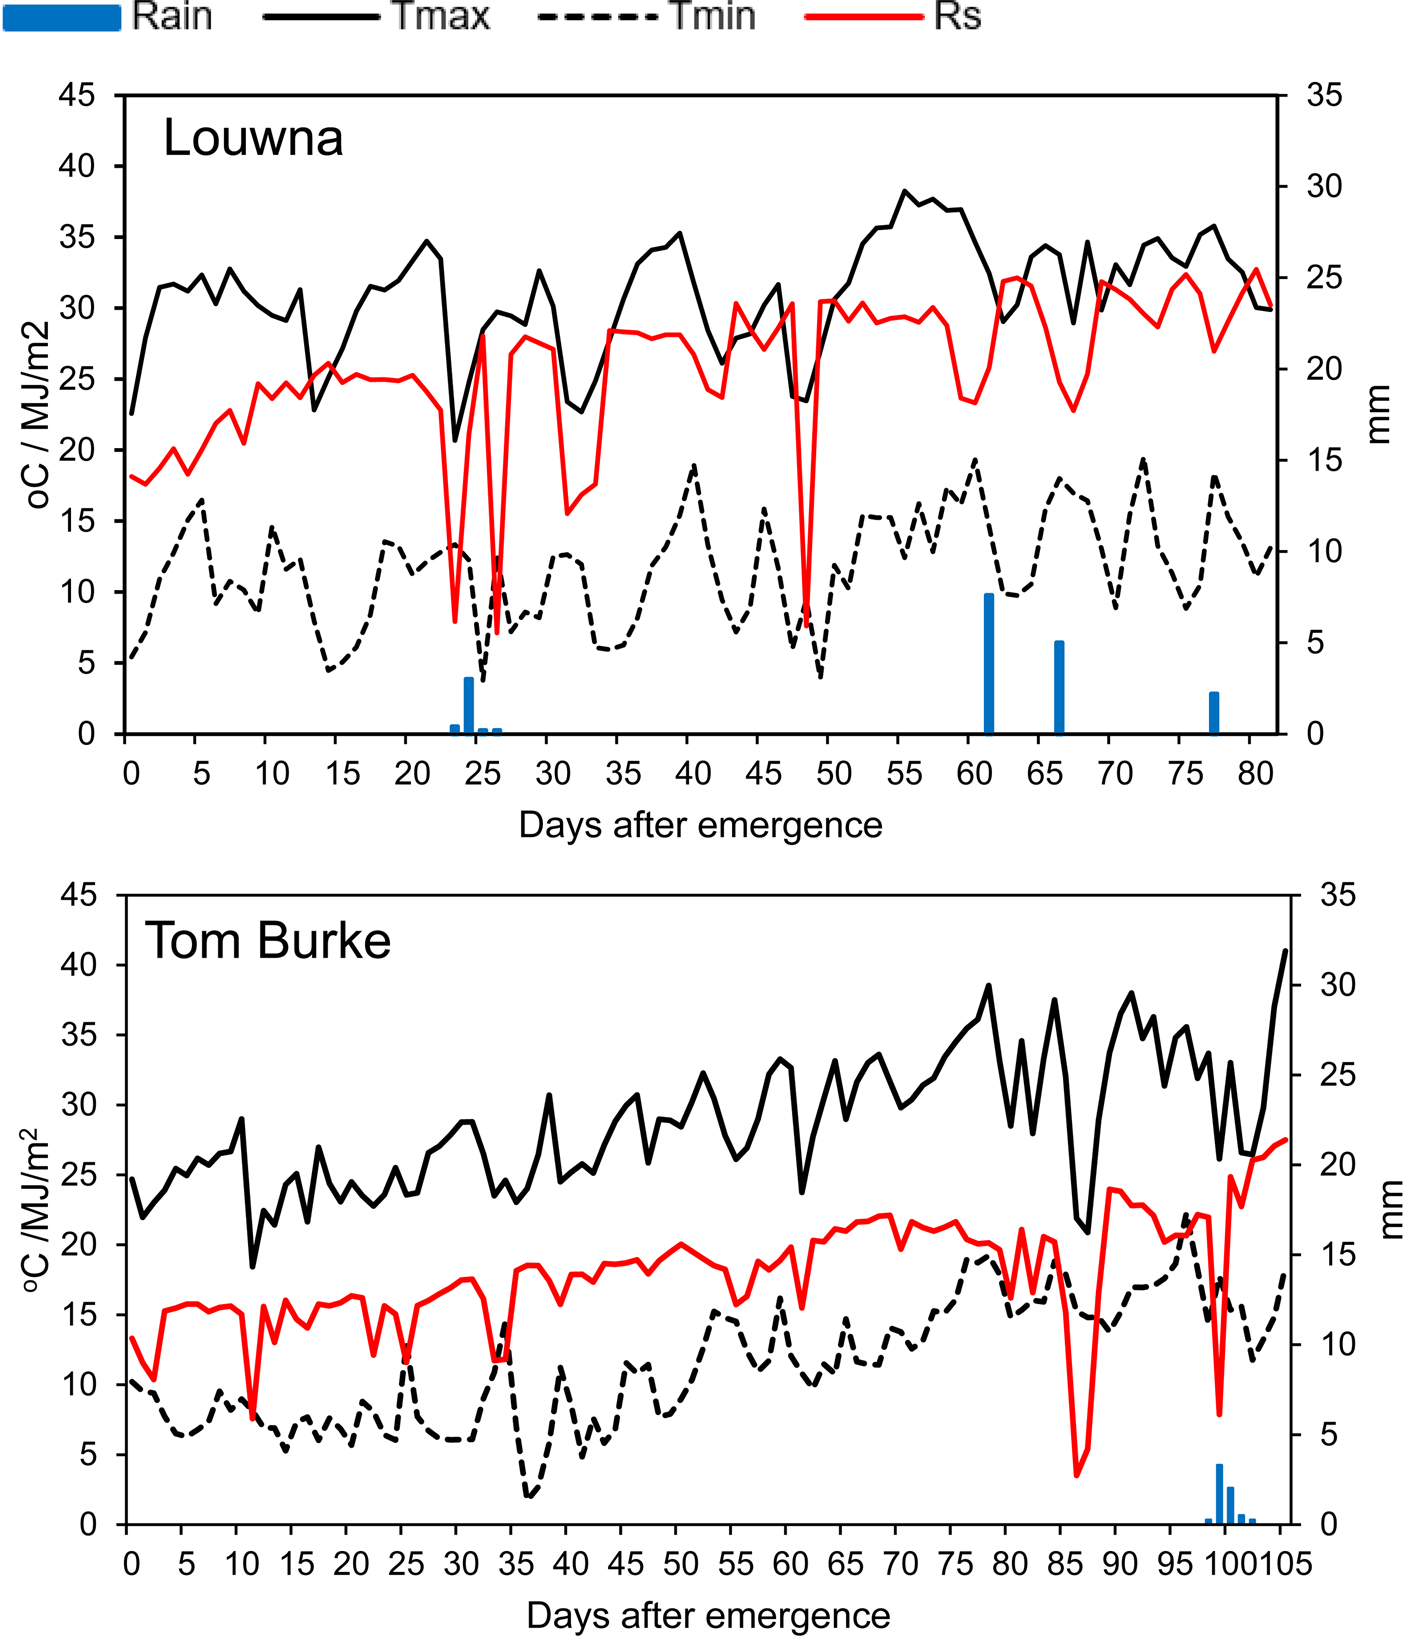
Fig. 4. Daily rainfall (mm), maximum temperature (Tmax), minimum temperature (Tmin) (°C), and daily total solar radiation (Rs) (MJ/m2) from planting to harvest at Louwna and Tom Burke.
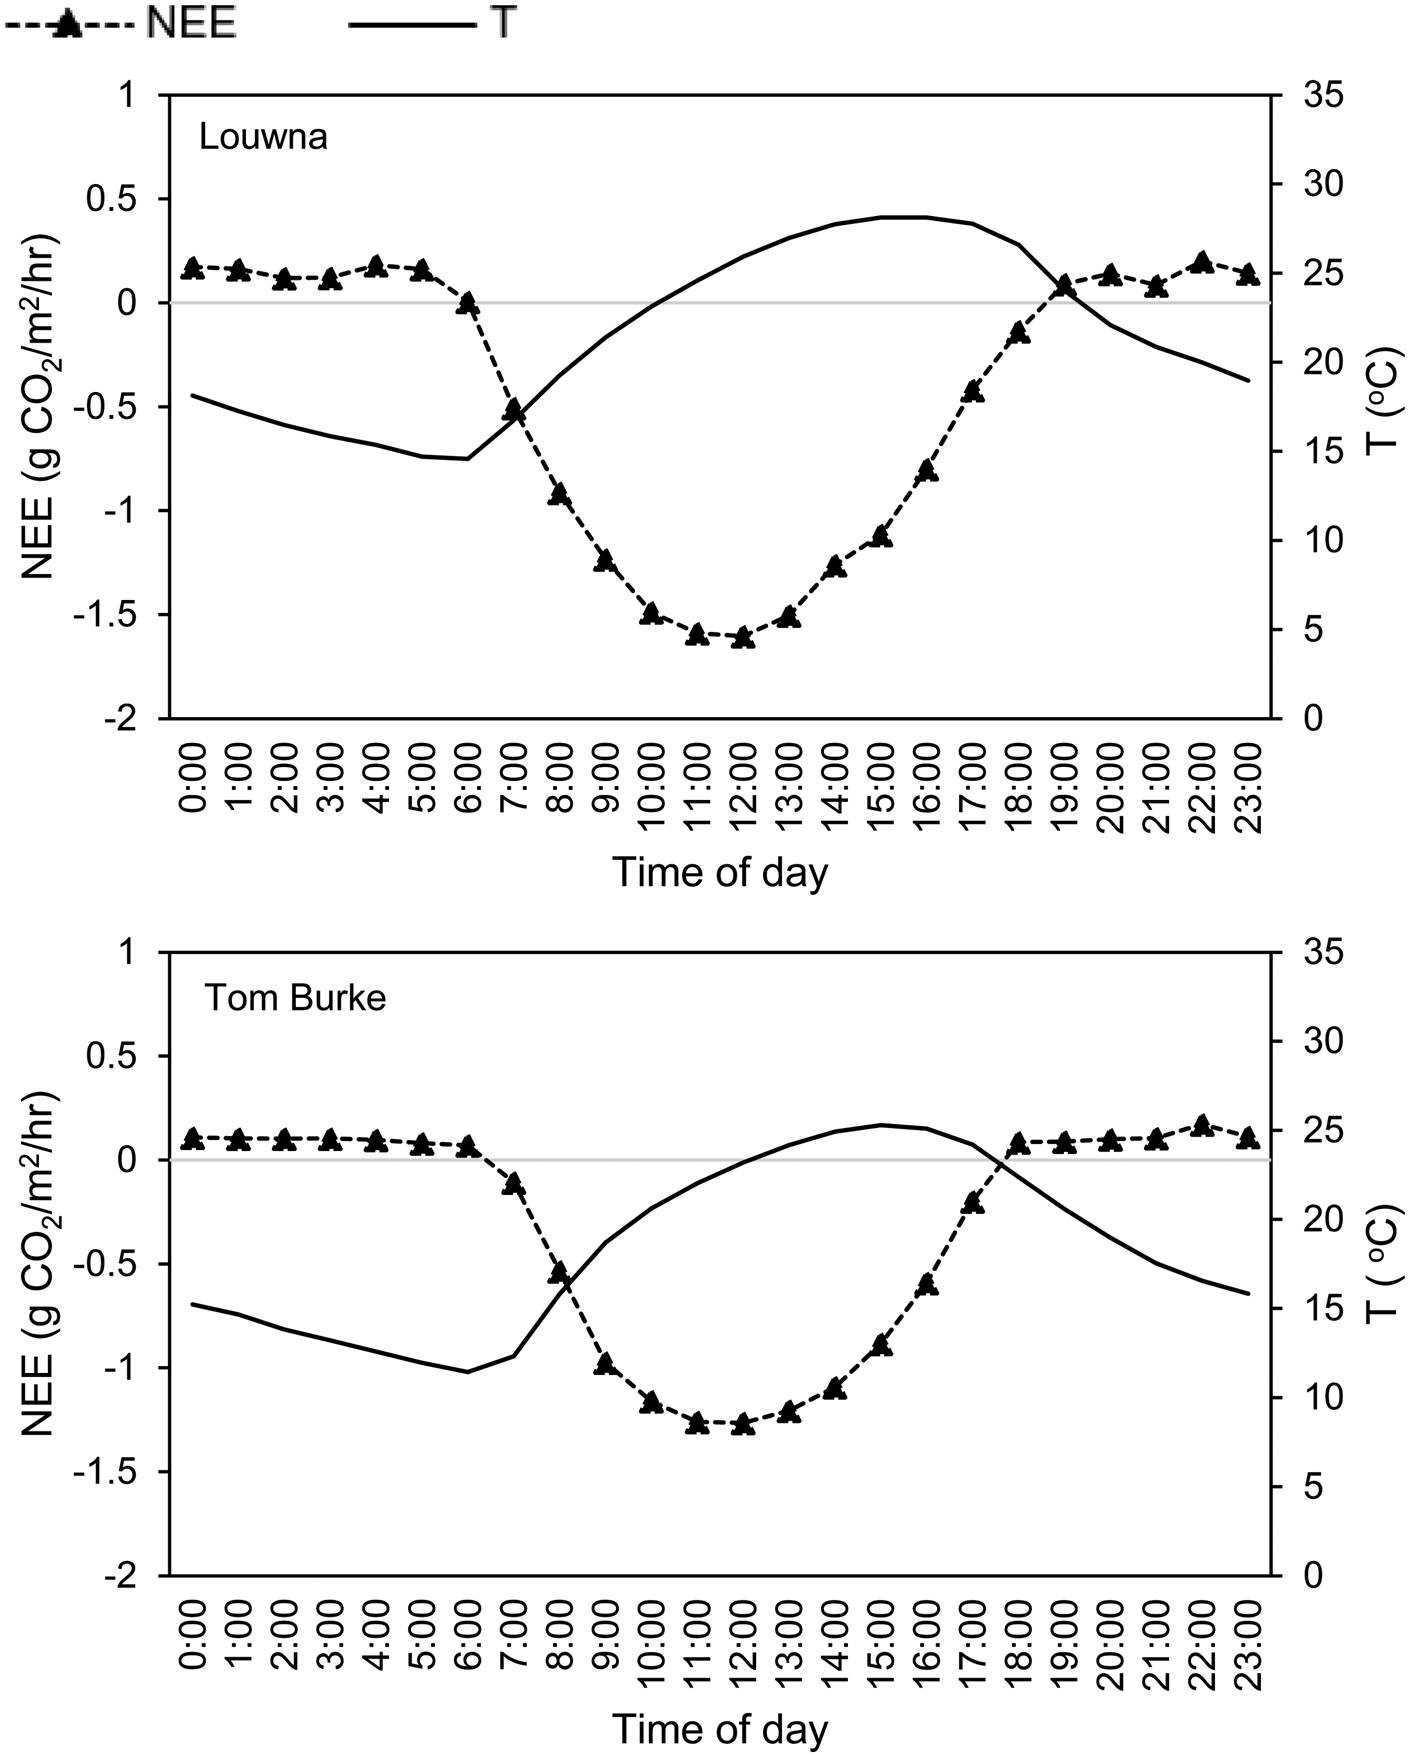
Fig. 5. Seasonal mean diurnal variation in net ecosystem exchange flux (NEE) and ambient temperature (T).
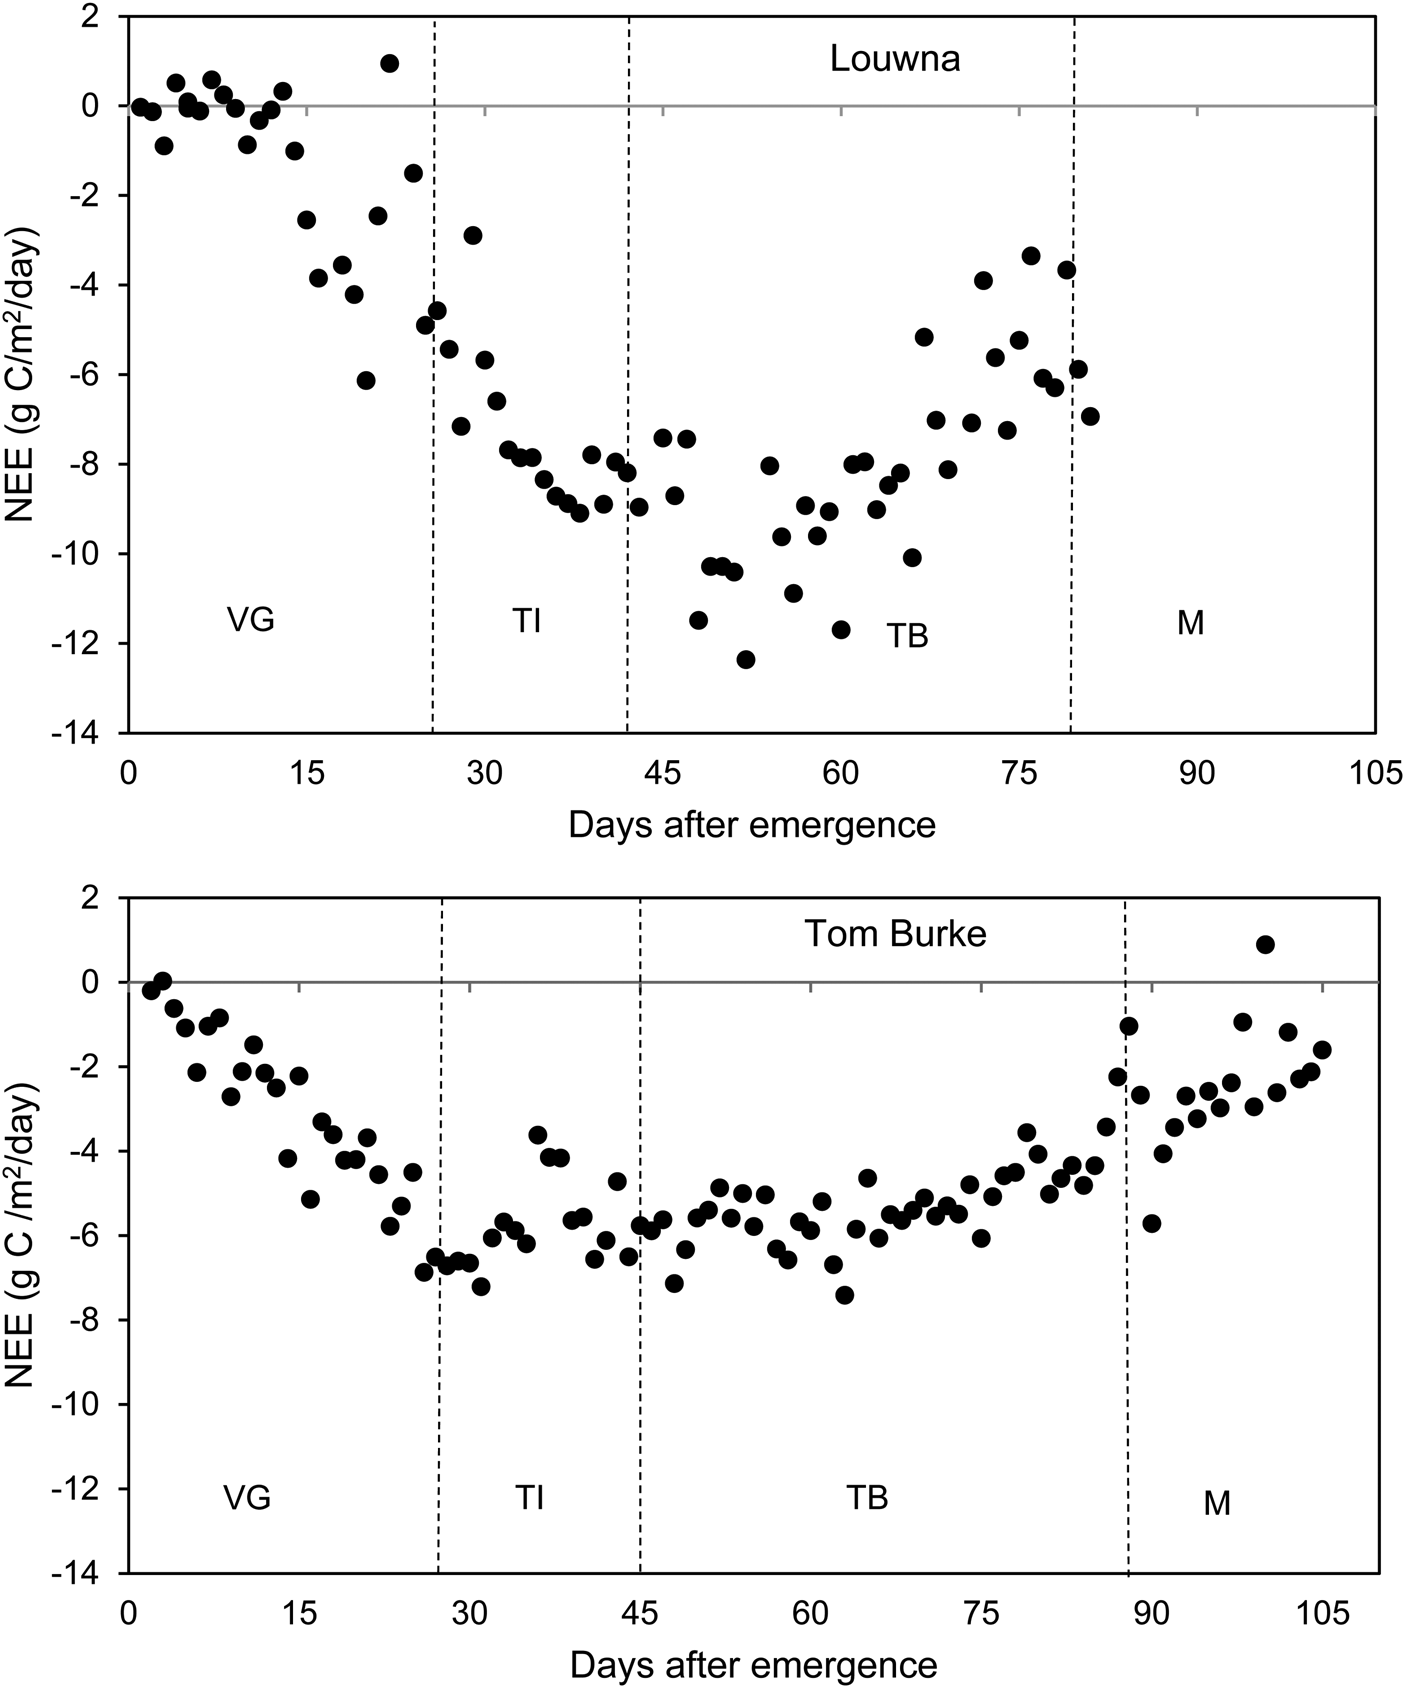
Fig. 6. Daily net ecosystem exchange flux (NEE) in different growth phases of potato (VG – vegetative growth, TI – tuber initiation, TB – tuber bulking and M – maturation) from crop emergence to crop end.


 Open access