


Introduction
Nitrogen (N) pollution from agricultural activities has been a central social and scientific issue for at least the last three decades. Since the 1990s, a series of environmental policies to control N pollution have been implemented on global, national and regional scales, with the nitrates directive being the main policy implemented in the European Union (EU; 91/676/EEC). At the same time an immense body of scientific work has been accumulated to provide N pollution mitigation strategies. Even though this work resulted in significant potential to reduce N deposition both in absolute values and per unit of product produced, the problem remains largely unsolved, especially in countries or regions with high N deposition (Erisman, Reference Erisman2021). When more extreme policies are implemented, a significant social opposition and conflict might rise. This became obvious in the Netherlands with the escalation of Dutch farmers' revolts in July 2022 (Volker, Reference Volker2022). Even though the Netherlands is a particular case due to the high N use relative to the available area to be deposited, several countries are facing similar problems at least in areas overloaded with N. Therefore, N pollution mitigation strategies are still valid and needed. In this direction, nutritional strategies seem to be the most effective way to reduce N excretion at the animal level (Calsamiglia et al., Reference Calsamiglia, Ferret, Reynolds, Kristensen and Van Vuuren2010; Dijkstra et al., Reference Dijkstra, Reynolds, Kebreab, Bannink, Ellis, France, Van Vuuren, Oltjen, Kebreab and Lapierre2013). In the current communication, we will focus in describing a holistic nutritional management (HNM) scheme that leads to improved N use efficiency and reduced N excretion.
Contribution of dairy farming on nitrogen cascade
Nitrogen pollution of the environment has been described as an N cascade, which refers to the sequential transfer of reactive N (Nr) through environmental systems and particularly to the transformations of Nr that enable it either to move from one system to another or to be stored within each system (Galloway et al., Reference Galloway, Aber, Erisman, Seitzinger, Howarth, Cowling and Cosby2003). Non-reactive N (N2) is converted to Nr naturally through microbial activity or by a lightning strike, and artificially by the Haber–Bosch process. Then it enters into the food chain where it is transformed, through biological processes, into inorganic forms of N such as ammonia (NH3), ammonium (NH4+), nitrogen oxides (NOx) and nitrous oxide (N2O), and organic N such as urea and proteins (Galloway and Cowling, Reference Galloway and Cowling2021). Even though the majority of anthropogenic Nr is introduced into the ecosystem in the form of fertilizers to support plant production, a considerable portion of crops and forages is consumed by animals. Of course, the role of ruminants is not negative since they have the ability to consume high fibre feeds and by-products of agricultural production, such as pasture, hay and straw, that are not digestible by humans and other non-herbivorous, and transform them to high-quality protein food for humans (Broderick, Reference Broderick2018). However, as in the case of non-ruminants, this biological process also results in forms of Nr that are excreted by the ruminant into the ecosystem. Therefore, dairy cattle farming is an indirect contributor of N cascade phenomena due to its role in the food chain.
To realize the impact of dairy farming in N cascade we need to take into account that in the European Union (EU)-27 approximately 20.5 million dairy cows were farmed in 2020 (EUROSTAT, 2022). If we consider that each lactating cow consumes 480 g/day of N with a milk N use efficiency (MNE = N in milk/N intake; g/g) of 0.277 g/g (Huhtanen and Hristov, Reference Huhtanen and Hristov2009), we may estimate that each cow excretes approximately 347 g/day of N in manure. Thus, assuming a 305 day/year lactating period it may be calculated that the EU-27 dairy sector, without considering replacement heifers and the dry period of the dairy cows, consumes 3.00 and excretes 2.17 Tg of N per year. Leip et al. (Reference Leip, Caldeira, Corrado, Hutchings, Lesschen, Schaap, De Vries, Westhoek and Van Grinsven2022) estimated a total of 20 Tg of virgin Nr entering the EU ecosystem every year, and 9.1 Tg of that plus 2.3 Tg of imported feed are being transferred into the livestock sector. Thus, it might be calculated that: (1) the overall involvement of lactating dairy cattle in Nr consumption is 26.3% of total Nr directed to animal feed, and (2) approximately 10% of the virgin Nr entering into the EU ecosystem is deposited as cattle manure. Certainly, the major part of this Nr in manure is used for further Nr transfer into plant protein but significant Nr transformations occur during manure storage and field application that move Nr to other systems contributing to the N cascade phenomenon. Several strategies have been developed to reduce these losses at the farm level (Soteriades et al., Reference Soteriades, Gonzalez-Mejia, Styles, Foskolos, Moorby and Gibbons2018). Moreover, Sutton et al. (Reference Sutton, Billen, Bleeker, Bouwman, Bull, Erisman, Grennfelt, Grizzetti, Howard, Oenema, Spranger, Winiwarter, Van Grisven, Sutton, Howard, Erisman, Billen, Bleeker, Grennfelt, van Grinsven and Grizzetti2011) made it clear that a priority is to improve N use efficiency in crops and livestock. Considering that MNE of dairy cattle is relatively low but highly variable (Calsamiglia et al., Reference Calsamiglia, Ferret, Reynolds, Kristensen and Van Vuuren2010), and that a theoretical maximum is close to 0.43 g/g (Dijkstra et al., Reference Dijkstra, Reynolds, Kebreab, Bannink, Ellis, France, Van Vuuren, Oltjen, Kebreab and Lapierre2013), there is definitely much room for improvement and actual on-farm reduction of Nr moved to manure. Improved nutritional management may play an important role in this regard.
Holistic nutritional management
It is generally accepted that crude protein (CP) has been intentionally overfed to lactating dairy cows as a way to handle day-to-day variation in forages and farm practices (Firkins and Reynolds, Reference Firkins, Reynolds, Pfeffer and Hristov2005). Even though this practice has been criticized due to the detrimental effect on MNE, it was a suitable practice, especially for farms that couldn't control CP concentration of forages and concentrates. Feeding to requirement levels is not only a matter of ration formulation, but it presupposes adequate farm feeding management since nutrition is the main factor defining cow's productivity. In this work, we are proposing an HNM scheme as the main strategy to feed animals to metabolizable protein (MP) requirements.
Biological base
In most dairy cattle feeding systems, protein requirements are estimated in the base of MP (Tedeschi et al., Reference Tedeschi, Fox, Fonseca and Cavalcanti2015), resulting in better accuracy compared with CP-based systems. Even though CP is still used as an indicator of N levels of a certain diet, it should not be used as the base for diet formulation. On the contrary, MP originating either from rumen microbes or from feed protein that escaped rumen degradation (Van Amburgh et al., Reference Van Amburgh, Collao-Saenz, Higgs, Ross, Recktenwald, Raffrenato, Chase, Overton, Mills and Foskolos2015; NASEM, 2021) determines the actual amounts of amino acids (AA) that are available to the animal. As described by Russell et al. (Reference Russell, O'Connor, Fox, Van Soest and Sniffen1992), rumen bacteria may be categorized into those that ferment structural carbohydrates (BactSC) and those that ferment non-structural carbohydrates (BactNSC). These have different requirements in terms of N for their growth: BactSC require mainly NH3 while BactNSC require less NH3 and more free AA (Fig. 1). Meeting their requirements will maximize microbial MP, while the excess of rumen NH3 will be absorbed in the portal vein, converted to urea in the liver and then either recycled back to the rumen or, especially if protein is in excess, excreted in urine with a considerable cost in available energy (NASEM, 2021).
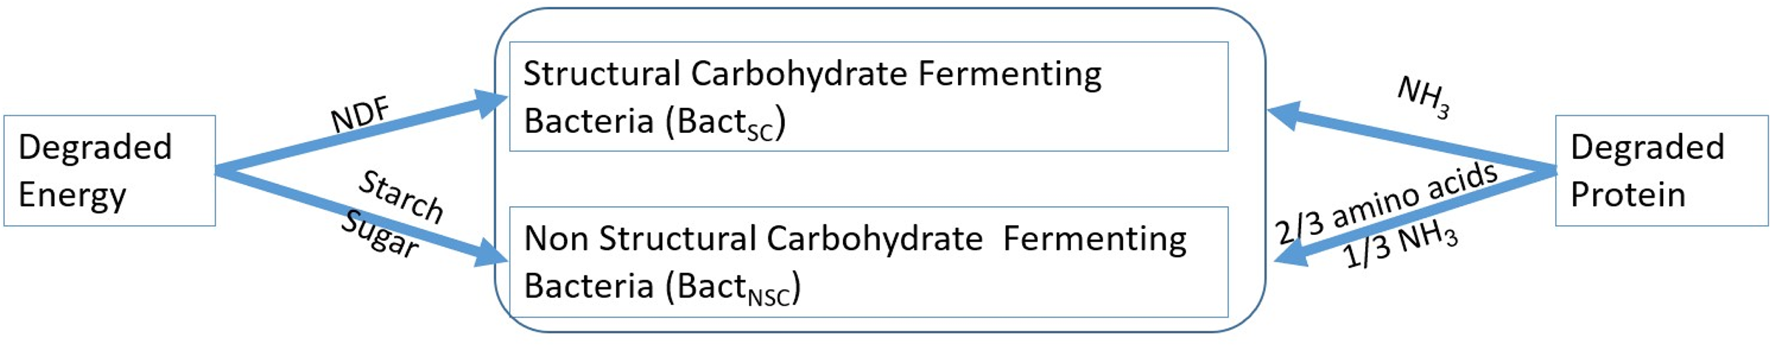
Fig. 1. Nutrient requirements of rumen bacteria that ferment structural carbohydrates (BactSC) and those that ferment non-structural carbohydrates (BactNSC).
Van Amburgh et al. (Reference Van Amburgh, Collao-Saenz, Higgs, Ross, Recktenwald, Raffrenato, Chase, Overton, Mills and Foskolos2015) demonstrated that when metabolizable energy (ME) is the limited nutrient, the excess of N fed to a dairy cow is converted to urea by increasing urinary N (Fig. 2). This is why several authors have suggested that strategies seeking to reduce N excretion should target lowering urinary N and not necessarily faecal N (Dijkstra et al., Reference Dijkstra, Oenema and Bannink2011; Higgs et al., Reference Higgs, Chase and Van Amburgh2012). However, the inefficiency of rumen microbial protein synthesis depends mainly on the source of rumen available energy and protein. Therefore, from a nutritional perspective, dietary rations should be balanced primarily for maximizing rumen microbial protein synthesis by minimizing N losses in the rumen. Then, once rumen function is maximized, the cow should be supplied with feed protein digestible in the intestine to meet its protein requirements. The use of rumen-protected protein feed sources, such as soybean meal, canola meal, etc., and the provision of rumen protected AA might be beneficial for achieving this.
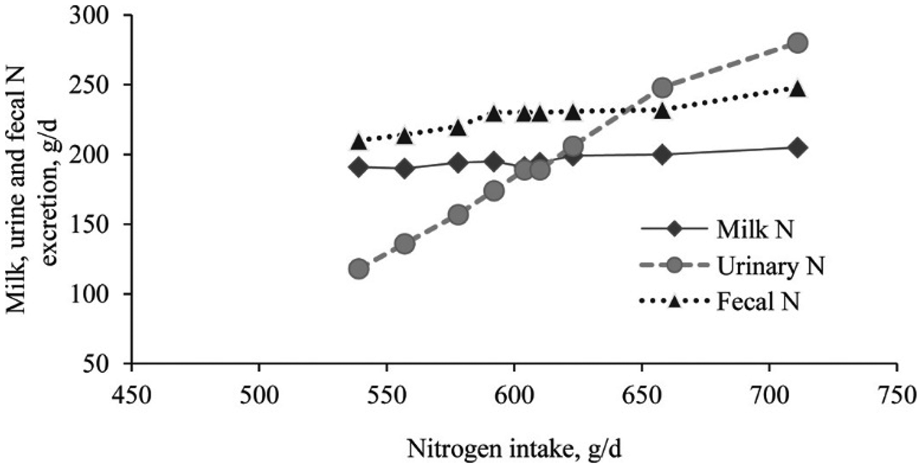
Fig. 2. Nitrogen excretion in milk, faeces and urine based on nitrogen intake in lactating dairy cattle under controlled conditions of energy as first limiting (adapted from Van Amburgh et al., Reference Van Amburgh, Collao-Saenz, Higgs, Ross, Recktenwald, Raffrenato, Chase, Overton, Mills and Foskolos2015).
Feeding groups formation
It is well established that feeding one total mixed ration (TMR) to lactating cows in a herd will result in nutritional imbalances concerning cows producing lower or higher than the average of the herd. In contrast, several studies have established the economic benefits of group formation in a herd as a management practice that provides different diets to different groups, with the objective of feeding cows closer to their requirements (Kalantari et al., Reference Kalantari, Armentano, Shaver and Cabrera2016; Wu et al., Reference Wu, Liang, Shaver and Cabrera2019). Moreover, St-Pierre and Thraen (Reference St-Pierre and Thraen1999) demonstrated, through Monte-Carlo simulation, that group formation may reduce N excretion per kg of milk produced by 8%, while Kalantari et al. (Reference Kalantari, Armentano, Shaver and Cabrera2016) estimated a 2.7% improvement of MNE when three feeding groups were formed instead of one. However, on a farm level it is not always easily acceptable to change nutrition practice from one feeding group to multiple ones, either due to requests from farm managers to ‘keep it simple’ (Contreras-Govea et al., Reference Contreras-Govea, Cabrera, Armentano, Shaver, Crump, Beede and Vandehaar2015) or to actual difficulties created by the design of farm facilities, available equipment, herd size and management ability (Dann, Reference Dann and Beede2017).
Several criteria have been proposed to form feeding groups in dairy herds, ranging from simply milk yield or fat and protein milk yield, to cluster based on NEL and CP density requirements, with clustering being the most widely used. In these efforts, the environmental benefits became detectable; however, CP was used as the main indicator of protein requirements and, as mentioned already, this is not a suitable measure of N available to the cow. In a recent study, Barrientos-Blanco et al. (Reference Barrientos-Blanco, White, Shaver and Cabrera2020) used MP instead of CP, which resulted in 15.14 g/cow less N supply. Therefore, group formation may be the base on which diets maximizing MNE at different nutrient requirements are formulated.
Ration formulation
Formulation of the diet is the central element of HNM. It might refer to one feeding group or, preferably, to various feeding groups in a dairy herd. Before selecting a diet formulation system, it is necessary to have a scientific evaluation of the model, and taking into consideration the importance of improving MNE, that it is also evaluated for protein-limiting diets. However, it is common for only specific parts of the model to be evaluated, or for evaluation of overall performance without distinguishing for cases where ME or MP are the limiting factors. The evaluation of the latest version of the Cornell Net Carbohydrate and Protein System (CNCPS), however, with a dataset of 250 different TMR fed to lactating cattle was applied to the entire dataset (first limiting ME or MP allowable milk) and separately for diets where ME was the first limiting nutrient (first limiting ME allowable milk) and those where MP was the first limiting nutrient (first limiting MP allowable milk). As demonstrated in Fig. 3, the model performed best for MP limiting diets (R 2MDP = 0.82, RMSPE = 1.1, CCC = 0.83), followed by the entire dataset (R 2MDP = 0.78, RMSPE = 1.6, CCC = 0.83), and ME limiting diets (R 2MDP = 0.76, RMSPE = 1.8, CCC = 0.84) (Van Amburgh et al., Reference Van Amburgh, Collao-Saenz, Higgs, Ross, Recktenwald, Raffrenato, Chase, Overton, Mills and Foskolos2015). It became obvious that CNCPSv6.5 can be used to lower N intake levels of dairy cattle without impacting their production negatively. Thus, CNCPS v6.5 was selected as the main diet formulation model within the HMN approach. Therefore, the following guidelines on diet formulation are suggested:
-
Step 1. Define principal forages available to the farm (e.g. corn silage, alfalfa silage, alfalfa hay, wheat straw) and the desirable forage to concentrate ratio (F:C). This is calculated on a DM basis, and it might range from 40:60 to 60:40 for a high yielding group, and from 50:50 to 80:20 for a low yielding group.
-
Step 2. Select concentrate feeds that provide adequate levels of starch, sugars, NDF and N available both in the rumen and post-rumen. Nutrient recommendations for lactating Holstein cows by Cornell University are provided in Table 1. At this step ME and MP should not be balanced but to be close to targets.
-
Step 3. Rumen N balance. The CNCPSv6.5 provides a calculation of NH3 requirements for microbial protein synthesis (peptide and NH3, % requirements). This calculation takes into consideration the degradation of protein sources in the rumen that provides peptides and NH3 as well as the rumen degradation of energy sources (starch, sugars, NDF) to estimate MP derived from rumen bacteria. In an ideal situation, peptide and NH3 (% requirements) should be 100%. However, depending on farm management and the detrimental effects that shortage of NH3 has on microbial function in the rumen, it is recommended to be between 110 and 120% requirements. If peptide and NH3 (% requirements) is higher than 120% it might be utilized by rumen microbes by providing additional energy. Otherwise, protein sources that provide soluble N in the rumen should be gradually reduced. The final goal of this step is to balance for rumen N and to maximize bacterial MP.
-
Step 4. ME and MP in balance. Once rumen function is maximized, to balance for MP requirements is necessary to add feeds that escape rumen degradation. Of course, the final inclusion of these feeds depends on the target of ME and MP (e.g. low or high group within the farm). It should be noted that several decisions in this step may provoke changes in the previous steps, especially in step 3. It is necessary to move back and forward several times in order to balance for both ME and MP within the nutritional limits described in Table 1.
-
Step 5. Amino acids, minerals and vitamins. Once MP and ME are in balance, attention should be given to AA balance, and especially to methionine and lysine. The CNCPSv6.5 provides calculations for both AA. In this direction, rumen protected methionine and lysine should be added to meet requirements. As reported by Van Amburgh et al. (Reference Van Amburgh, Collao-Saenz, Higgs, Ross, Recktenwald, Raffrenato, Chase, Overton, Mills and Foskolos2015) the optimal inclusion of Met and Lys is 2.6–2.8 and 6.8–7.0% MP, respectively. Last but certainly not least, attention should be given to vitamins and minerals.
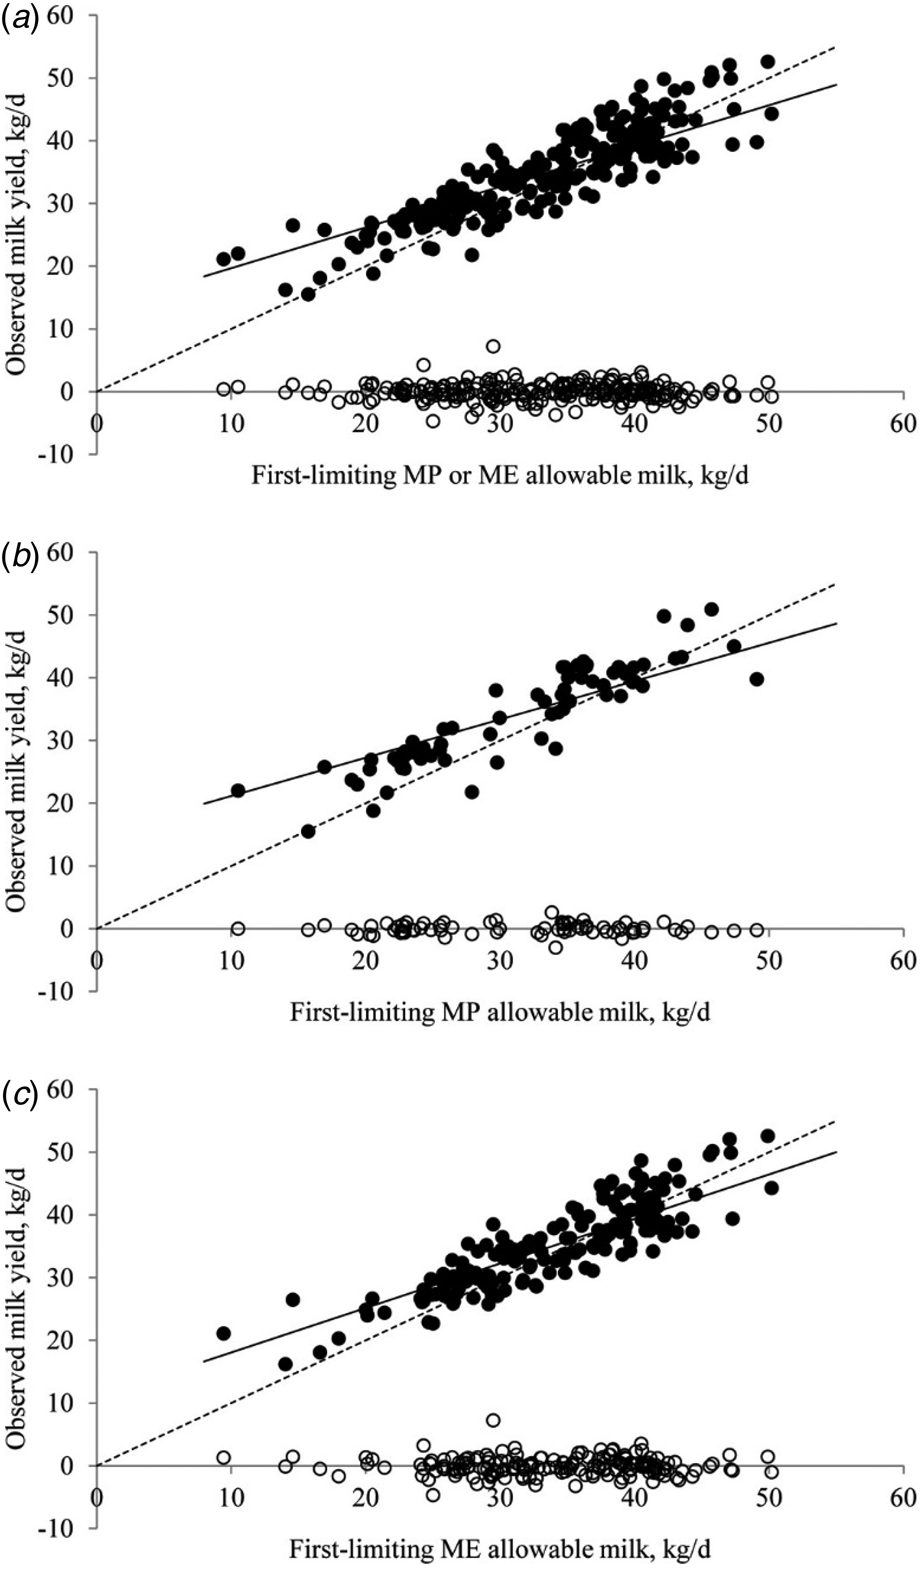
Fig. 3. Observed v. Cornell Net Carbohydrate and Protein System predictions (●) for (a) first-limiting MP- or ME allowable milk (y = 0.65x + 13.17), (b) MP first-limiting milk (y = 0.61x + 15.06) and (c) ME first-limiting milk (y = 0.71x + 10.92). Mixed model residuals are also shown on the graph (○). Adapted from Van Amburgh et al. (Reference Van Amburgh, Collao-Saenz, Higgs, Ross, Recktenwald, Raffrenato, Chase, Overton, Mills and Foskolos2015).
Table 1. Basic nutrient recommendations for feed formulation with the Cornell Net Carbohydrate and Protein System (Van Amburgh, M.E., Overton, T.R., and Chase, L.E., Cornell University)

DM, dry matter; ME, metabolizable energy; MP, metabolizable protein; NDF, neutral detergent fibre.
Ration implementation
On a farm level, we frequently observe the existence of three different TMR: (1) formulated TMR, (2) mixed TMR and (3) consumed TMR. This differentiation derives from several management factors at the farm level, and the principal objective of HNM is to unify these three TMR in one: the formulated diet.
Diet formulation with mechanistic models requires measured inputs to run the model. Among the most important are the body weight (BW) and body condition score (BCS) of the cows. The first influences a series of equations in the model, such as the prediction of dry matter intake (DMI), but the most important are related to the estimated ME and MP for maintenance. It is generally assumed that cow's BW is not significantly different among farms, and it may vary depending on the region and the genetic sources in each country. However, this is not true. Within the work of the CowficieNcy project (Horizon2020-777974; www.cowficiency.org) we reported an average BW of 730 ± 72 kg, with a range of average BW at the farm level from 662 to 783 kg. Furthermore, BCS is a good indicator of energy dynamics, and depending on group formation the BCS target will provide a measurable figure either of BCS loss that will support milk production or BCS gain that will increase ME and MP requirements. Therefore, both BW and BCS should be assessed frequently, and within the HNM the minimum length between two assessments was set at 3 months.
Another element that should be assessed frequently is the actual DMI. The CNCPSv6.5 provides both CNCPS and NRC equations to predict DMI, but both equations are empirical and contain significant error. Therefore, it is recommended to measure actual DMI frequently. Depending on group targets, cows may be fed either ad libitum or restricted. In the first case, orts should be 5% of the DM offer. Even though several farms weigh orts, they are not assessing their DM. The correct measurement of DMI includes the assessment of both quantity (offered or refused) and DM content. Several studies have focused on the significant variation of feedstuff's chemical composition, and especially that of forages. St-Pierre and Weiss (Reference St-Pierre and Weiss2015) reported significant day-to-day variation in DM and starch of corn silage and in DM and NDF of alfalfa silage in dairy farms. Variation in DM of forages is crucial considering that diets are formulated on a DM basis, but mixed and offered on an as-fed basis. This is the main element of miscommunication between the nutritionist and the farmer. If actual DM of forages is not measured frequently, then the observed variation will create imbalances of ME and MP of the supplied TMR. Therefore, it is proposed that the DM of silages and other high moisture feedstuffs should be analysed at least weekly, and the chemical composition of all ingredients fed to lactating dairy cattle once per month.
Another element of importance is the homogeneity of the TMR to reduce sorting by cattle. This is related to both mixing monitoring of the TMR and measures to increase its homogeneity. Oelber and Stone (Reference Oelber, Stone and Beede2017) identified several factors in the TMR loading and mixing that may generate variation in the TMR. From an HNM perspective, the process needs to be monitored frequently by a specialist to detect errors in the mixing process, and samples of the TMR should be collected and analysed with the Penn State Particle Separator and/or chemically to identify the extent of variation. Furthermore, measures to increase homogeneity of the TMR are needed during both diet formulation (e.g. inclusion of molasses, water, etc.) and mixing (particle size of forages, mixing order, time of mixing, etc.). To this end, there are available feed software programs that not only record daily mixing of the TMR but also have the ability to adjust actual quantities based on the DM of forages. Even though feed software is used frequently to track the performance of a feeder, it may also be used as the basis to evaluate errors in weighing at each farm and to promote training of farm personnel responsible for feeding. Training of personnel is an essential element in any management scheme, and in this case the work of Oelber and Stone (Reference Oelber, Stone and Beede2017) is an excellent guide for it.
Within the CowficieNcy project several dairy farms in Greece, Italy, Spain and the UK were evaluated for their N status, and a set of pilot farms applied the HNM scheme. Preliminary results suggest that MNE improvement is possible.
Conclusions
Anthropogenic Nr is an important element of modern food production systems defining the productivity of crops and livestock. However, it enters the ecosystem in such quantity that the ecosystems are overloaded with specific forms of Nr that cause pollution. Dairy cattle farming is a secondary contributor to the N cascade phenomenon as it transforms plant Nr to animal Nr. In this process, Nr transformation has a low efficiency due to necessary biological processes, such as maintenance protein turnover, and farm practices, such as feeding or manure management. In the current work, we describe an HNM scheme involving animal, feed and farm management to improve milk nitrogen use efficiency that consequently reduces Nr excretion in the environment.
Author contributions
A. F. conceived the study, received funding, administrated the project and wrote the article. A. P. conducted data gathering and wrote the article.
Financial support
Funding for this work was provided by the EU Horizon 2020 Marie Sklodowska-Curie Research and Innovation Staff Exchanges project CowficieNcy (grant no. 777974).
Conflict of interest
None.
Ethical standards
Not applicable.


 Open access