Introduction
Since about the mid-20th century, models of grazed grassland ecosystems have been constructed that range in complexity from simple general functions (Noy-Meir, Reference Noy-Meir1975; Lebon et al., Reference Lebon, Mailleret, Dumont and Grognard2014) to highly detailed simulations based on the physical and biological components of the ecosystem (Vickery and Hedges, Reference Vickery and Hedges1972; Innis, Reference Innis and Innis1978; Breymeyer and Van Dyne, Reference Breymeyer and van Dyne1980; Stuth and Lyons, Reference Stuth and Lyons1993; Teague et al., Reference Teague, Grant, Kreuter, Diaz-Solis, Dube, Kothmann, Pinchak and Ansley2008; Petz et al., Reference Petz, Alkemade, Bakkenes, Catharina, Schulp, van der Velde and Leemans2014). Broadly speaking, the simple models are more effective at providing insights into general system properties than they are at analysing management options; in contrast, detailed models can analyse management options but leave the broader picture obscure. These limitations do not preclude the possibility posited in the current paper that simple models, which capture the fundamental functional relations of the system at the hierarchical level relevant to management, can be parameterized and used to explore the response space meaningfully.
In a seminal and widely cited paper, Noy-Meir (Reference Noy-Meir1975) applied predator-prey theory to formulate a simple model of the dynamics and stability of continuously grazed systems. The two basic processes that determined biomass dynamics were plant growth and animal consumption of herbage. Accordingly, the model comprised one function that described herbage growth rate and another that described herbage consumption rate. The model was applied later to seasonal pastures (Noy-Meir, Reference Noy-Meir1978a) and differing functional forms for the two respective core functions were examined (Noy-Meir, Reference Noy-Meir1978b). Noy-Meir's model provided deep insights into the stability properties that emerge from the interplay of the two basic functions; it showed that at the ecosystem level of grazed, seasonal grassland, a few relatively stable, dominant properties determine the responses of sward growth and forage consumption by the herd to management manipulation, despite wide year-to-year variations in climatic conditions and system responses.
Noy-Meir's model generates qualitative and quantitative predictions. A qualitative prediction would be that ‘the system’, as represented by the herbage biomass at any point of time, has directionality: it will be drawn towards a stable equilibrium point. (Whether or not it reaches that point, and how long it remains there, will depend on the length of the growth, or ‘green’, season.) The model also predicts that when the fundamental management-control variable of animal density is below a certain threshold there is one stable equilibrium point, which occurs at relatively high biomass. Over a limited range of animal densities above this threshold, there are two stable equilibria, which occur at low and high biomass, respectively, and the one to which the system transitions will depend on initial conditions, i.e. the biomass at which grazing commences. A direct outcome of this qualitative prediction of the model is a second fundamental management control variable: grazing deferment at the start of the green season. In terms of the two basic functions of the model, deferment determines the point from which the consumption function should be applied, but is not used directly in either of them.
Once values are assigned to the parameters of the growth and consumption functions of the model, quantitative predictions can be generated, such as the threshold animal density above which early-season grazing deferment is essential to ensure transition towards the high-biomass equilibrium (at which primary production is greater, soil exposure is lower and seed production is less vulnerable than at the low-biomass equilibrium) and how the equilibrium biomass changes with animal density. The values of the parameters can be determined from independent experimental data derived from the system or from calibration against a long-term data set (Adiku et al., Reference Adiku, Ahuja, Dunn, Derner, Andales, Garcia, Bartling, Ahuja and Ma2011; Henkin et al., Reference Henkin, Ungar, Perevolotsky, Gutman, Yehuda, Dolev, Landau, Sternberg and Seligman2015). The latter approach was adopted in the current work, by using a long-term grazing trial on strongly seasonal Mediterranean grassland (Henkin et al., Reference Henkin, Ungar, Perevolotsky, Gutman, Yehuda, Dolev, Landau, Sternberg and Seligman2015). This trial examined various combinations of the above management control variables, i.e. animal density and grazing deferment. The average seasonal duration and timing of grassland growth can function as driving variables of the model in analysis of a multi-year data set.
If the model performs adequately, it can facilitate meaningful analyses of a wide range of management scenarios that cannot be explored empirically because of cost and logistical constraints. This is especially important when the experimental error intrinsic to empirical data obtained from complex ecosystems makes it difficult to derive general conclusions from the field data alone (Gutman et al., Reference Gutman, Holzer, Baram, Noy-Meir and Seligman1999). The objectives of the current study were: to characterize the phases of the annual production cycle and biomass production observed in the long-term grazing trial on Mediterranean grasslands; use that data to parameterize Noy-Meir's model of system dynamics and use the model to assess grazing management options.
Materials and methods
The study site
The field study was conducted at the Karei Deshe Experimental Farm in the eastern Galilee, Israel (35°35′ E; 32°55′ N; 60–250 m a.s.l.). Detailed descriptions of the landscape, soil and vegetation of the site were provided by Gutman and Seligman (Reference Gutman and Seligman1979), Gutman et al. (Reference Gutman, Holzer, Seligman and Noy-Meir1990), Sternberg et al. (Reference Sternberg, Gutman, Perevolotsky, Ungar and Kigel2000) and Henkin et al. (Reference Henkin, Ungar, Perevolotsky, Gutman, Yehuda, Dolev, Landau, Sternberg and Seligman2015). Briefly, the topography is hilly upland with slopes generally <20° and average rock cover of about 0.30; the soil is a fertile brown protogrumosol (Dan et al., Reference Dan, Yaalon, Koyumdjisky and Raz1975) on a basaltic substrate; its depth is variable but seldom >0.6 m, and usually considerably less. The vegetation of the region is hemicryptophytic grassland, comprising approximately 200 species (Zohary, Reference Zohary1973). Sternberg et al. (Reference Sternberg, Gutman, Perevolotsky, Ungar and Kigel2000) reported that 0.74 of species sampled were annuals, and plant cover was dominated by ten species comprising: four grasses (Hordeum bulbosum L. [p; perennial], Avena sterilis L. [a; annual], Hordeum spontaneum Koch [a] and Triticum dicoccoides (Koern. ex Asch. and Graebn.) Schweinf. [a]); two thistles (Scolymus maculatus L. [a] and Echinops adenocaulos Boiss. [p]); two legumes (Trifolium pilulare Boiss. [a] and Bituminaria bituminosa L. [p]); one crucifer (Rapistrum rugosum (L.) All. [a]) and one forb (Echium plantagineum L. [a]).
The area has a strongly seasonal Mediterranean climate characterized by short, mild, wet winters and springs, followed by long, hot, dry summers. Average annual rainfall is approximately 560 mm. The rainy season, throughout which the vegetation is usually green, begins in October–November and ends in April–May. By mid-January/mid-February the vegetation is highly nutritious; it can support satiation forage intake by the herd without constraining animal production. By the end of April most plants mature, disperse seed, wither and die, or become dormant, so that in summer the quality of the herbaceous vegetation does constrain animal production (Henkin et al., Reference Henkin, Ungar, Dvash, Perevolotsky, Yehuda, Sternberg, Voet and Landau2011). Accordingly, supplementary feeding to make up for nutritional deficiencies – mainly low protein levels in summer – until the next rainy season is a common practice in the region. Often, roughage is given to balance the high moisture content of the vegetation at the beginning of the green season.
Experimental treatments
The currently ongoing long-term grazing trial commenced in 1994. The data on which the current paper was based covered the periods 1994–2010 (for calibration purposes) and 2012 (for validation purposes). The treatments and experimental design were described in detail by Henkin et al. (Reference Henkin, Ungar, Perevolotsky, Gutman, Yehuda, Dolev, Landau, Sternberg and Seligman2015). Two stocking densities of beef cows were examined: 0.55 Animal Units (AU)/ha, which was designated moderate (M), and 1.1 AU/ha, which was designated high (H). The two stocking densities were combined with two grazing protocols: continuous grazing (C) and split-paddock grazing (S). Both protocols employed early-season grazing deferment for an average of about 70 days, to allow the herbage to reach a threshold above which the livestock could forage a substantial part of their daily requirement. The moderate stocking density represented the common practice of this region, and variations of both grazing protocols are common.
There were two replicates of the four combinations of stocking density and grazing protocol, which resulted in eight paddocks whose areas ranged from 21 to 31 ha. The paddocks allocated to the split-grazing protocol were each sub-divided into two sub-paddocks, designated early (E) and late (L). At the end of the deferment period the animals of the split-grazing protocol were introduced into their respective early sub-paddocks, where they remained for the winter and spring. Stocking densities during this period were, therefore, double those in the corresponding undivided paddocks: high at the moderate stocking density (MSE; 1.1 AU/ha) and very high at the high stocking density (HSE; 2.2 AU/ha). The animals were transferred to their respective late sub-paddocks for the summer grazing period, again creating high (MSL) and very high (HSL) stocking densities. However, the timing of the transfer from early to late sub-paddocks was always earlier under the high than under the moderate stocking density. That was because herbage biomass was inadequate to maintain animal production throughout the green season in the HSE sub-paddocks, therefore the herds were moved to the HSL sub-paddocks before the end of the green season. Although not relevant to the current analysis, subsequent herbage regrowth in the HSE sub-paddocks under the high stocking density was utilized by the animals much later in the year. At the moderate stocking density, biomass in the early sub-paddocks always supported animal production through the end of the green season and the animals were transferred to the late sub-paddocks about 1 month later, in the dry season.
Average stocking densities during 1994–2010 and also during 2012 were close to the planned densities of 0.55, 1.1 and 2.2 AU/ha, respectively, although there were small fluctuations in these values over time. Average rainfall during 1994–2010 (505 ± 133.9 mm) was less than the long-term (1964–2017) average of 548 ± 155.0 mm.
Biomass measurements
As described in detail by Henkin et al. (Reference Henkin, Ungar, Perevolotsky, Gutman, Yehuda, Dolev, Landau, Sternberg and Seligman2015), standing biomass was estimated by clipping the vegetation in (25 × 25)-cm2 quadrats placed at random along permanent transects that traversed the 12 experimental paddocks. The biomass was sampled four times annually, but the current analysis was based on data from the first two samplings, which pertain to the green season. The first sampling was at the end of the early-season grazing deferment, and the second was at the end of the green season. To characterize the undisturbed growth of the vegetation, measurements were also conducted in paddocks (designated NoGrz) that had not been grazed for the previous 40 years.
Biomass measurements were collected this way every year from 1994 until 2010. The paddocks were monitored again in 2012 to provide an independent data set to validate the model described below and to add a measurement of biomass in the HSE sub-paddocks at the time the herds were moved to the HSL sub-paddocks.
The model
All symbols are presented in Table 1, with their definitions and units. All references to herbage biomass, growth and consumption are on a dry matter basis.
Table 1. List of symbols used in the text with their definitions, units and assumed values for parameters
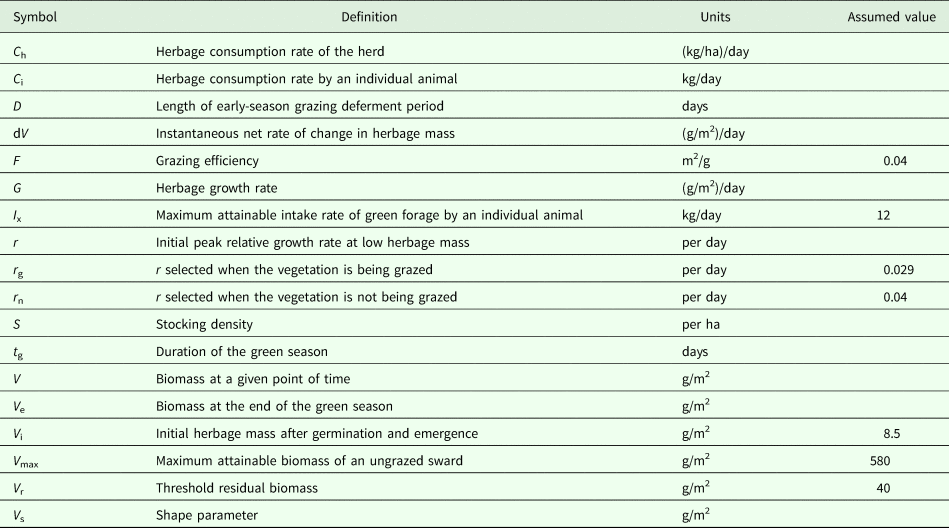
Herbage mass is on a dry matter basis throughout.
Noy-Meir's simple model of grazing system dynamics (Noy-Meir, Reference Noy-Meir1975) was applied to the long-term trial described above, and the values of some parameters for which there was no independent experimental evidence were derived. The model treats the processes of herbage growth and herbage consumption as functions of the standing herbage biomass at any point during the green season (Fig. 1).
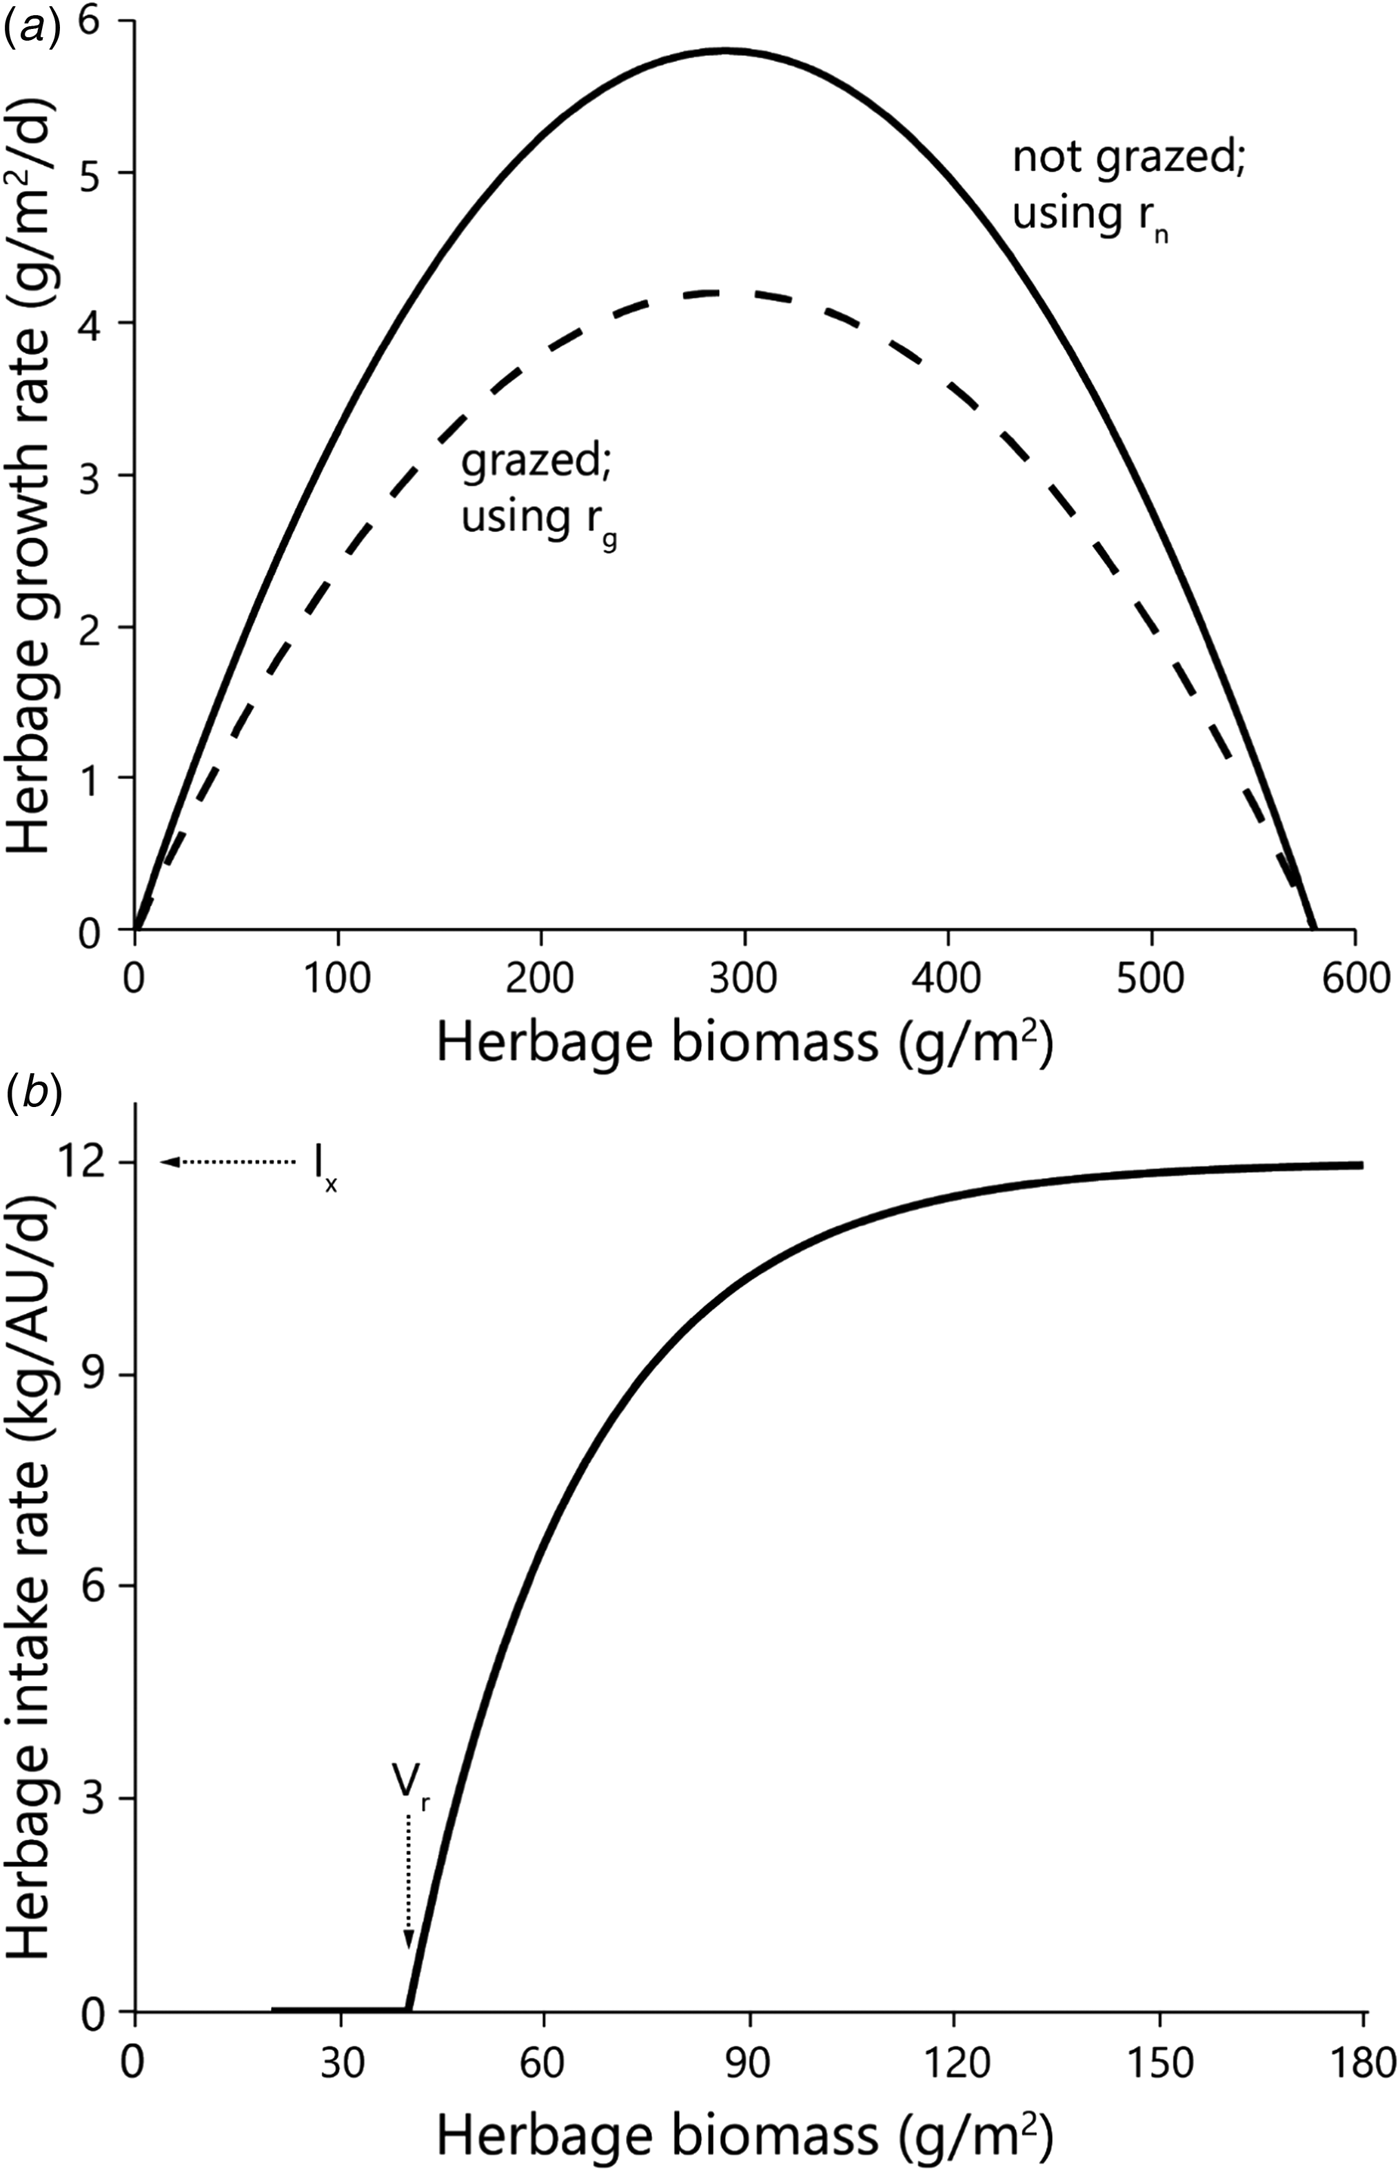
Fig. 1. The basic state–rate relationships defined in Noy-Meir's model. The relationships define (a) daily herbage growth rate and (b) daily herbage intake rate by 1 AU, both as functions of the green herbage biomass (dry matter basis) at any point during the green season. The parameters that define the functions are those used in the model (Table 1). All symbols are defined in Table 1. The herbage growth rates presented are in the absence of grazing (based on parameter r n) and in the presence of grazing animals (based on parameter r g). To harmonize the units of the two rates, the individual herbage intake rate needs to be multiplied by the stocking density, as in Fig. 2.
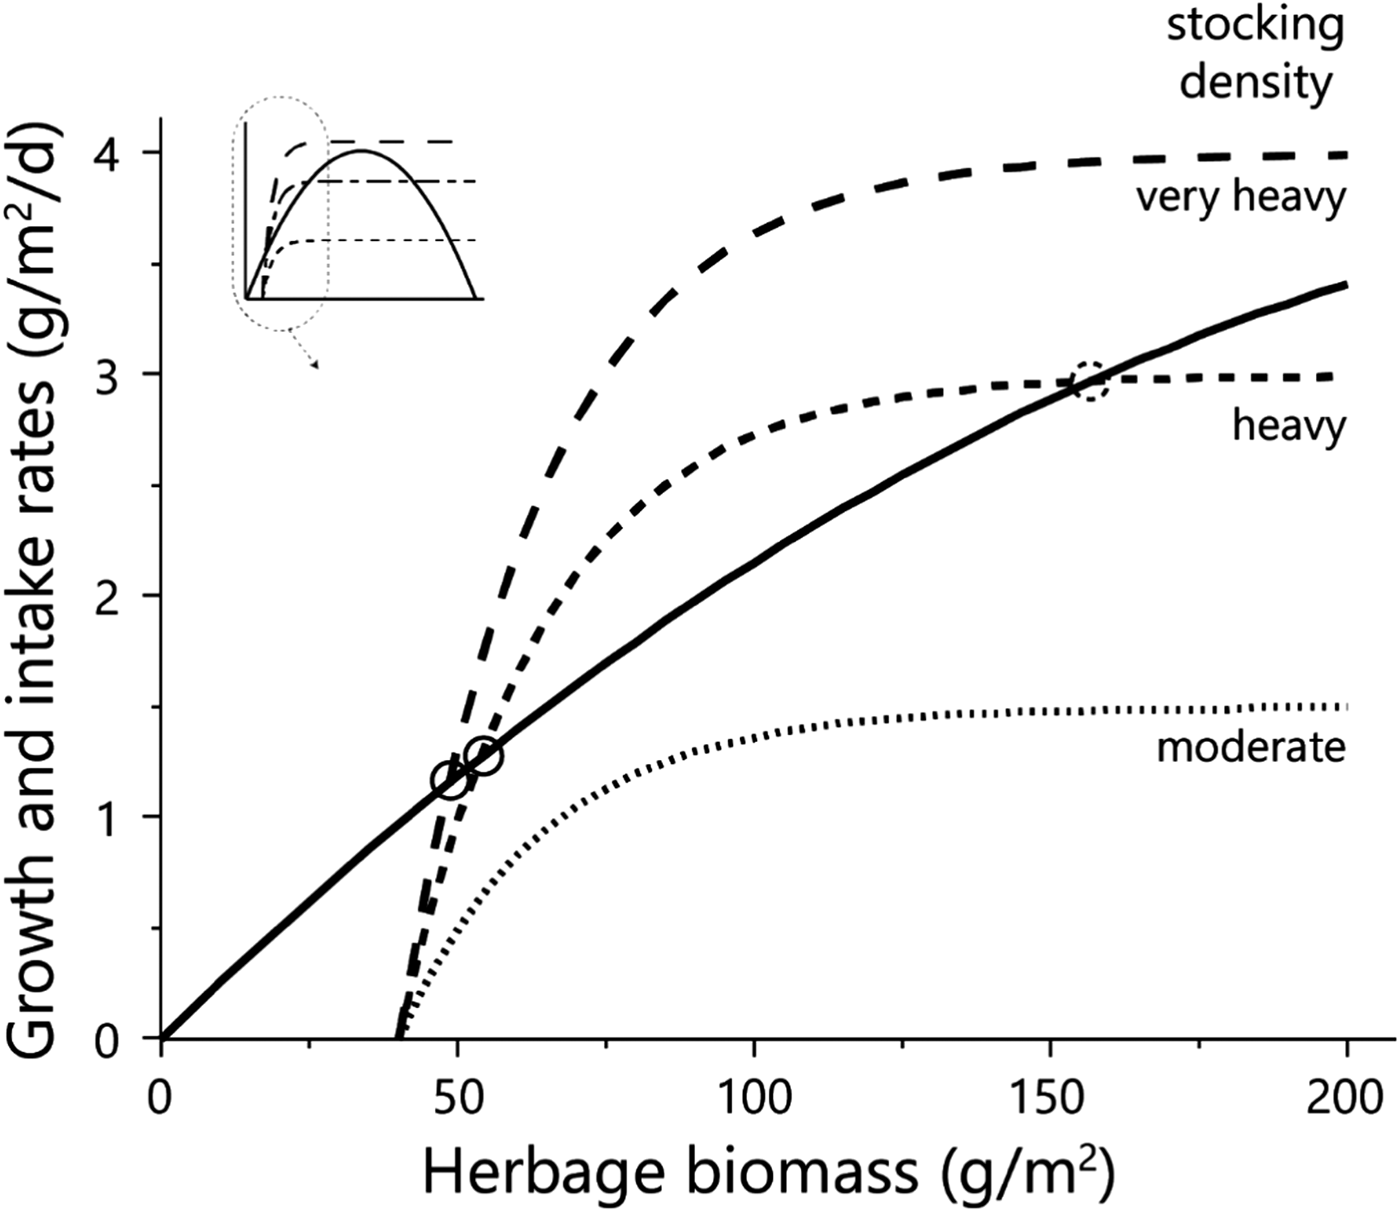
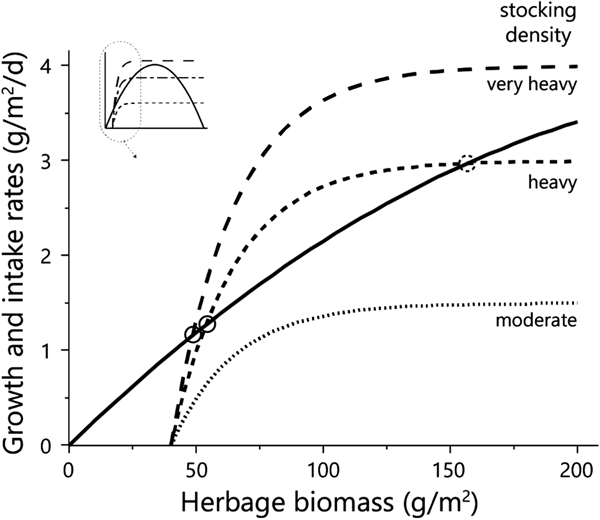
Fig. 2. Diagrammatic representation of the emergence of equilibrium between the growth rate of the herbage (solid line) and herbage intake rate at three stocking densities (dashed lines). Equilibrium points are shown for conditions in the low-to-intermediate biomass range as solid (stable) or dashed (unstable) circles. The inset shows the shape of the functions over the entire biomass range, and the zone shown in the enlargement. Herbage mass is on dry matter basis.
The herbage growth process is based on a growth rate that increases to a maximum as the green herbaceous biomass increases, then falls to zero as the biomass approaches its potential. In the case of the logistic functional form used here, the state/rate relationship between biomass (V) at a given point of time and herbage growth rate (G) is quadratic; G increases to a peak at half the maximum attainable biomass of an ungrazed sward (V max) and declines to zero at V max. Growth rate is regulated by the initial peak relative growth rate that is achieved at low herbage mass (r):
The value of r differs among species (Reich et al., Reference Reich, Buschena, Tjoelker, Wrage, Knops, Tilman and Machado2003) but in a herbaceous sward with dozens of predominantly annual species it was assumed that the relative growth rate was lower under grazing because of the removal of actively growing tissue and trampling damage to the plants, by the grazing animals (Hilbert et al., Reference Hilbert, Swift, Detling and Dyer1981). To account for this, the basic Noy-Meir model was modified by setting r to r n when the vegetation was not being grazed, and to r g when the vegetation was being grazed.
An individual animal's herbage consumption rate is determined by a saturation functional response in which the state/rate relationship between biomass (V) and consumption rate (C i) is represented by the inverted exponential function. Below a threshold residual biomass (V r), an animal cannot grasp the forage and its consumption rate is zero; above V r its consumption rate increases asymptotically with increasing herbage biomass in accordance with the animal's grazing efficiency (i.e. the extent to which it can find food to meet its requirements at low food densities), until it reaches satiation at a maximum attainable intake rate (I x). A shape parameter (V s) controls the steepness with which the consumption function rises; the consumption rate is 0.63·I x when V = V s:
An alternative form of Eqn (2) uses an explicit grazing efficiency (F) which is equal to the reciprocal of the difference between V s and V r:
The consumption function for an individual animal (C i) is multiplied by stocking density (S) to yield the consumption rate of the herd (C h) in the same units as are used for the herbage growth rate. This enables the two functions to be superimposed in the graphical analysis of stability properties (Fig. 2), in which the consumption rate of the herd is subtracted from the herbage growth rate to give the instantaneous net rate of change in herbage mass (dV):
The combined effect of the two processes can be integrated numerically, after setting parameters that are determined by the properties of the vegetation and of the grazing animal. For the vegetation, an initial herbage mass at the beginning of the growth season (V i, at time zero of the model) and duration of the green season (t g) would be set in conjunction with the two parameters of the herbage growth function: r [r g or r n] and V max. These parameters enable expression of the climatic characteristics of the year(s) being analysed. For the animals, values are required for the residual biomass (V r), satiation intake rate (I x) and grazing efficiency (V s or F); for the studied grazing system there is solid empirical evidence for the parameters I x (Holzer et al., Reference Holzer, Benjamin, Gutman, Levy and Seligman1990; NRC, 2000; Aharoni et al., Reference Aharoni, Brosh, Orlov, Shargal and Gutman2004) and V r (Cohen, Reference Cohen1990); the others were based on best-available empirical evidence and calibration against actual grazing data (Adiku et al., Reference Adiku, Ahuja, Dunn, Derner, Andales, Garcia, Bartling, Ahuja and Ma2011). The management-control variables of the system are stocking density (S) and the length of the early-season grazing deferment period (D) imposed by the herd manager.
Calibration of the model parameters
The model was calibrated against the data collected from 1994 to 2010 (Henkin et al., Reference Henkin, Ungar, Perevolotsky, Gutman, Yehuda, Dolev, Landau, Sternberg and Seligman2015). The data set included stocking density, duration of livestock grazing and the biomass estimates obtained at the beginning and conclusion of the green season. Model parameters that were subject to uncertainty were estimated initially according to the best available information and subsequently adjusted to minimize a target function based on the deviation from the 17-year average biomass of each treatment replication. The median parameter values across all treatments were then adopted for subsequent runs of the model (Table 1), at which point the model output depended only on the stocking density, and the duration and timing of grazing in each treatment.
Once calibrated, the model simulated the two data sets (1994–2010 and 2012) for all grazing treatments, as functions of stocking density and grazing duration during the herbage growth period.
System responses to management-control variables
The model was run with the adopted parameter values (Table 1) for nine different grazing scenarios: early-season grazing deferments of 0, 40 and 70 days, and three stocking densities designated as moderate, intermediate and heavy stocking, i.e. 0.43, 0.67 and 1.11 AU/ha, respectively. The green season, from germination through the end of growth, lasted for 140 days and exhibited the same characteristics that prevailed during 2012; the dry season, i.e. the remainder of the year, comprised 225 days.
For each day of the green season, the model computes the two rate variables and updates the state variable (biomass) accordingly. During the deferment period, herbage consumption is set to zero. To express the contribution of herbage consumption to the seasonal or annual feed requirements of the animal(s), a seasonal feed deficit is calculated (for a cow of 500 kg liveweight weaning 0.7 calves per year), which is assumed to be made up with supplementary feed. For the green season, the seasonal feed requirements per unit area of herbage are the product of daily satiation intake per head (assumed to be 12 kg), season duration of 140 days, and stocking density. The cumulative herbage consumption per unit area is deducted from this. During the dry season there is no growth, only intake by the grazing herd, consumption by ants and other granivores (Azcarate and Peco, Reference Azcarate and Peco2006), and weathering and trampling of the dry biomass. The seasonal requirement is based on a lower daily satiation intake rate of 8 kg, a longer duration of 225 days and the relevant stocking density. From this requirement is deducted the simulated biomass at the end of the green season, reduced by 30% to account for losses (de Ridder et al., Reference de Ridder, Seligman and van Keulen1981) and an ungrazable residue of 40 g/m2. This simple approach assumes that forage-quality deficits are supplemented independently, in keeping with the seasonal variability of herbage quality, which is very high during the green season and very low towards the end of the dry season (Henkin et al., Reference Henkin, Ungar, Dvash, Perevolotsky, Yehuda, Sternberg, Voet and Landau2011). Primary productivity is defined as the herbage biomass at the end of the green season plus the cumulative herbage consumption per unit area.
Statistical analysis
The harvested-biomass data were analysed with the general linear model (SAS Institute, 2002) to determine the respective weights of the effects of year, treatment, replication and (year × treatment) interaction, in the explainable variation. Significant differences between the grazing scenarios were subjected to the Tukey–Kramer multiple range test.
To compare the precision of the model output with that of the experimental data, two indicators of divergence were adopted: dM, which measures the relative divergence of the model from the average of the replications of each treatment; and dD, which measures the relative divergence of the difference between replicates and their average. The percentage divergences between model and field data were determined for the averages of treatment replicates in the 1994–2010 data set, and for the actual replicates in the 2012 data set. This procedure was applied to all grazing treatments, as defined by stocking density and length of deferment.
Results
Phases of the annual production cycle
At the beginning of the green season most annual herbaceous species had germinated by 17 November, on average, and the herbaceous vegetation was usually well established 14 days after the first effective rainfall (defined as >19 mm) (Svoray et al., Reference Svoray, Shafran-Nathan, Henkin and Perevolotsky2008). The average date of the first effective rainfall on the experimental farm during 1994–2010 was 4 November, and the average duration of the green season was 145 days from establishment to maturity, the latter being indicated by initiation of seed dispersal of the predominantly annual species and onset of herbage desiccation.
The initial grazing deferment lasted 69 ± 22.8 days after establishment of the vegetation. At the end of deferment, usually during the latter half of January, when the standing green biomass was on average 74 ± 4.1 g/m2 (Table 2), the animals were introduced into the experimental paddocks. As the standing biomass rose above 100 g/m2, intake from forage satisfied all the nutritional needs of the animals and they ceased to receive supplementary feed. After early-season deferment of grazing, the average duration of the green grazing season was 76 ± 16.7 days. The herds in the early sub-paddocks were moved to the late sub-paddocks when the vegetation was grazed down to a level that stressed the animals. This occurred, on average, 16 days after the end of the green season in MSE, and 26 days before the end of the green season in HSE, i.e. 42 days earlier than in MSE. Consequently, the herbage in the MSL sub-paddocks was not grazed during the green season.
Table 2. Average green biomass (g/m2) at the start of grazing and end of the green season for all grazing regimes, for 1994–2010 and for 2012
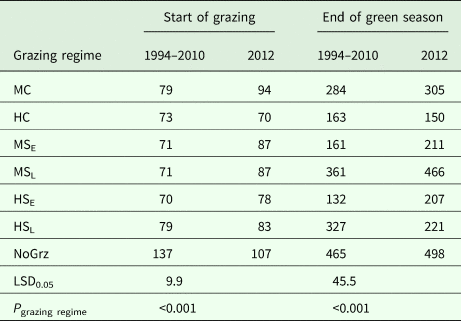
Grazing regimes determined: stocking density (M = moderate; H = high); protocol (C = continuous; S = split-paddock) and timing for the split paddocks (E = early; L = late). NoGrz refers to an ungrazed control area.
Biomass in the period 1994–2010
The average amount of standing biomass differed among treatments throughout the green season (Henkin et al., Reference Henkin, Ungar, Perevolotsky, Gutman, Yehuda, Dolev, Landau, Sternberg and Seligman2015). However, despite wide year-to-year variations and large end-of-season differences among treatments, the differences among standing biomass levels at the beginning of grazing in the subsequent winter were very small (Table 2) (Sternberg et al., Reference Sternberg, Golodets, Gutman, Perevolotsky, Kigel and Henkin2017). When the herds entered the paddocks, the variation between treatments in their standing biomass was narrow, at 70–79 kg/ha; the year effect accounted for most of this variation. During the 76-days mean duration of green-season grazing, large differences developed between treatments so that the contribution of treatment to the explained variance of biomass values increased from 4% (N.S.) at the start of the green season to 54% (P < 0.001) at the peak of herbage growth. In contrast, the contribution of year to the explained variance decreased from 84% (P < 0.001) to 36% (P < 0.001) over the same period.
As some indication as to the internal consistency of the results, it was noted that standing biomass at the end of the green season (V e; as long-term average) was clearly related to the stocking density during the green season in a logical way. The paddock/sub-paddock ranking for V e was MSL > HSL > MC > [HC, MSE] > HSE (Table 2). This ranking matches expectations in a number of respects: (1) V e was highest in the sub-paddocks that were not grazed during the green season (MSL) and lowest in the most heavily grazed ones (HSE). It should be noted that V e in the HSE sub-paddocks included some growth that occurred between removal of the animals and the end of the green season; (2) V e in the HC paddocks was similar to that in the MSE sub-paddocks; which was expected because stocking density was the same in both treatments during the green season; (3) V e was greater for MC than for HC and (4) V e in the HSL sub-paddocks was less than that in the MSL sub-paddocks, which was expected because the former were grazed towards the end of the green season by the herds that were moved there from the very heavily grazed HSE sub-paddocks, whereas the MSL sub-paddocks were not grazed prior to the sampling of V e. Taken together, these results provide some confidence in the findings of the grazing trial.
Comparison between model predictions and field data
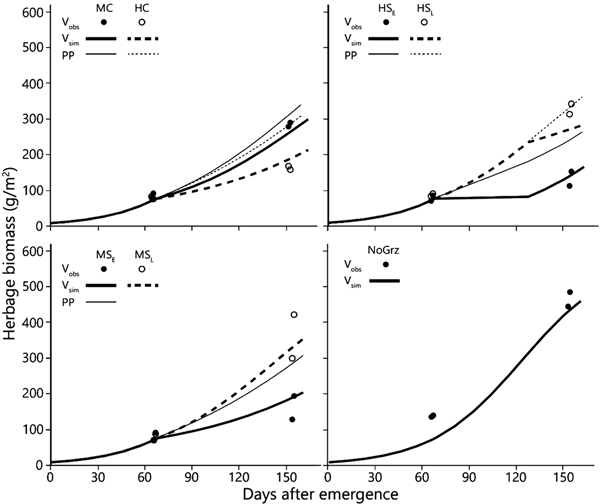
The model predictions of herbage biomass and total biomass production are presented in Figs 3 and 4, together with the measured biomass data of the replicated paddocks. At the end of the green season, the overall divergence (dD) among the replicates of the treatments was clearly greater than that between the model values and the mean of the replicates considered across all treatments of the grazing trial (dM; Table 3). At the beginning of the grazing season, dD was somewhat less than dM in the long-term data set, because of the large divergence between the model output and the data in the NoGraz treatment (Fig. 3(d)). The same pattern emerged with regard to the standard deviations (Table 3). It can be concluded that the model predictions of biomass dynamics based on a single parameter set across all treatments were mostly less divergent from the replicate mean than were the individual replicates.
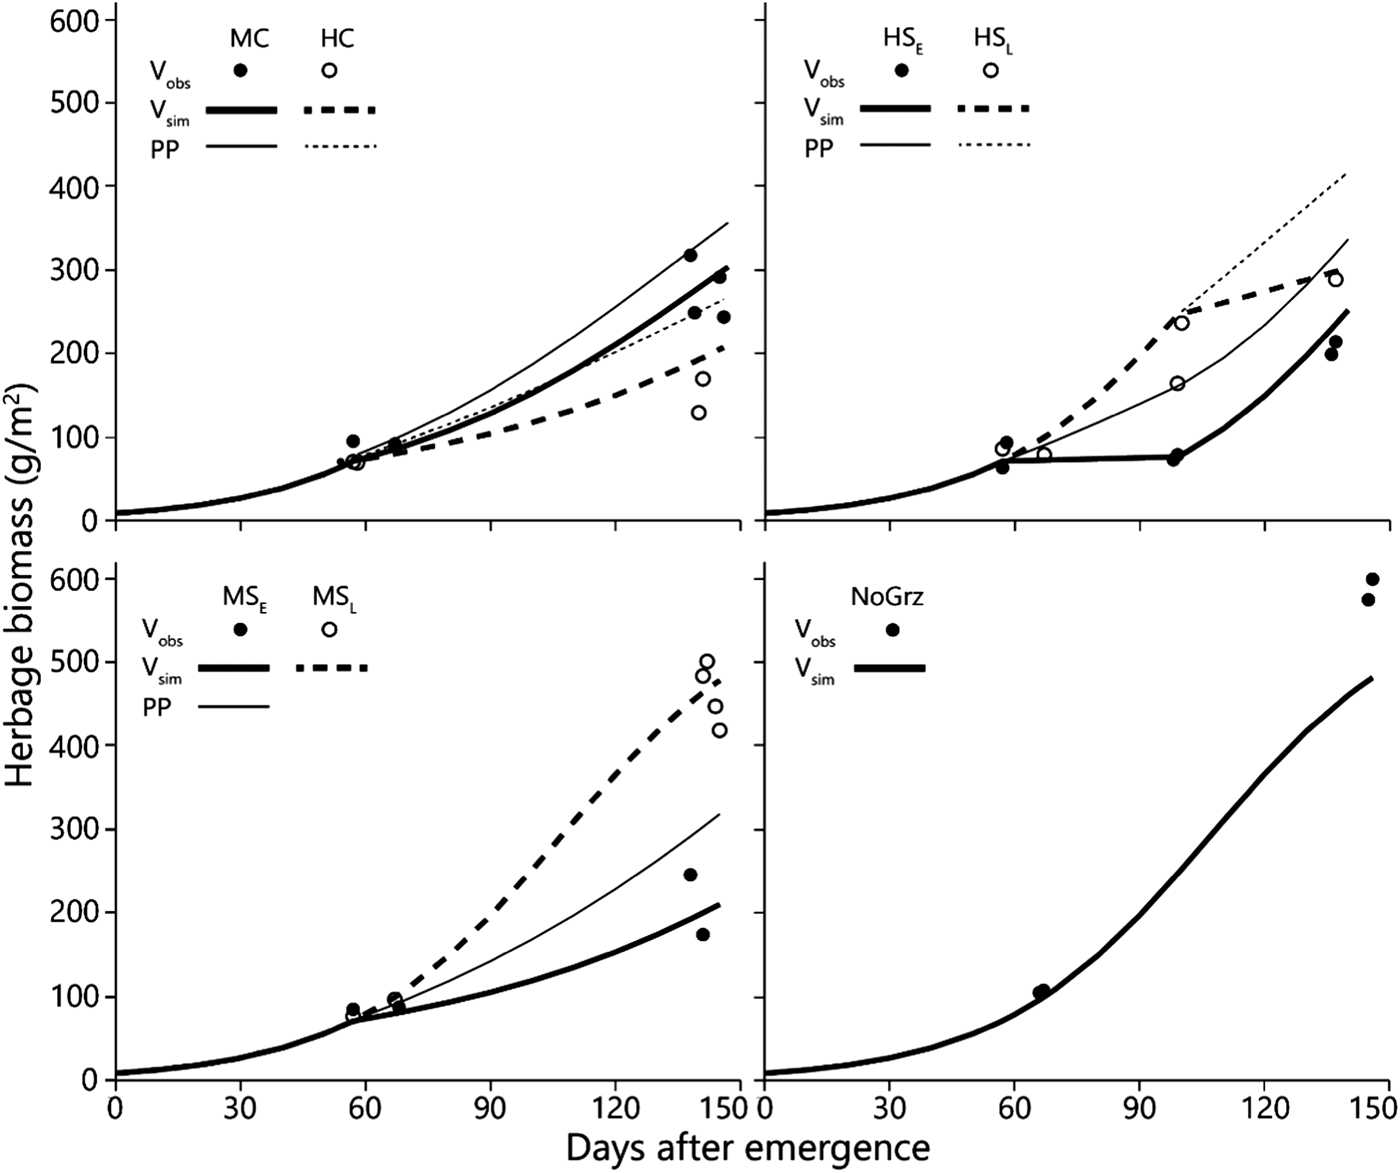
Fig. 3. Simulated and observed total standing biomass in the treatment paddocks – 2012 season. Curves represent simulated biomass (V sim) and points represent observed biomass (V obs). All parameters in the model, except for stocking density and deferment, are uniform across all treatments (Table 1). Estimated primary productivity (PP) is plotted for the grazed paddocks. Treatment abbreviations: M = moderate and H = high stocking density; C = continuous and S = split-paddock grazing; subscripts E and L = early and late sub-paddock; NoGrz = ungrazed paddocks. Measurements were repeated a few days apart in MC and MSL. Herbage mass is on dry matter basis.
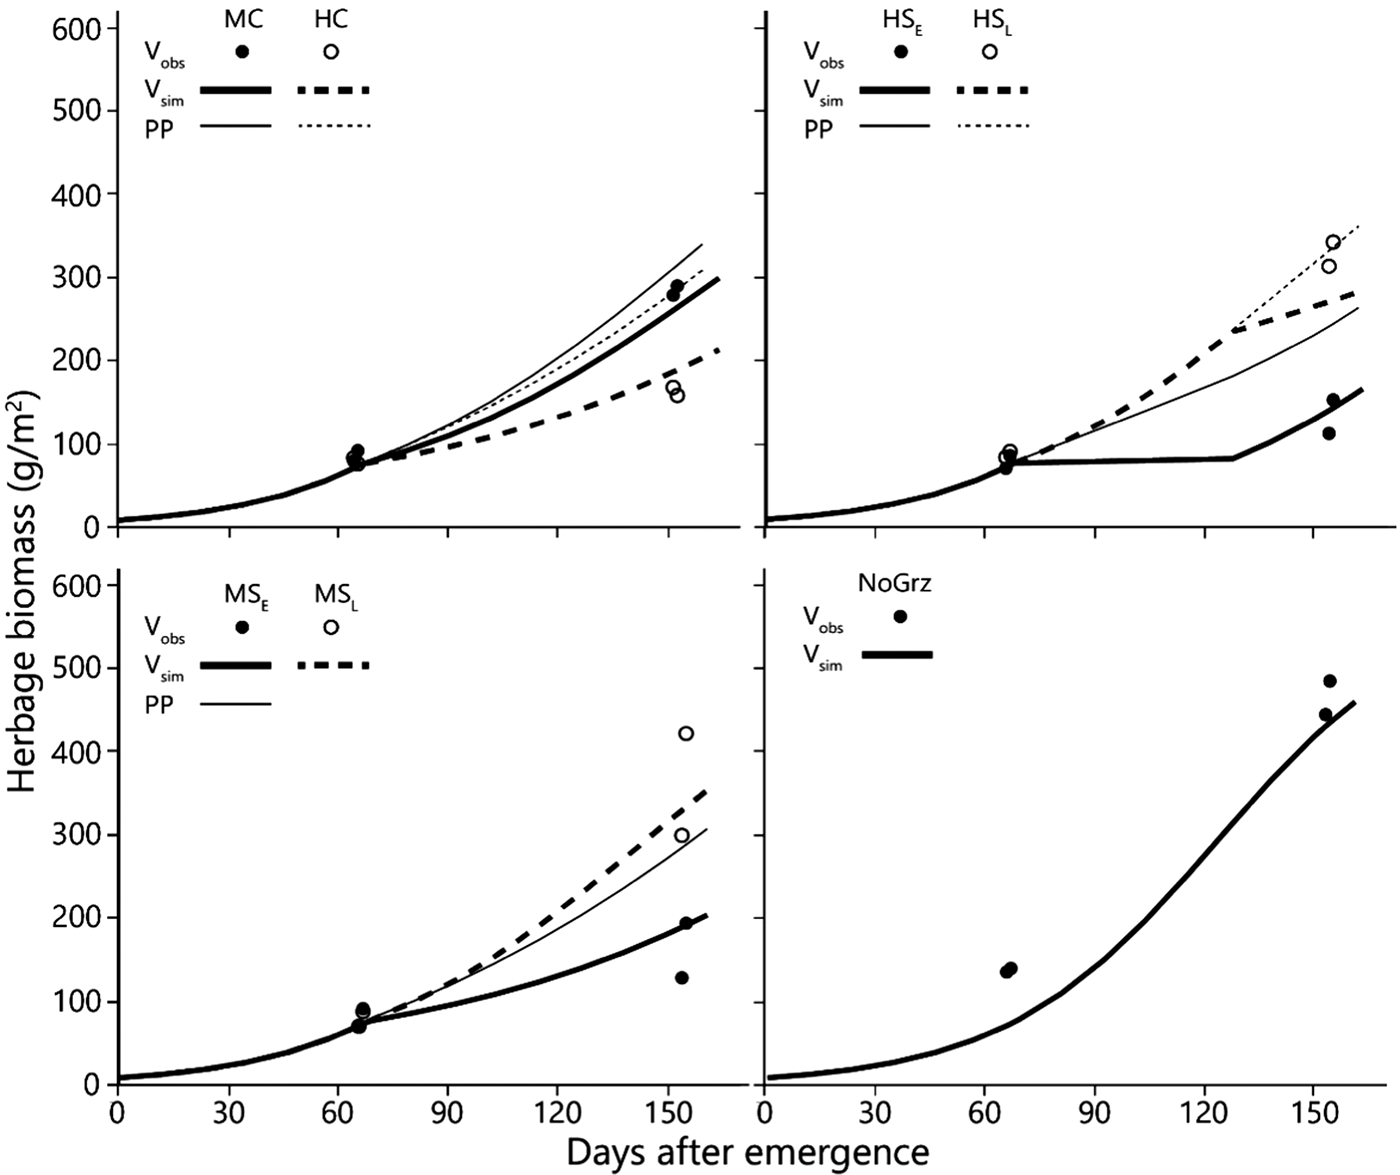
Fig. 4. Simulated and observed average total standing biomass in the treatment paddocks – for 1994–2010. Curves represent simulated biomass (V sim) and points observed biomass (V obs). All parameters in the model, except for stocking density and time of grazing, are uniform across all treatments (Table 1). Estimated primary productivity (PP) is plotted for the grazed paddocks. Treatment abbreviations: M = moderate and H = high stocking density; C = continuous and S = split-paddock grazing; subscripts E and L = early and late sub-paddock; NoGrz = ungrazed paddocks. Herbage mass is on dry matter basis.
Table 3. Divergence (dD) between individual replicates and their average compared with divergence (dM) between the model output and the replicate average
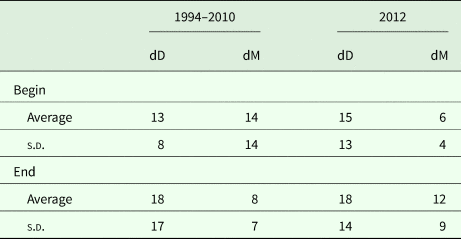
Computed for all grazing treatments and excludes data from ungrazed control areas. All quantities are represented in percentages.
Biomass in 2012
The achievement of equilibrium (sensu Noy-Meir, Reference Noy-Meir1975) requires that the rates of forage consumption and herbage growth be equal (Fig. 2). Thus, in a situation such as that described here, at a moderate stocking density of 1.5 AU/ha (‘moderate’ in Fig. 2) there would be no equilibrium in the low biomass range; at a heavier stocking density of 3 AU/ha (‘heavy’ in Fig. 2) there would be two equilibria in the low biomass range – a stable one at low biomass, and an unstable one at slightly higher biomass; and at the very heavy stocking density of 4 AU/ha (‘very heavy’ in Fig. 2) there would be only one stable equilibrium – at very low biomass.
The more intensive measurement schedule of 2012 revealed that equilibrium emerged in the field in the split heavy stocking density (Fig. 3 – V obs HSE). The biomass in the two replicate HSE sub-paddocks when grazing commenced was 63 and 93 g/m2; when grazing ended, and the herds were transferred to the HSL sub-paddocks, the biomasses were 73 and 79 g/m2, respectively. In the absence of major fluctuations in field conditions which might alter the way in which the growth and consumption functions intersect, this indicates that while the herd grazed, the standing biomasses converged from the initial values of 63 and 93 g/m2 towards the equilibrium values of 73 and 79 g/m2, respectively, and remained at those levels until the herds were transferred from the HSE to the HSL sub-paddocks. This equilibrium was maintained while the herd continued grazing because the growth rate of the herbage biomass matched the rate of herbage consumption (Fig. 3 – V sim HSE). However, this rate of herbage consumption was far below the herds’ satiation level (Fig. 2), which was why the herds had to be moved to the HSL sub-paddocks before the end of the green season. After removal of the animals from the HSE sub-paddocks, the herbage continued to grow so that by the end of the green season the biomass in the two replicate sub-paddocks reached 199 and 214 g/m2 (Fig. 3 – V obs HSE).
System responses to stocking density and grazing deferment
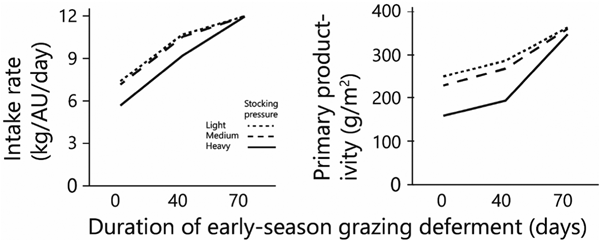
As deferment of the onset of early-season grazing increased, the duration of grazing on green herbage during the green season obviously decreased, therefore the amount of biomass available for grazing at the beginning of grazing and the standing biomass at the end of the green season both increased sharply in response to increased deferment (Figs 5(a) and (b)). The average daily intake of green herbage per AU during the green season (Fig. 6(a)) increased with length of deferment, but satiation intake throughout the grazing phase was achieved only following the longest deferment, which severely reduced the duration of the grazing phase. Consequently, biomass intake during the green season, when expressed on a per unit area basis, was similar under the various deferment treatments (Fig. 5(c)) because the higher degree of satiation that followed longer deferment was largely offset by the shorter grazing phase. Nevertheless, at all stocking densities primary productivity (biomass at end of green season + green season intake) was highest following the longest deferment (Fig. 6(b)).
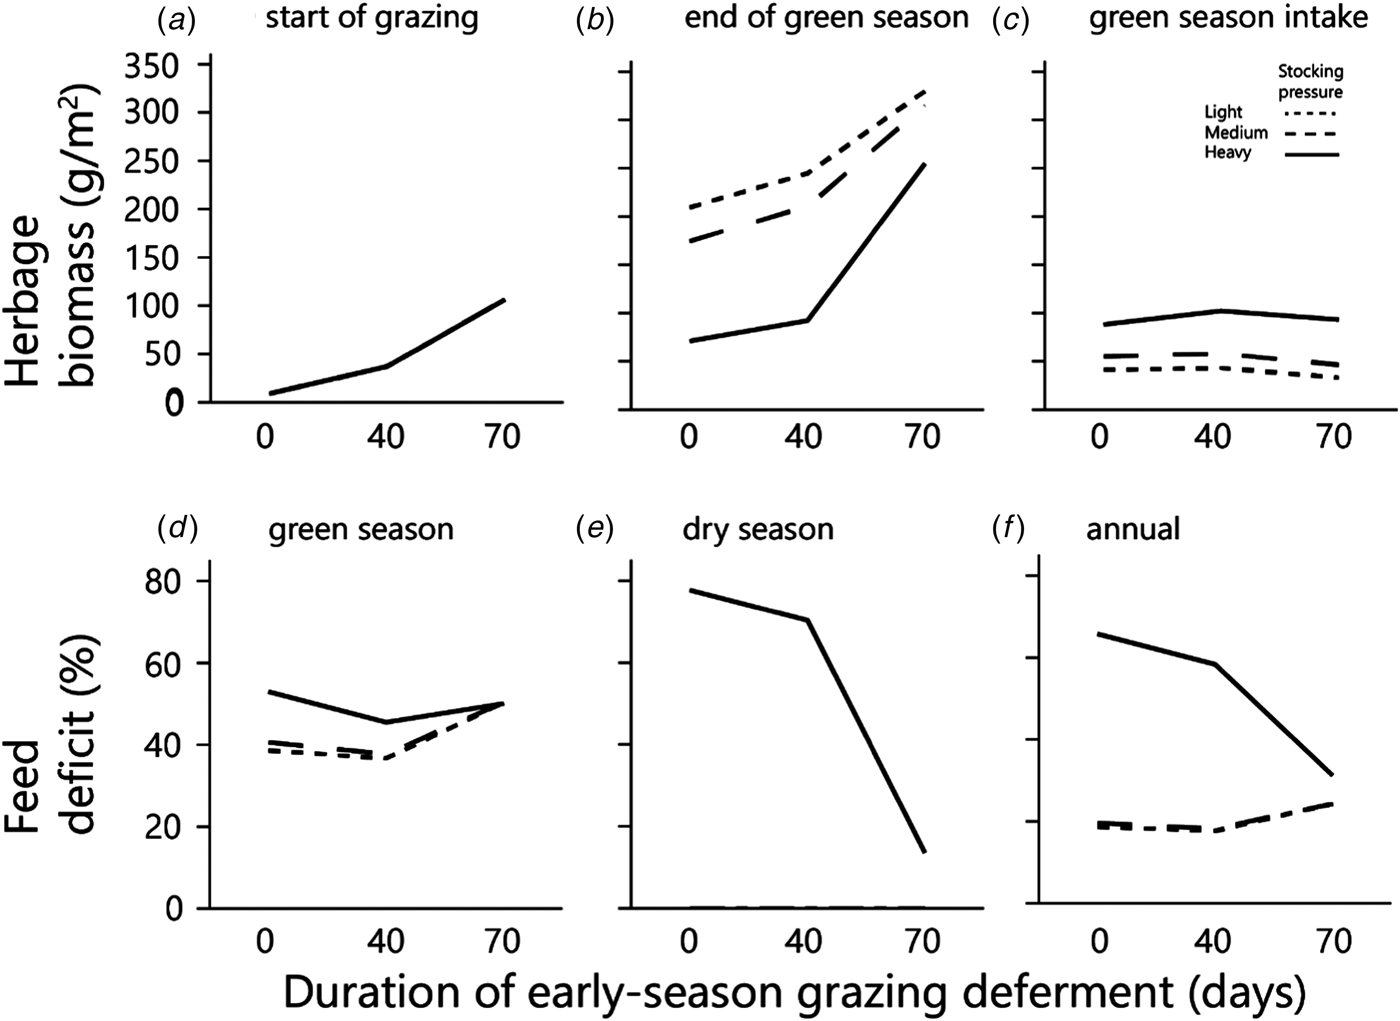
Fig. 5. The effects of grazing deferment at the beginning of the green season, and of stocking pressure on: herbage biomass (at the start of grazing and at the end of the green season); cumulative green season intake; and feed deficits as proportions of satiation requirements (for the green season, dry season and year). Note that in (a) the three curves are superimposed and in (e) the values for light and medium stocking pressures are zero at all deferments. Herbage mass is on dry matter basis.
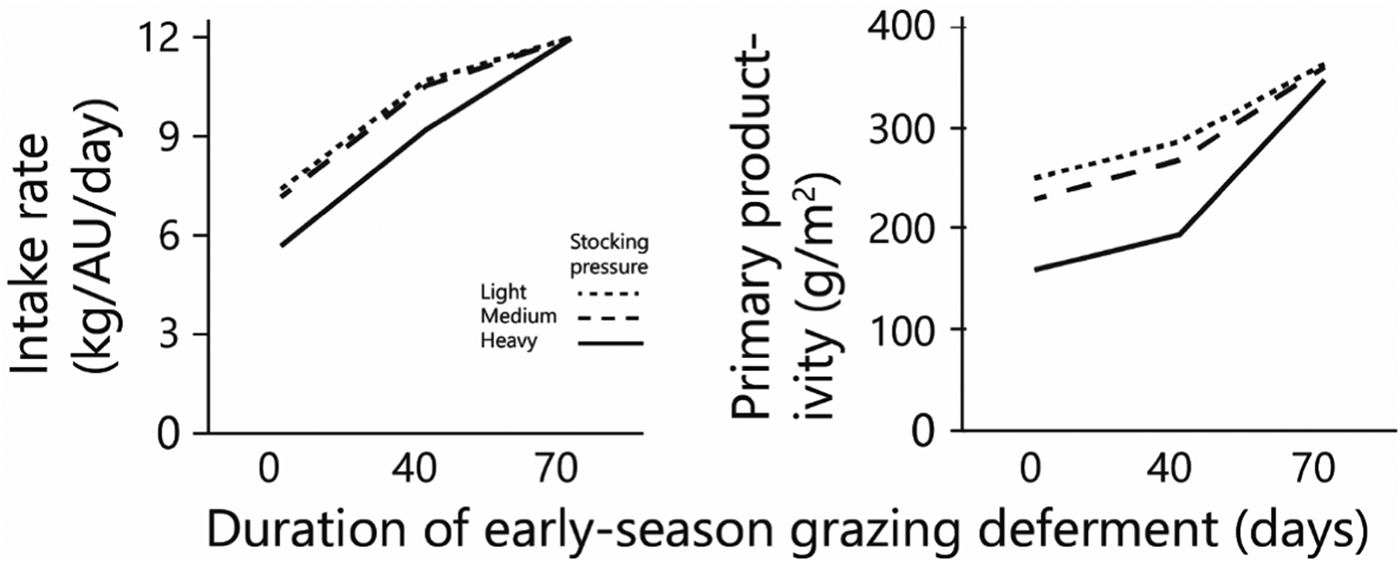
Fig. 6. Effects of grazing deferment at the beginning of the green season, and of stocking pressure on: average daily herbage intake per AU during the green season and primary productivity. Herbage mass produced and consumed is on dry matter basis.
The combination of deferment and low herbage availability at the beginning of the green season creates a nutritional deficit that normally is covered by exogenous supplementary feed. In the current study, moderate deferment decreased the green season nutritional deficit slightly (Fig. 5(d)). However, at the maximum deferment of 70 days, the deficit increased and was the same at all stocking densities. This is because there was enough herbage to provide satiation intake at all three stocking densities during the short period of grazing. The dry matter deficit associated with long deferment stemmed from the long period spent off the herbage – 70 days of the 140-days green season – during which 50% of the dry matter required during the green season accumulated (Fig. 5(a)). After long deferment, standing biomass was plentiful under all deferment treatments (Fig. 5(b)), and herds at all the monitored stocking densities could feed to satiation (Fig. 6(a)).
The amount of dry biomass available for grazing during the summer was determined largely by the amount of biomass at the end of the green season (Fig. 5(b)). This was enough to provide grazing throughout the dry season at the lower stocking densities, so that there was no summer deficit of dry biomass at these densities (Fig. 5(e)). However, at the heavy stocking density the deficit was severe under the shortest deferment, and consequential even under the longest deferment (Fig. 5(e)). The annual dry biomass deficit was <30% at the lower stocking density, and between 30 and 65% at the heavy stocking density, depending on the duration of the early-green-season deferment (Fig. 5(f)).
Total biomass production, calculated as standing biomass at the end of the green season (Fig. 5(b)) plus biomass consumed by the herds (Fig. 5(c)), increased with increasing deferment; following the longest deferment, total production converged to around 350–360 g/m2 at all three stocking densities (Fig. 6(b)).
Discussion
The two major ecological elements of Noy-Meir's simple model – herbage growth and forage consumption by the grazing animals – can be described as emergent properties that arise from all the underlying processes in the ecosystem and can be described in terms of suitably parameterized functions (Ungar and Noy-Meir, Reference Ungar and Noy-Meir1988). Most processes are contingent on the variable context of the ecosystem at any point of time. However, at a higher observed hierarchical level, some anthropogenic ecosystems (Tansley, Reference Tansley1935), such as grazed grassland, can be characterized by relatively simple functions that enable analysis that is meaningful for management of the ecosystem. This can be useful, especially in extensive, heterogeneous grasslands grazed by large herbivores; these are difficult to study in detail because of cost and logistical constraints. This difficulty is compounded by the annual climatic fluctuations and the habitat diversity of most grasslands, which has led to models that attempt to overcome the limitations of diffuse, imprecise empirical data (Wu et al., Reference Wu, Li, Stoker and Li1996).
Validity of the model
There can be considerable deviation of model results from field data, especially when the latter are derived from grazing trials with low replication. In light of the finding that divergence of the model output from the mean measured field values was lower than that between the measured replicate values and their mean value, the model output can be regarded as at least as valid as the data from the long-term field trial. This reinforces confidence in the structure of the model at the system scale of observation (Levin, Reference Levin1992) – a structure based on the three principle factors that determine the dominant responses of a managed grassland ecosystem: the grazing animal, the grazed vegetation and the system management. In the current study, the role of management was limited to determination of stocking density and timing of grazing; the influence of climate was manifested in the timing of the beginning and end of the green season.
A stable equilibrium at low biomass, as predicted for high stocking densities (Noy-Meir, Reference Noy-Meir1975), was detected in the field trial of 2012 at a very heavy stocking density of 2.2 AU/ha, which was imposed in the early sub-paddock of the high stocking density treatment (V obs HSE). For lower stocking densities, the model predicts absence of a stable equilibrium at low biomass, with the system moving towards a stable equilibrium at high biomass (Noy-Meir, Reference Noy-Meir1975). These predicted responses to stocking density at different stages of biomass accumulation were verified by the results of the 2012 field trial and add confidence to extrapolations from the model predictions.
Comparison of the graphical stability analysis and the within-season evolution of biomass must recognize that the former ignores the time dimension. The growing season may be too short for the system to complete the transition from initial conditions to the stable equilibrium point to which it is drawn, and to remain there sufficiently long to be identified as such. The current data and predictions are at least consistent with this logic. Because the transition from initial to equilibrium biomass was relatively short in the case of treatment HSE, the model correctly simulated equilibrium, whereas it correctly showed non-equilibrium conditions for all other treatments.
System responses to grazing deferment and stocking density
When applied to a range of management scenarios, the model yielded non-trivial insights into the responses of the grazing system to the interactions between stocking density and early-season grazing deferment. On the assumption that feed deficits are compensated with exogenous supplementary feed, the output of the system is proportional to the size of the herd and management will aim for an economically optimum stocking level that would depend on the ratio between meat and feed prices. When this ratio is favourable, increasing the stocking intensity during the nutritious green season could be an attractive option, even though it would involve a higher cost of supplements to the summer herbage. When the ratio is unfavourable, the preferred option would be to reduce the stocking density throughout the year, to minimize supplementary feed utilization during the summer.
A central result of the model runs was that, up to a fairly high stocking density of 0.7 AU/ha, the relative feed deficit in the green season was constant, but that in the dry season was related strongly to stocking density. At lower stocking densities, forage consumption early in the green season was too low to have a marked effect on the accumulation of herbage biomass, but supplementation was slightly decreased following moderate early-season deferment. During the dry season, stocking densities above 0.4 AU/ha necessitated increased supplementary feed; at the highest stocking density deferment decreased the need for supplements in summer.
Because the parameters of the model are derived from a representative habitat in the region, which supports numerous beef herds, the model output can indicate the consequences for management of changes in grazing deferment at various stocking densities. These consequences include changes in the planned exploitation of the herbage and in the timing and amount of supplementary feeding. At the light stocking density, there would be no biomass (crude-fibre) deficit during the summer. However, between the moderate and heavy stocking densities there is a critical stocking density above which the crude-fibre feed deficit rises very steeply. If the nutrition of the herd is based on the year-long supply of crude fibre from the herbage, and supplementary feed is restricted to providing protein and minerals when the content of these elements in the herbage is too low for optimum performance, then stocking density should not exceed that critical level of 0.7 AU/ha. This value is similar to that derived by Dieguez Cameroni and Fort (Reference Dieguez Cameroni and Fort2017) using a model based on predator-prey theory and to that of Mott (Reference Mott, Skidmore, Boyle and Raymond1960) in considering the trade-offs between production per animal and production per unit area. In the current study the annual feed deficit was lowest at the lower stocking densities of 0.4 and 0.7 AU/ha.
The way in which Noy-Meir's model was implemented in the current work did not consider stochastic processes. These would have to be expressed via the parameters of the growth and consumption functions, primarily those of growth. The parameters could be viewed as changing at the time scale of the annual cycle, or within the annual cycle, perhaps from day-to-day. In terms of the stability analysis, such variation will express itself as a wobble in the position of each equilibrium point. But substantial deviations from the average are required to induce a qualitative change in the behaviour of the model, and such ‘boom-and-bust’ variation in primary production is not observed in Mediterranean grasslands. Under such conditions stocking densities would have to be adaptive, which is beyond the scope of the Noy-Meir model.
Conclusions
Despite the highly variable nature of field data, annual grassland systems have emergent properties at the observed hierarchical level that can be quantified on the basis of a limited set of empirical data. With these quantified values and a relatively simple model, the biomass dynamics of the herbage and the potential intake of forage by livestock can be predicted well within the accuracy of the empirical data. This approach facilitates extrapolation of limited and diffuse empirical data derived from grazing management to a wider range of management possibilities. These quantified properties also provide a basis for determining the effects of habitat differences on the responses of grazing to management practices. Above all, a model using these parameters can provide an interesting perspective on system behaviour that cannot be derived directly from the data on which it is based.
Acknowledgements
The authors are grateful to Tzadok Cohen, Yehuda Yehuda, Haim Gorelik and Rafi Yonatan for their efficient long-term execution of the laborious field work. The authors are grateful for three reviews that spurred significant improvements to the manuscript.
Financial support
The research was funded by the Chief Scientist of the Israeli Ministry of Agriculture and Rural Development and by the Rangeland Committee of the Soil Conservation Division of the Israeli Ministry of Agriculture and Rural Development.
Conflict of interest
None.
Ethical standards
Not applicable.


