Pneumonia is among the most common and potentially avoidable complications that occur among ventilated patients in intensive care units (ICUs). It is associated with prolonged length of hospital stay and increased hospital mortality, especially if it is caused by multidrug-resistant pathogens.Reference Chastre and Fagon1, Reference Hunter2 Thus, understanding the risks for ventilator-associated pneumonia (VAP) and identifying high-risk patients is clinically important.
Appropriate statistical models to evaluate the risks for VAP are needed because the definition as well as the occurrence of VAP are closely connected with several time-related issues. First, VAP is defined as pneumonia occurring in a mechanically ventilated patient after 48 hours of endotracheal intubation.Reference Chastre and Fagon1, Reference Hunter2 It is common practice in randomized clinical trialsReference Philippart, Gaudry and Quinquis3 as well as in epidemiological studies (eg, studies following the protocol of the European Centre for Disease prevention and Control4) to consider the at-risk time for VAP as the period between 48 hours after intubation and 48 hours after extubation. This at-risk time is directly linked to ‘ventilator-days at risk’ as the appropriate denominator in calculating VAP rates.Reference Eggimann, Hugonnet, Sax, Touveneau, Chevrolet and Pittet5 To account for the at-risk time, commonly used statistical models (eg, Kaplan-Meier techniques and standard Cox proportional hazard models) are applied.Reference Philippart, Gaudry and Quinquis3 However, such models fail to account for competing events, which leads to overestimated risks.Reference Wolkewitz6, Reference Wolkewitz, Cooper, Bonten, Barnett and Schumacher7 Second, reintubation (especially after unsuccessful extubation) and multiple ventilation episodes are considered risk factors for VAP.Reference Torres, Gatell, Aznar and El-Ebiary8, Reference Gao, Yang and He9 Third, the presence of an endotracheal tube is the principle risk factor for VAP, and the cumulative risk increases with the duration of mechanical ventilation.Reference Hunter2 However, previous studies have found that the VAP hazard rate decreases over ventilation time.Reference Cook10 Finally, the length of stay in the hospital and intensive care unit (ICU) before intubation might impact the characteristic of VAP because patients who have been in the hospital for ≥2 days before intubation are more likely to be colonized with multidrug-resistant pathogens.Reference Hunter2
In this study, we aimed to provide and apply an appropriate statistical model to study the risks for VAP. Specifically, we accounted for duration of mechanical ventilation as at-risk time, competing events, preintubation length of hospital or ICU stay, multiple ventilation episodes, and other important and potential confounding factors. We focused on the challenging task of interpreting the results from a competing-risks analyses.
Materials and methods
Spanish ICU data
We used a multicenter database from the Spanish surveillance network HELICS-ENVIN (http://hws.vhebron.net/envin-helics/), embedded in the HELICS project (Hospitals in Europe Link for Infection Control through Surveillance).Reference Lopez-Pueyo, Olaechea-Astigarraga, Palomar-Martinez, Insausti-Ordenana, Alvarez-Lerma and Group11 We included ICUs that contributed to the registry between January 2006 and June 2011, and we included only ventilated adult patients who stayed at least 2 days in an ICU, due to the definition of hospital-acquired infections. Up to 3 ventilation episodes were considered. Ventilation episodes following a VAP were excluded for the following reasons: (1) because VAP was not specified as the reason for ventilation; (2) to avoid noncausal artefacts; and (3) to ensure a true incident VAP outcome. The study population contained 158 ICUs with 45,486 admissions, 48,705 ventilation episodes, and 314,196 ventilator days. This Deutsche Forschungsgemeinschaft (DFG) research project was approved by the Ethics committee of University Medical Center Freiburg, Germany.
Statistical methods
The time from 48 hours after first intubation until the occurrence of VAP (event of interest) or 48 hours after extubation (competing event) was studied using a competing-risks analysis, without administrative censoring. We estimated the actual hazard rates for VAP and 48 hours after extubation (hereafter termed extubation) in dependency of duration of ventilation as the at-risk time. The cumulative incidences of both events were estimated using the Aalen-Johansen method.Reference Beyersmann, Allignol and Schumacher12
For each event (ie, VAP occurrence or extubation), a separate cause-specific hazard analysis was performed via Cox proportional hazards models to explore etiological associations. For VAP as the event of interest, an adapted Cox regression analysis (the Fine and Gray modelReference Fine and Gray13) was performed to calculate subdistribution hazard ratios (sHRs) and to study the summary effects on the cumulative incidence of VAP. All regression models were stratified by ICU. For multiple ventilation episodes, the time in ICU before ventilation was updated. Because the update led to a correlation between the episode variable and time in the ICU before ventilation, only 3 main variables of interest were included: ie, time in ICU before mechanical ventilation, time in hospital before ICU admission, and multiple episodes. However, the following variables were further included to adjust for confounding: APACHE II score measured at ICU admission, age, gender, trauma, diagnosis (eg, respiratory, gastrointestinal, central nervous system, cardiovascular, and other diagnoses), antibiotic treatment 48 hours before and/or after ICU admission, and calendar year of admission. In all regression models, we used robust variance estimation to account for data clustering regarding multiple ventilation episodes.
Results
Among all 48,705 ventilation episodes in the ICU, 3,655 patients (7.45%) developed a VAP during their stay (Table 1). Figure 1 illustrates the time-dependent data structure of 100 randomly sampled patients. Time origin is the start of mechanical ventilation. The corresponding time periods, marked as black lines for hospitalization before ICU admission and as gray lines for time in ICU before ventilation were entered into the Cox regression models as covariates. The gray line after time 0 shows the duration of ventilation at risk for VAP; this time is modeled as an outcome variable in the Cox regression models.
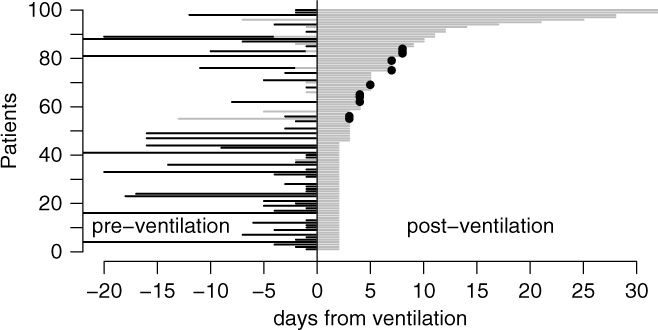
Fig. 1. Graphical visualization of a random sample of 100 patients. Time origin is the start of mechanical ventilation. The corresponding time periods are marked as black (hospitalization before ICU admission) and gray lines (time in ICU before ventilation). The gray line after time 0 shows the duration of ventilation at risk for VAP. The dots show the occurrence of VAP. Extubation without VAP occurs if the gray line ends without a dot.
Table 1. Description of Study Population
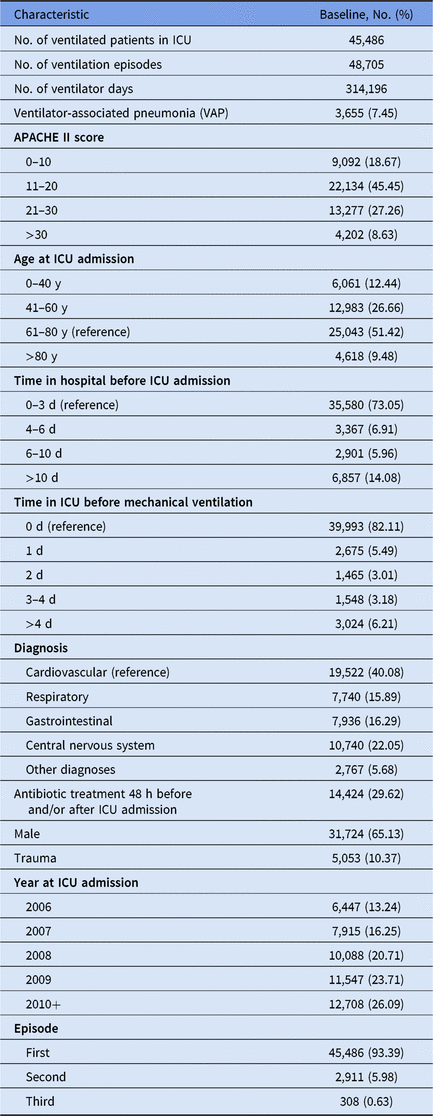
Note. ICU, intensive care unit.
Hazard rates
Figure 2 shows the duration-dependent hazard rates of VAP and extubation, which are interpreted as the instantaneous daily risk of experiencing the corresponding event VAP or extubation without VAP. Interestingly, the hazard rate of VAP is low but increasing for earlier duration days, and after 5 duration days the hazard rate is decreasing. In contrast, the extubation rate only decreases, which means that most ventilated patients received short-term ventilation (2–4 days) without acquiring VAP.
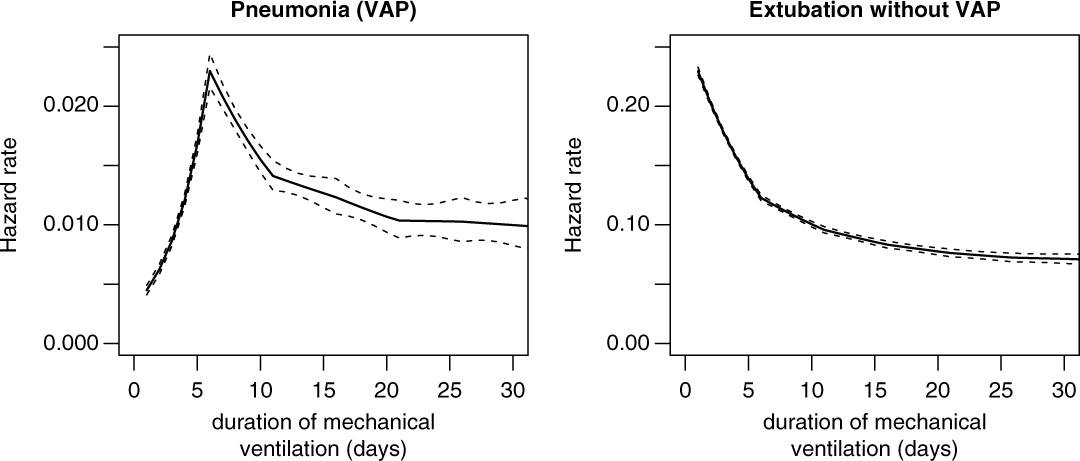
Fig. 2. Hazard rates for ventilator-associated pneumonia (VAP) and extubation without VAP.
Cumulative risks
The cumulative risk for VAP (Fig. 3, left, black line) depends on both hazard rates. The duration-dependent proportion of ventilated patients have acquired a VAP by duration day t. Analogously, the cumulative risk of extubation is estimated (Fig. 3, right, black line), and the duration-dependent proportion of ventilated patients have been extubated by duration day t. For instance, after duration day 15, ∼6% of ventilated patients have acquired a VAP whereas ∼80% have been extubated without VAP. The sum of the 2 black curves in Figure 3 do not exceed 100%; thus, the remaining ∼14% is the proportion of ventilated patients who are still ventilated after 15 days. In contrast, the 1-Kaplan-Meier estimates predicts a biased VAP risk of ∼20% at day 15 (Fig. 3, left, gray line) and ∼85% for extubation (Fig. 3, right, gray line); thus, the sum already exceeds 100%. This commonly used approach handles extubated patients as noninformative censored observations. The estimated cumulative risk for VAP is biased upward because the underlying model of noninformative censoring assumes that extubated patients have the same VAP hazard as intubated patients. This assumption is contradicted by the definition of VAP.
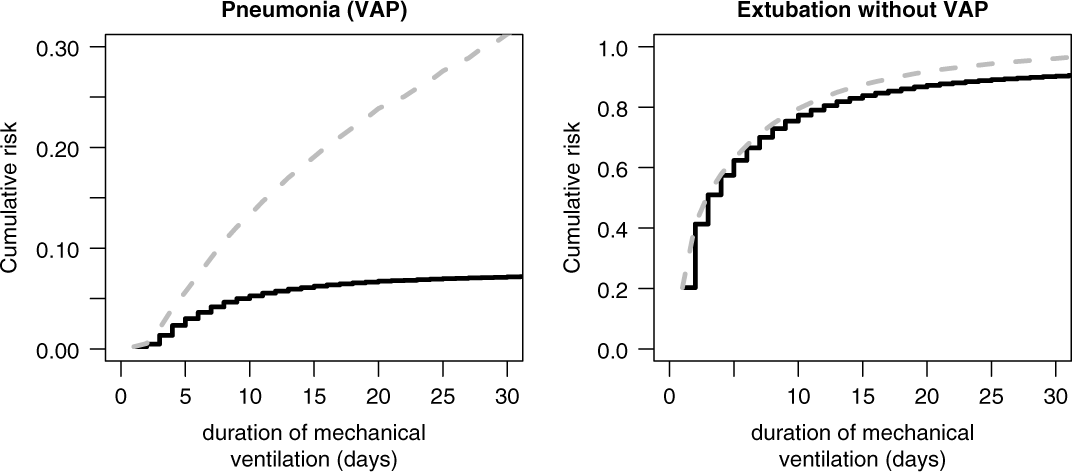
Fig. 3. Cumulative risk (incidence) of ventilator-associated pneumonia (VAP) and extubation without VAP, accounting for competing events (black) versus treated as censored (gray).
Regression models
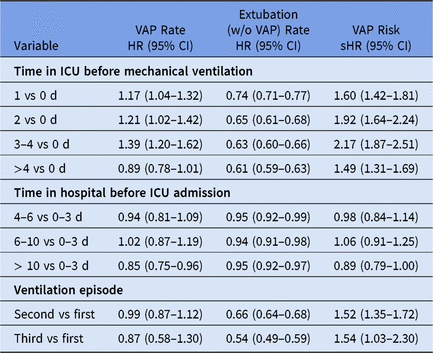
The event-specific Cox regression models provide hazard ratios (HRs) for VAP and extubation (Table 2). Regarding the VAP event, the time in ICU before mechanical ventilation is associated with an increased VAP hazard rate. For instance, the hazard for VAP increased by 39% for patients who stayed 3–4 days in the ICU before ventilation compared to patients who received ventilation at the day of ICU admission (adjusted HR, 1.39; 95% CI, 1.20–1.62). In other words, the longer a patient has stayed in ICU before tube insertion the higher the daily risk to acquire a VAP (direct effect). Furthermore, the competing-risk analysis for the other event shows that the time in ICU before ventilation is also associated with an decreased extubation rate. For instance, patients who stayed 3–4 days in ICU before ventilation have a 37% lower discharge hazard compared to patients who received ventilation at the day of ICU admission (adjusted HR, 0.63; 95% CI, 0.60–0.66). Thus, patients with long stays before tube insertion require longer intubations. Hence, this indirect prolongation of intubation increases the at-risk time to eventually acquire VAP. Therefore, the effect is more pronounced in terms of cumulative risk for VAP (see sHRs in Table 2). Thus, the cumulative risk for VAP increased by 117% for patients who stayed 3–4 days in the ICU before ventilation compared to the reference (adjusted sHR, 2.17; 95% CI, 1.87–2.51). In contrast, such a trend is not observed for the time spent in the hospital before ICU admission, even though patients with longer hospitalizations before ICU admission tend to stay intubated longer without VAP development (Table 2).
Table 2. Time-Related Factors Associated With Ventilator-Associated Pneumonia (VAP) and Extubationa
Note. HR, hazard ratio; sHR, subdistribution hazard ratio; ICU, intensive care unit.
a All (subdistribution) hazard ratios are adjusted for APACHE II score, age, diagnosis (respiratory, gastrointestinal, central nervous system, cardiovascular and other diagnoses), antibiotic treatment 48 h before and/or after ICU admission, gender and trauma; stratified for intensive care units. Analysis is based on 48,705 ventilation episodes of 45,486 patients.
Figure 4 (left) shows the cumulative risks for VAP stratified by time in the ICU before mechanical ventilation. These effects correspond to the unadjusted sHR. For instance, for patients who stayed 3–4 days in the ICU before ventilation, the sHR is 2.03 (95% CI, 1.76–2.33) compared to reference.
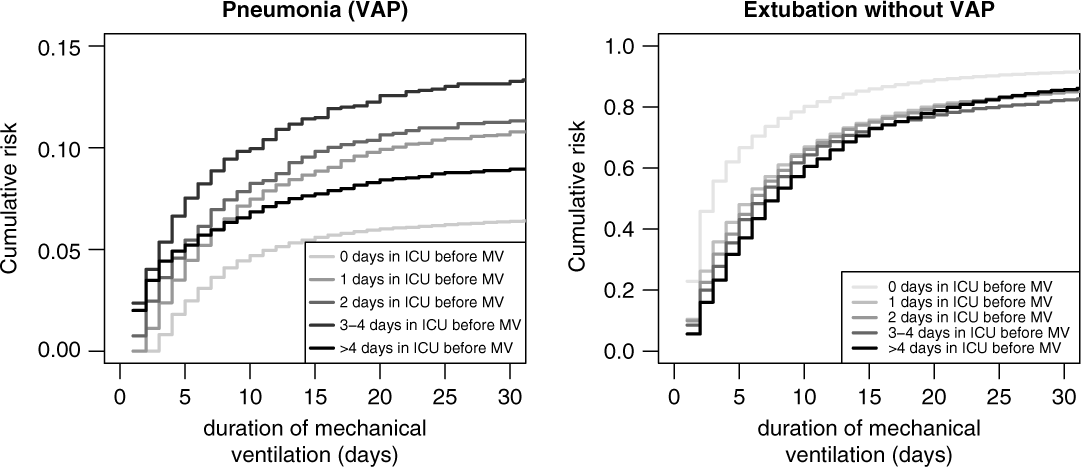
Fig. 4. Cumulative risk (incidence) of ventilator-associated pneumonia (VAP) and extubation without VAP, stratified by days in ICU before mechanical ventilation.
Figure 5 shows the cumulative risks for VAP stratified by first, second, and third ventilation episodes and indicate the increased risk of the second and third episodes. The corresponding unadjusted sHR was 1.52 (95% CI, 1.35–1.72) comparing the second episode versus the first episode and the sHR was 1.47 (95% CI, 0.99–2.18) comparing the third episode versus the first episode. These effects remained stable after adjusting for the potential confounders APACHE II score, age, gender, trauma, diagnosis, antibiotic treatment, and calendar year of admission. The corresponding adjusted sHRs in Table 2 are 1.52 (95% CI, 1.35–1.72) for the second versus the first episode and 1.54 (95% CI, 1.03–2.30) for the third versus the first episode.
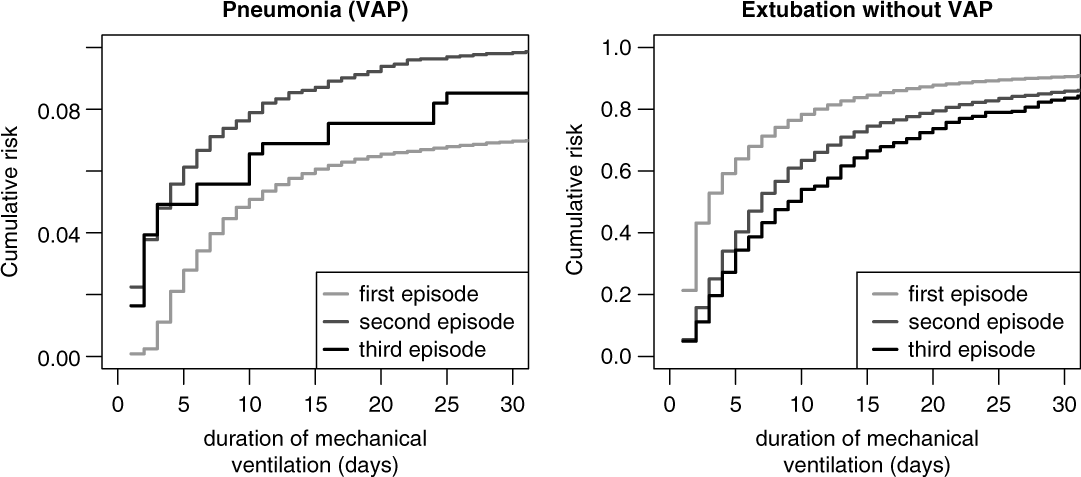
Fig. 5. Cumulative risk (incidence) of ventilator-associated pneumonia (VAP) and extubation without VAP, stratified by episode.
Finally, we emphasize that it is a common practice to interpret the HRs for VAP as risk ratios. However, as demonstrated here, risk factors have often strong indirect effects on extubation; thus, VAP hazard ratios usually differ from the sHRs, which do actually compare risks.
Discussion
To our knowledge, this is the first competing-risk analysis for VAP to study the impact of hospitalization/ICU stay, duration of ventilation, and multiple episodes in a large intensive care population. In competing-risks settings, the summary effect of a risk factor can be decomposed into 2 effects: a direct effect regarding the event of interest (ie, VAP) and an indirect effect regarding the competing event (ie, extubation).Reference Wolkewitz, von Cube and Schumacher14 Thus, a competing-risk analysis is necessary to quantify the indirect effect of intubation time on the cumulative VAP risk. We found that time in ICU before mechanical ventilation is directly associated with an increased VAP hazard as well as indirectly with a decreased extubation hazard. No such effects have been detected for the time spent in hospital before ICU admission. We also found that multiple episodes have an indirect effect on the risk for VAP due to prolonged ventilation. Accounting for extubation as a competing event for VAP is also necessary to estimate cumulative risk of VAP depending on duration of ventilation. In contrast, treating extubation as censored leads to values that could be interpreted as the hypothetical ‘probability of VAP by duration of ventilation if the possibility of extubation could be removed.’ This is a highly controversial approach with a debatable assumption.Reference Pepe and Mori15
We estimated the hazard rate for VAP depending on duration of ventilation. Our findings coincide with some published results. For instance, CookReference Cook10 found that the hazard rate for VAP decreased over time: VAP rates were ∼3% per day in the first week of ventilation, 2% per day in the second week, and 1% per day in the third week and thereafter. In their study, early-onset VAP accounted for as many as 50% of cases of VAP. We estimated a similar shape of the VAP hazard rate. However, we emphasize that the estimation of the extubation hazard rate is also of importance because it indirectly determines the cumulative VAP risk.
Patients who have been in the hospital for 2 or more days before intubation have a higher VAP risk regardless of the duration of ventilation.Reference Hunter2 We distinguished the preintubation time between general hospital and intensive care and found that it is rather the time in ICU than the time in the general ward. In addition, our results indicate that the risk for VAP is higher during the second and third episodes of ventilation. Such effects, even though much less pronounced, have been reported in previous studies.Reference Torres, Gatell, Aznar and El-Ebiary8, Reference Gao, Yang and He9
The study had following limitations. First, extubation documentation did not indicate whether it was a planned or unplanned extubation. Such a distinction would have been interesting for studying the effect of reintubation in more detail. Second, we included only adults in this analysis. Thus, the results cannot be generalized to pediatric populations. In this study, we did not distinguish between early or late onset of VAP. To investigate late-onset VAP occurring after 4 days of intubation and mechanical ventilation,Reference Hunter2 conditional models should be used.Reference Wolkewitz, Zortel, Palomar-Martinez, Alvarez-Lerma, Olaechea-Astigarraga and Schumacher16 Therefore, for late-onset VAP, a statistical analysis must account for the fact that patients have to be ventilated at least 4 days without acquiring a VAP; patients who acquire an early-onset VAP or were extubated within four days are not at-risk for late-onset VAP.Reference Wolkewitz, Zortel, Palomar-Martinez, Alvarez-Lerma, Olaechea-Astigarraga and Schumacher16 Many patients receive short-term ventilation (Fig. 1) and are therefore excluded from the risk set, and the cumulative risk of late-onset VAP is greater than that for early- and late-onset VAP combined (data not shown).
In conclusion, we hope that our approach leads to a better risk understanding of VAP. This information may guide physicians to improve medical decisions related to the harms and benefits of the duration of ventilation.
Acknowledgments
We thank all the participating ICUs for their invaluable contribution to the data collection.
Financial support
This study was funded by the German research foundation Deutsche Forschungsgemeinschaft (grant No WO 1746/1–2).
Conflicts of interest
All authors report no conflicts of interest relevant to this article.


