1 Introduction
Recently, the short-wavelength coherent light source has been advanced based on the technologies of laser high-order harmonic generation[Reference Midorikawa1–Reference Zhao, Zhang, Chini, Wu, Wang and Chang3] and free-electron lasers[Reference Yabashi, Tanaka, Tanaka, Tomizawa, Togashi, Nagasono, Ishikawa, Harries, Hikosaka, Hishikawa, Nagaya, Saito, Shigemasa, Yamanouchi and Ueda4, Reference Emma, Akre, Arthur, Bionta, Bostedt, Bozek, Brachmann, Bucksbaum, Coffee, Decker, Ding, Dowell, Edstrom, Fisher, Frisch, Gilevich, Hastings, Hays, Hering, Huang, Iverson, Loos, Messerschmidt, Miahnahri, Moeller, Nuhn, Pile, Ratner, Rzepiela, Schultz, Smith, Stefan, Tompkins, Turner, Welch, White, Wu, Yocky and Galayda5]. An ultrashort pulse in the vacuum-ultraviolet (VUV) or extreme-ultraviolet (EUV) region is a powerful tool to monitor electronic dynamics through photoelectron spectroscopy and photoabsorption spectroscopy[Reference Suzuki6–Reference Ott, Kaldun, Raith, Meyer, Laux, Evers, Keitel, Greene and Pfeifer9]. A VUV pulse is also useful to monitor strongly excited solid states with high densities of excited electrons. Since the plasma resonance frequency is proportional to the square root of the density of excited electrons in a solid, a shorter wavelength can probe a higher electronic density. Considering the plasma resonance at ![]() ${\it\lambda}=160$ nm, the electron density is estimated to be
${\it\lambda}=160$ nm, the electron density is estimated to be ![]() $4\times 10^{22}~\text{W}~\text{cm}^{-2}$, which is of the same order of magnitude as the atomic density in transparent dielectrics such as fused silica (FS). In such an electron density, the plasma is formed and used as a mirror with a function of ultrafast optical switching[Reference Kapteyn, Szoke, Falcone and Murnane10–Reference Thaury, Quere, Geindre, Levy, Ceccotti, Monot, Bougeard, Reau, d’Oliveira, Audebert, Marjoribanks and Martin12].
$4\times 10^{22}~\text{W}~\text{cm}^{-2}$, which is of the same order of magnitude as the atomic density in transparent dielectrics such as fused silica (FS). In such an electron density, the plasma is formed and used as a mirror with a function of ultrafast optical switching[Reference Kapteyn, Szoke, Falcone and Murnane10–Reference Thaury, Quere, Geindre, Levy, Ceccotti, Monot, Bougeard, Reau, d’Oliveira, Audebert, Marjoribanks and Martin12].
Although a VUV pulse is obtained as a high-order harmonic by just focusing an intense femtosecond laser pulse into a gaseous medium, the characterization of a VUV pulse around ![]() ${\it\lambda}=100$ nm is still a demanding task. Attosecond streaking with a carrier-envelope-phase stabilized laser pulse[Reference Itatani, Quere, Yudin, Ivanov, Krausz and Corkum13–Reference Mairesse and Quere15] cannot be adopted because the one-photon energy in the VUV region is below the ionization thresholds of stable atoms and molecules. Frequency-resolved optical gating (FROG) using two-photon ionization photoelectron spectroscopy was once the only solution to fully characterize a VUV waveform[Reference Sekikawa, Kanai and Watanabe16, Reference Kosuge, Sekikawa, Zhou, Kanai, Adachi and Watanabe17].
${\it\lambda}=100$ nm is still a demanding task. Attosecond streaking with a carrier-envelope-phase stabilized laser pulse[Reference Itatani, Quere, Yudin, Ivanov, Krausz and Corkum13–Reference Mairesse and Quere15] cannot be adopted because the one-photon energy in the VUV region is below the ionization thresholds of stable atoms and molecules. Frequency-resolved optical gating (FROG) using two-photon ionization photoelectron spectroscopy was once the only solution to fully characterize a VUV waveform[Reference Sekikawa, Kanai and Watanabe16, Reference Kosuge, Sekikawa, Zhou, Kanai, Adachi and Watanabe17].

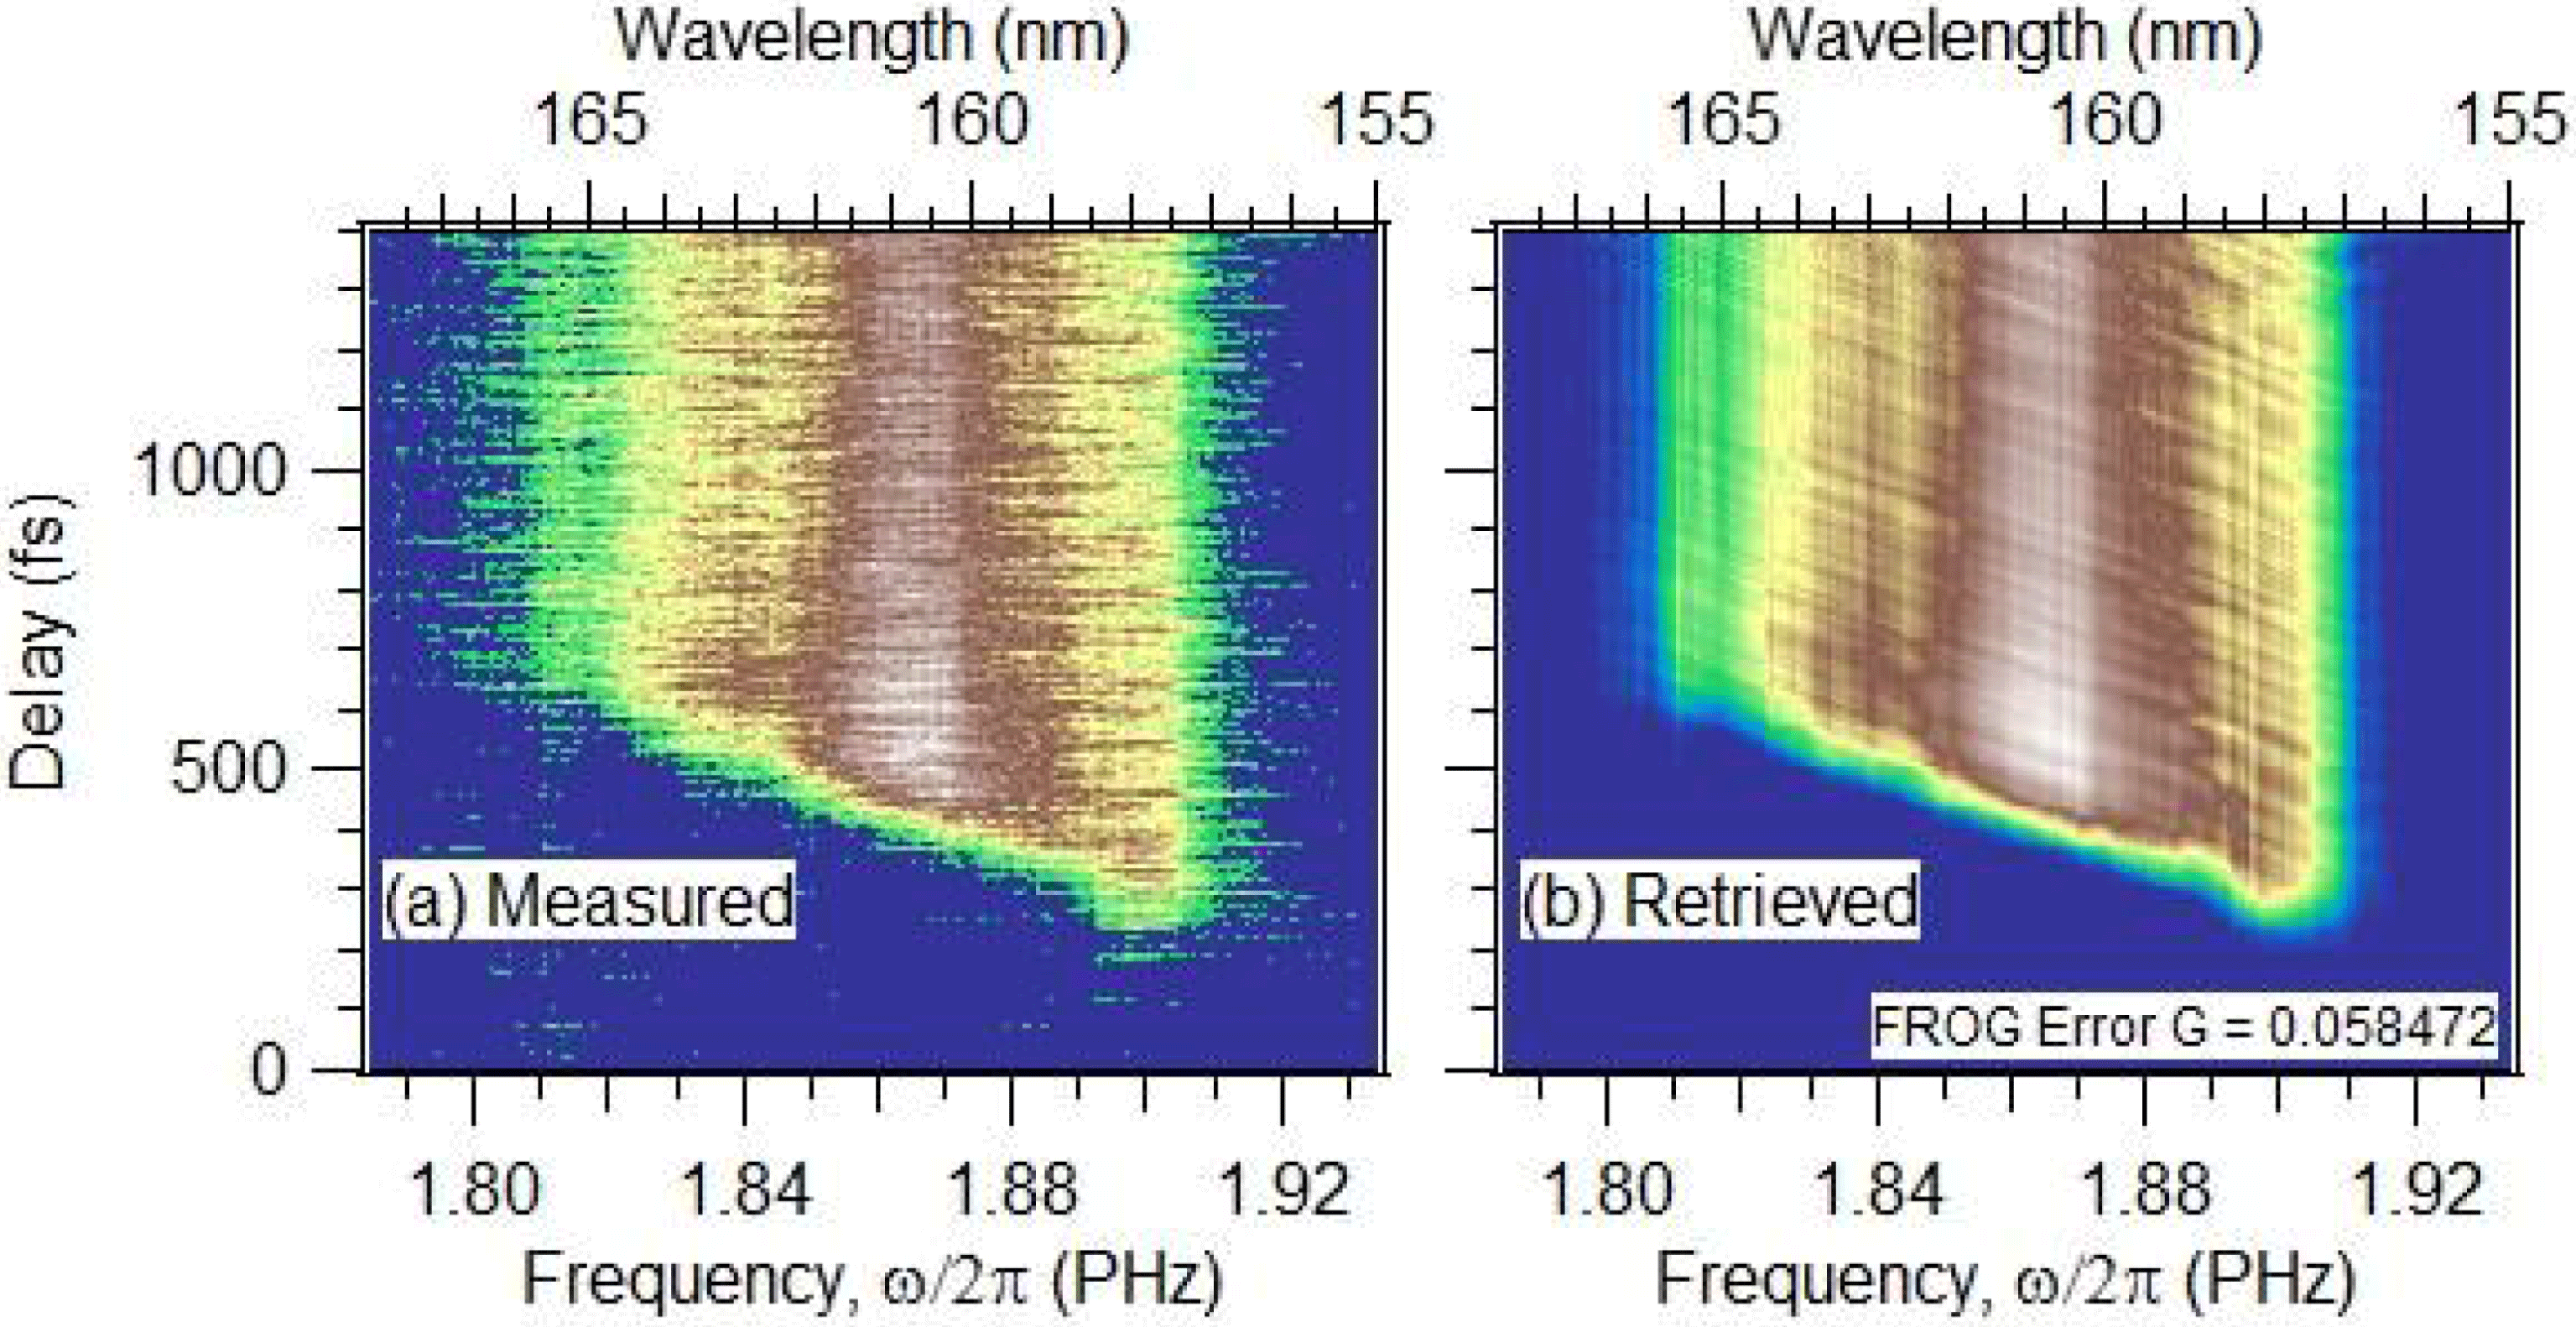
Figure 1. (a) Measured plasma-mirror FROG trace. The VUV pulse generated in the Ar cell passes the LiF lens prior to the plasma-mirror reflection. (b) FROG trace retrieved with the LSGPA. The FROG error is ![]() $G=0.058472$. The size of the FROG traces is
$G=0.058472$. The size of the FROG traces is ![]() $256\times 210$ pixels.
$256\times 210$ pixels.
Recently, however, we proposed an alternative method to characterize a VUV waveform without photoelectron measurement[Reference Itakura, Kumada, Nakano and Akagi18]. The spectrum of a VUV pulse reflected from a plasma mirror is measured in a time-resolved manner. We call this method plasma-mirror FROG. It was demonstrated that the principal component generalized projections algorithm (PCGPA)[Reference Kane19], which is one of the algorithms to extract two unknown waveforms from a cross-correlation-type FROG trace, can be applicable to retrieval of the time-resolved VUV reflection spectrum of a plasma mirror. However, the PCGPA in the analysis of a plasma-mirror FROG trace contains an aliasing problem because the time-dependent reflectivity is not a ‘gate’ function, but a ‘step’ function. A slightly complicated procedure is required to solve it. In addition, the PCGPA requires a long computational time for the iterative calculation to obtain an acceptably small FROG error, suggesting that it may not be practical to check the VUV waveform in the course of an experiment.
In this study, we update the FROG analysis procedure by using the least-square generalized projections algorithm (LSGPA)[Reference Gagnon, Goulielmakis and Yakovlev20] in place of the PCGPA, and demonstrate that the updated FROG analysis procedure has no aliasing problem. In addition, since the computational cost is reduced significantly, the plasma-mirror FROG trace can be retrieved efficiently even when the chirped pulse duration is as long as 1 ps.
2 Experimental
Details of the experimental setup used in this study are described elsewhere[Reference Itakura, Kumada, Nakano and Akagi18]. Briefly, a VUV pulse with ![]() ${\it\lambda}\sim 160$ nm is obtained through fifth-order harmonic generation using an output pulse from a Ti:sapphire chirped pulse amplification system (795 nm, 60 fs FWHM, 10 Hz, 10 mJ/pulse). The nonlinear medium for harmonic generation is Ar in a gas cell. The fifth harmonic pulse and the fundamental pulse are collimated by a LiF lens with a 2.3 mm thickness, separated by a multilayer mirror for 160 nm reflection. The optical path length of the fundamental pulse is changed with a linear translational stage. The two pulses are collinearly combined by another multilayer mirror for 160 nm reflection and focused on an FS surface. The reflected VUV pulse is guided to a VUV spectrometer with an imaging detector for single-shot spectrum measurement. The VUV spectrum is recorded as a function of the delay of the VUV pulse with respect to the fundamental pulse, which makes a plasma mirror on the FS surface. The intensity of the fundamental pulse is controlled by changing the diameter of the iris in the middle of the delay line so that the fluence is just above the ablation threshold of
${\it\lambda}\sim 160$ nm is obtained through fifth-order harmonic generation using an output pulse from a Ti:sapphire chirped pulse amplification system (795 nm, 60 fs FWHM, 10 Hz, 10 mJ/pulse). The nonlinear medium for harmonic generation is Ar in a gas cell. The fifth harmonic pulse and the fundamental pulse are collimated by a LiF lens with a 2.3 mm thickness, separated by a multilayer mirror for 160 nm reflection. The optical path length of the fundamental pulse is changed with a linear translational stage. The two pulses are collinearly combined by another multilayer mirror for 160 nm reflection and focused on an FS surface. The reflected VUV pulse is guided to a VUV spectrometer with an imaging detector for single-shot spectrum measurement. The VUV spectrum is recorded as a function of the delay of the VUV pulse with respect to the fundamental pulse, which makes a plasma mirror on the FS surface. The intensity of the fundamental pulse is controlled by changing the diameter of the iris in the middle of the delay line so that the fluence is just above the ablation threshold of ![]() $3.3~\text{J}~\text{cm}^{-2}$ (Ref. [Reference Kumada, Akagi, Itakura, Otobe and Yokoyama21]). In the experiment using an intentionally chirped VUV pulse, a
$3.3~\text{J}~\text{cm}^{-2}$ (Ref. [Reference Kumada, Akagi, Itakura, Otobe and Yokoyama21]). In the experiment using an intentionally chirped VUV pulse, a ![]() $\text{CaF}_{2}$ plate of 2 mm thickness is inserted between the two multilayer mirrors for 160 nm reflection. After the plasma-mirror FROG measurement, a microscopic image of the FS surface is taken and shows the formation of clean elliptical craters. The size of each crater is 33
$\text{CaF}_{2}$ plate of 2 mm thickness is inserted between the two multilayer mirrors for 160 nm reflection. After the plasma-mirror FROG measurement, a microscopic image of the FS surface is taken and shows the formation of clean elliptical craters. The size of each crater is 33 ![]() ${\rm\mu}$m high and 60
${\rm\mu}$m high and 60 ![]() ${\rm\mu}$m wide[Reference Itakura, Kumada, Nakano and Akagi18]. Since the diffraction limit of the focal spot size is proportional to the wavelength, the focal spot of the VUV pulses on the FS surface is expected to be smaller than the crater size. Therefore, the spatial distribution of the plasma mirror does not influence the present result.
${\rm\mu}$m wide[Reference Itakura, Kumada, Nakano and Akagi18]. Since the diffraction limit of the focal spot size is proportional to the wavelength, the focal spot of the VUV pulses on the FS surface is expected to be smaller than the crater size. Therefore, the spatial distribution of the plasma mirror does not influence the present result.
3 Retrieval of plasma-mirror FROG traces with the LSGPA
In this study, we adopt the LSGPA in place of the PCGPA to improve the procedure of plasma-mirror FROG analysis. The VUV spectrogram of the plasma-mirror reflection is experimentally obtained as shown in Figure 1(a), where only the increase in the reflectivity ![]() $R(t)$ with respect to the Fresnel reflectivity
$R(t)$ with respect to the Fresnel reflectivity ![]() $R_{0}$ of the unexcited FS surface, that is
$R_{0}$ of the unexcited FS surface, that is ![]() $R(t)-R_{0}$, is taken into account. The procedure of the raw data handling to obtain the spectrogram of the plasma-mirror reflection is described in our previous study[Reference Itakura, Kumada, Nakano and Akagi18]. This spectrogram is regarded as a trace of plasma-mirror FROG to be retrieved.
$R(t)-R_{0}$, is taken into account. The procedure of the raw data handling to obtain the spectrogram of the plasma-mirror reflection is described in our previous study[Reference Itakura, Kumada, Nakano and Akagi18]. This spectrogram is regarded as a trace of plasma-mirror FROG to be retrieved.
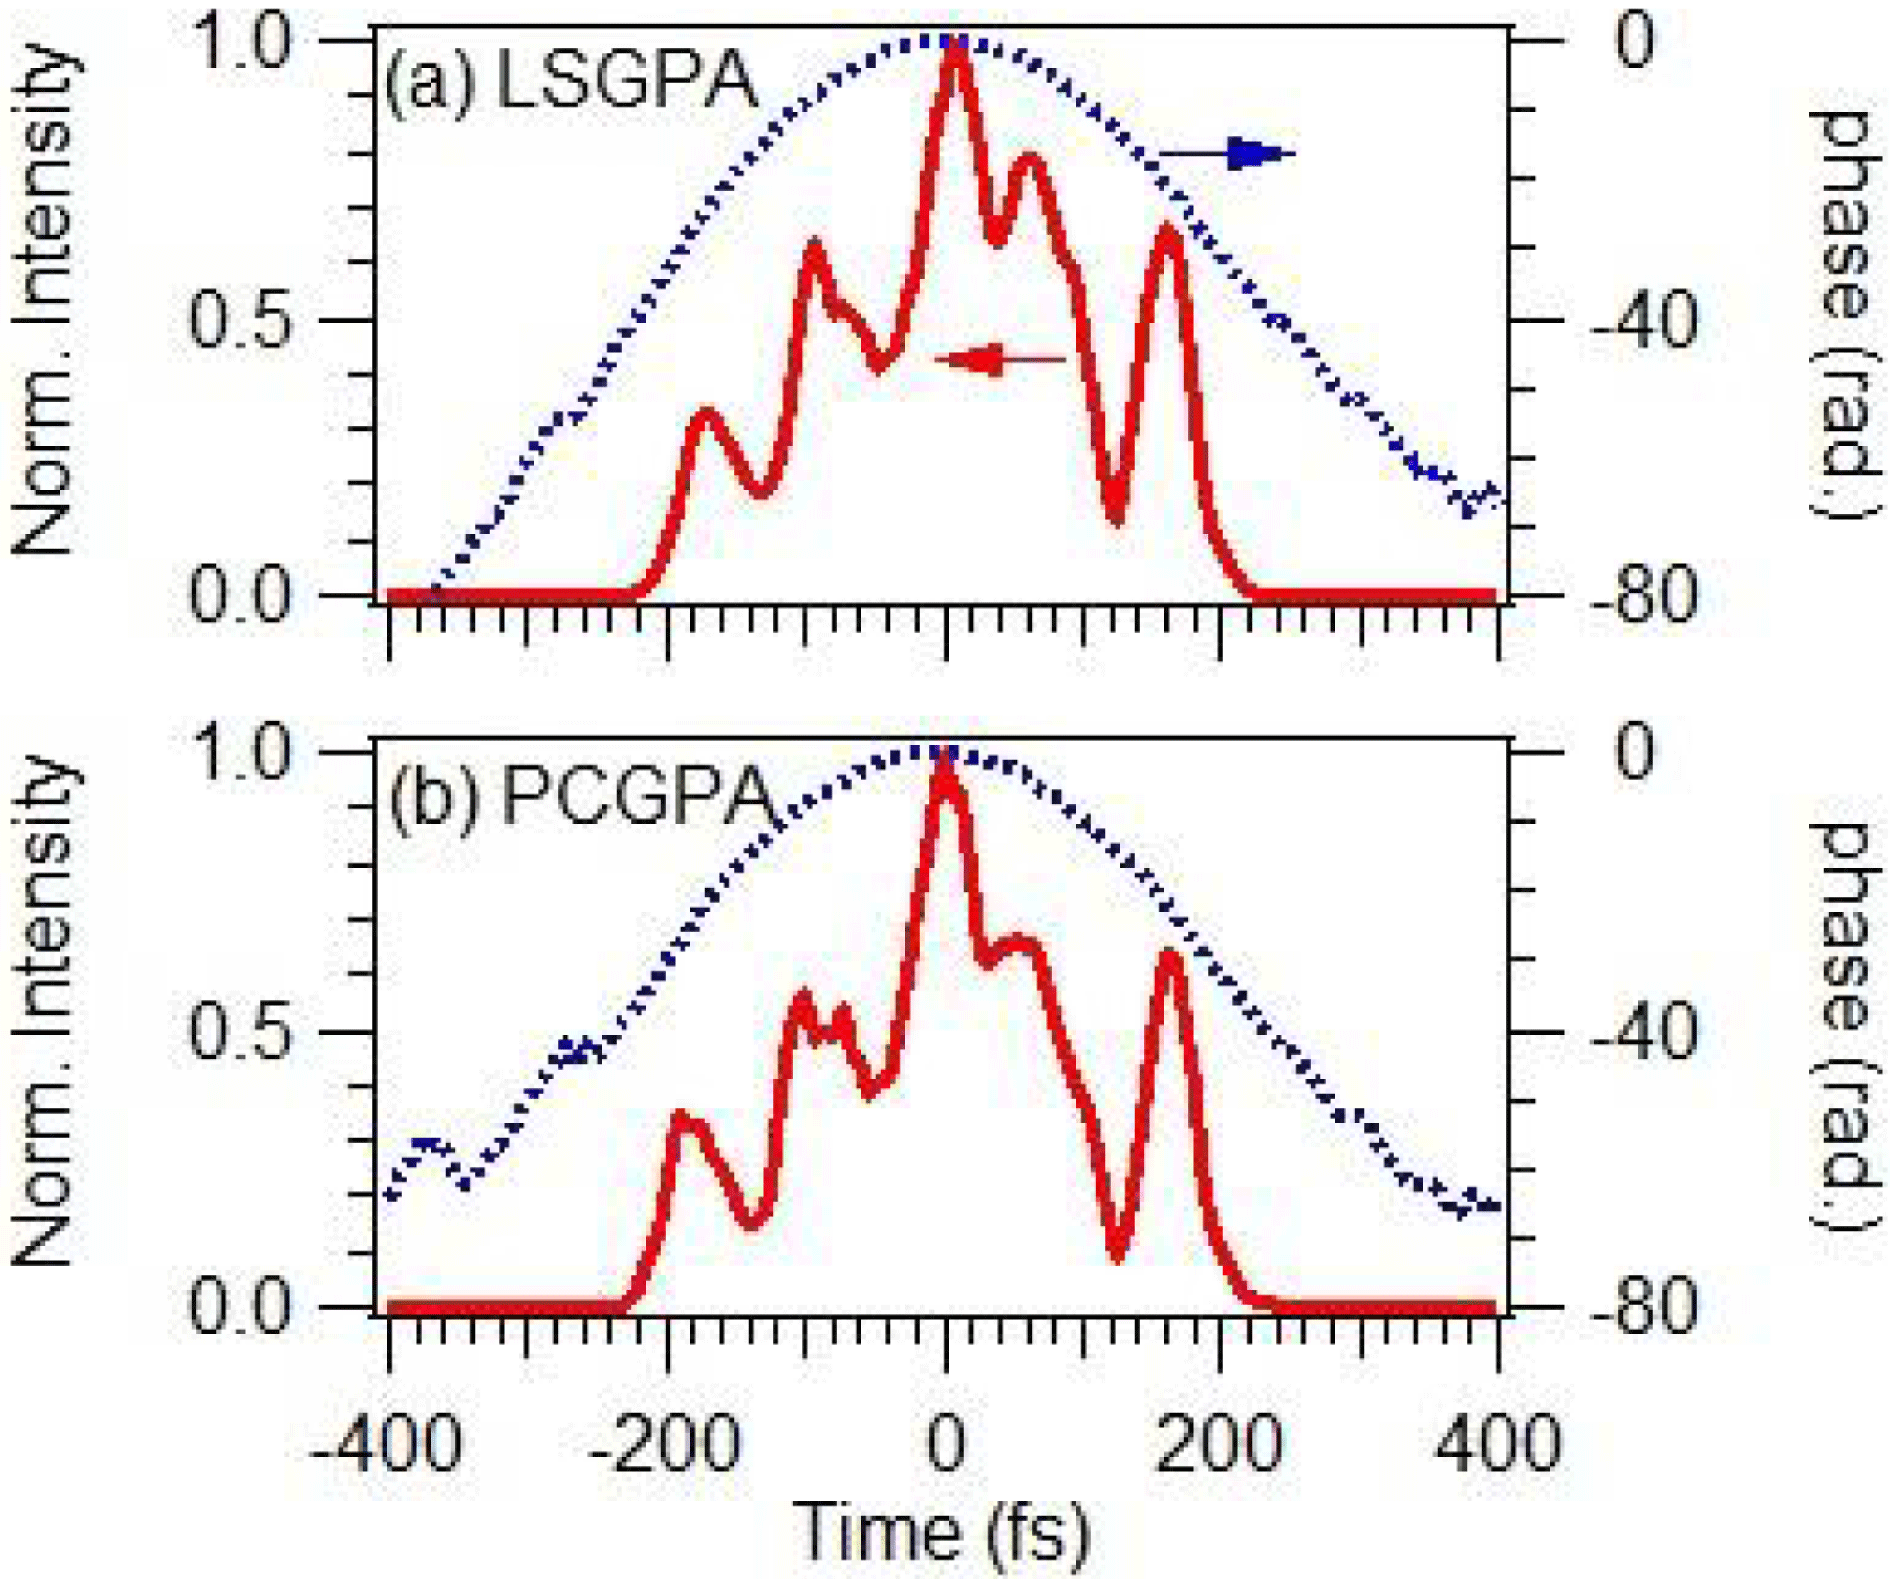
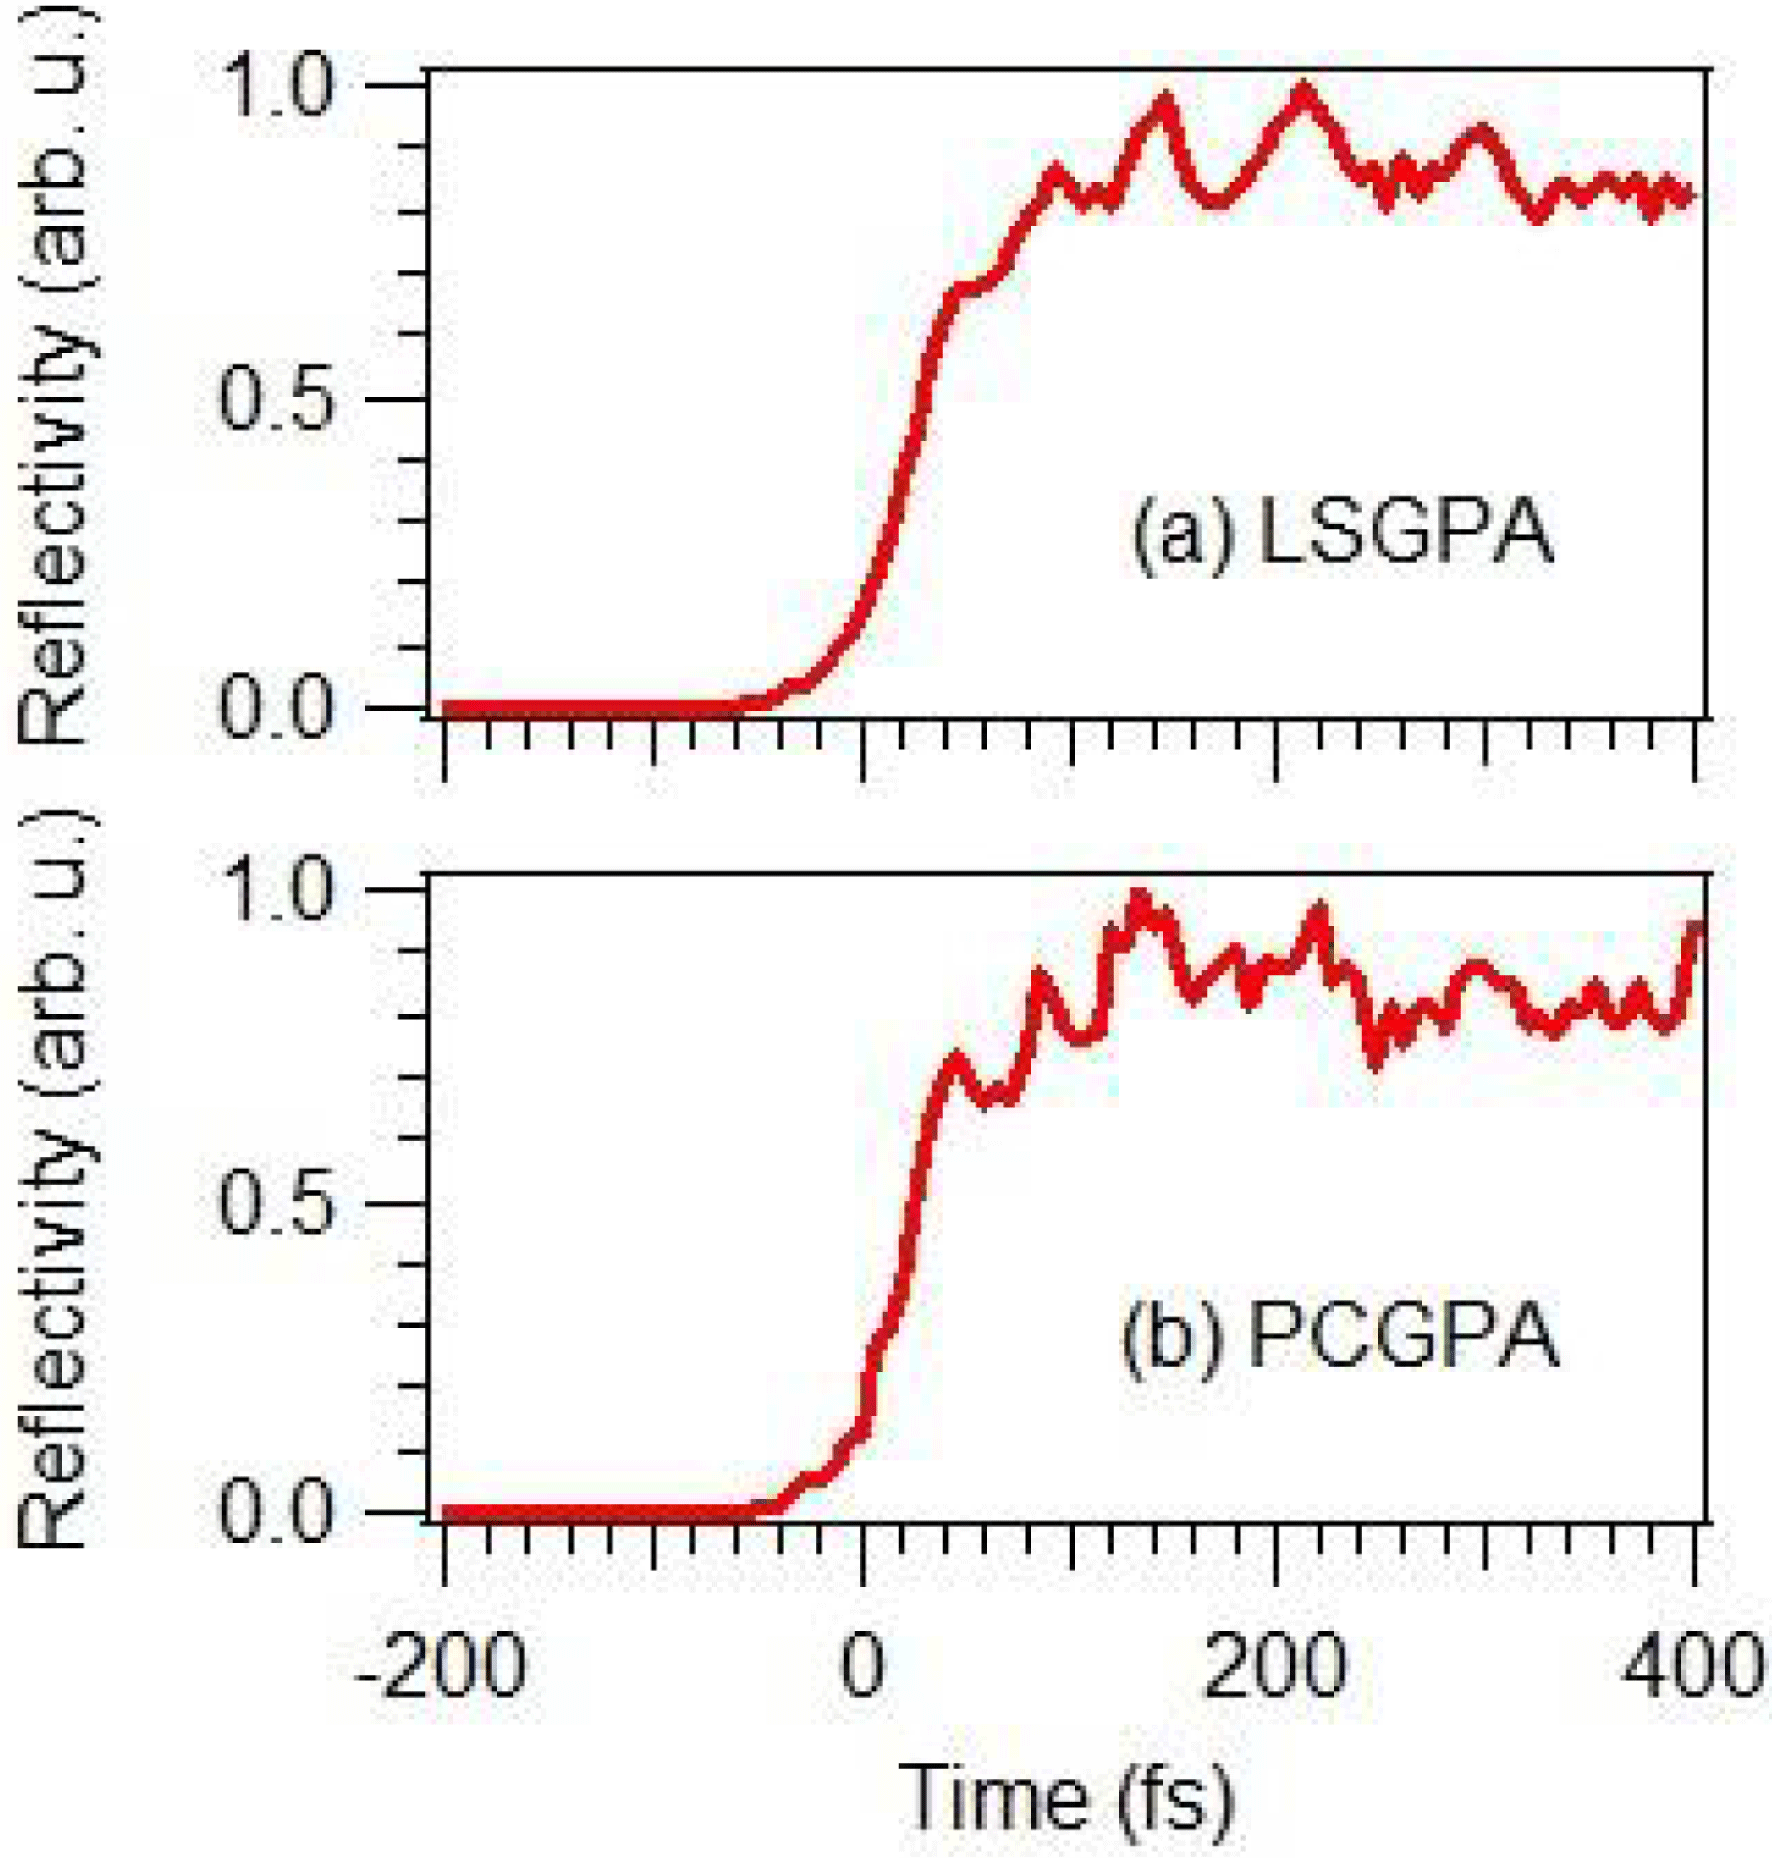
The FROG trace is retrieved with the LSGPA as shown in Figure 1(b). It is noted that the artificial non-zero component caused by the aliasing problem[Reference Itakura, Kumada, Nakano and Akagi18] does not appear in the FROG trace retrieved with the LSGPA, which has no aliasing problem. The VUV waveform extracted by the LSGPA in Figure 2(a) is quite similar to that extracted by the PCGPA in Figure 2(b). The time-dependent reflectivity difference, ![]() $R(t)-R_{0}$, is also extracted similarly by the LSGPA and the PCGPA, as shown in Figure 3. The fact that the two different FROG retrieval procedures result in similar VUV waveforms and reflectivities of the plasma mirror is proof that both procedures work well in retrieving a plasma-mirror FROG trace. From the point of view of computational time, the LSGPA allows us to reach satisfactory convergence much faster than the PCGPA. When using a computer (Dell Precision T7400) with an Intel Xenon E5420 (2.5 GHz) CPU and 4.0 GB RAM, the retrieval of the plasma-mirror FROG trace in Figure 1(a) to obtain the retrieved trace in Figure 1(b) takes about 3 min. If we adopt the PCGPA and the same initial guess of the VUV waveform and the time-dependent reflectivity, it takes more than 30 min to retrieve the FROG trace with the same level of FROG error.
$R(t)-R_{0}$, is also extracted similarly by the LSGPA and the PCGPA, as shown in Figure 3. The fact that the two different FROG retrieval procedures result in similar VUV waveforms and reflectivities of the plasma mirror is proof that both procedures work well in retrieving a plasma-mirror FROG trace. From the point of view of computational time, the LSGPA allows us to reach satisfactory convergence much faster than the PCGPA. When using a computer (Dell Precision T7400) with an Intel Xenon E5420 (2.5 GHz) CPU and 4.0 GB RAM, the retrieval of the plasma-mirror FROG trace in Figure 1(a) to obtain the retrieved trace in Figure 1(b) takes about 3 min. If we adopt the PCGPA and the same initial guess of the VUV waveform and the time-dependent reflectivity, it takes more than 30 min to retrieve the FROG trace with the same level of FROG error.

Figure 2. Temporal waveform of the VUV pulse extracted from the plasma-mirror FROG trace in Figure 1(a) by (a) the LSGPA and (b) the PCGPA. The solid and dotted lines indicate the intensity and relative phase, respectively. The intensity is normalized at the maximum.

Figure 3. Plasma-mirror reflectivity difference, ![]() $R(t)-R_{0}$, extracted from the plasma-mirror FROG trace in Figure 1(a) based on (a) the LSGPA and (b) the PCGPA.
$R(t)-R_{0}$, extracted from the plasma-mirror FROG trace in Figure 1(a) based on (a) the LSGPA and (b) the PCGPA.
When plasma-mirror FROG is applied to a longer pulse, the delay range becomes wider, as shown in Figure 4. The rising edge at each frequency component over the whole spectral range is crucial to extract the VUV waveform. Therefore, the required delay range of the plasma-mirror FROG trace is wider for a VUV pulse with a larger chirp rate, while the spectral range is unchanged. In the PCGPA, the FROG trace is described by a square matrix of ![]() $n\times n$, where
$n\times n$, where ![]() $n$ is set to be an integer power of 2 for performing fast Fourier transformation. If the delay range is wider, the required memory size in the PCGPA increases in proportion to the square of the size of the delay coordinate. On the other hand, in the LSGPA, the FROG trace does not need to be described by a square matrix. Even if the delay range becomes wider, the size of the frequency coordinate does not need to be changed, as shown in Figure 4. Therefore, the required memory size in the LSGPA is linearly proportional to the size of the delay coordinate, resulting in the less computational cost[Reference Gagnon, Goulielmakis and Yakovlev20]. The superiority of the updated retrieval procedure based on the LSGPA is enhanced as the chirp rate of the VUV pulse increases.
$n$ is set to be an integer power of 2 for performing fast Fourier transformation. If the delay range is wider, the required memory size in the PCGPA increases in proportion to the square of the size of the delay coordinate. On the other hand, in the LSGPA, the FROG trace does not need to be described by a square matrix. Even if the delay range becomes wider, the size of the frequency coordinate does not need to be changed, as shown in Figure 4. Therefore, the required memory size in the LSGPA is linearly proportional to the size of the delay coordinate, resulting in the less computational cost[Reference Gagnon, Goulielmakis and Yakovlev20]. The superiority of the updated retrieval procedure based on the LSGPA is enhanced as the chirp rate of the VUV pulse increases.

Figure 4. Measured plasma-mirror FROG trace. The VUV pulse generated in the Ar cell passes the LiF lens and the ![]() $\text{CaF}_{2}$ plate prior to the plasma-mirror reflection. (b) FROG trace retrieved with the LSGPA. The FROG error is
$\text{CaF}_{2}$ plate prior to the plasma-mirror reflection. (b) FROG trace retrieved with the LSGPA. The FROG error is ![]() $G=0.037868$. The size of the FROG traces is
$G=0.037868$. The size of the FROG traces is ![]() $256\times 330$ pixels.
$256\times 330$ pixels.
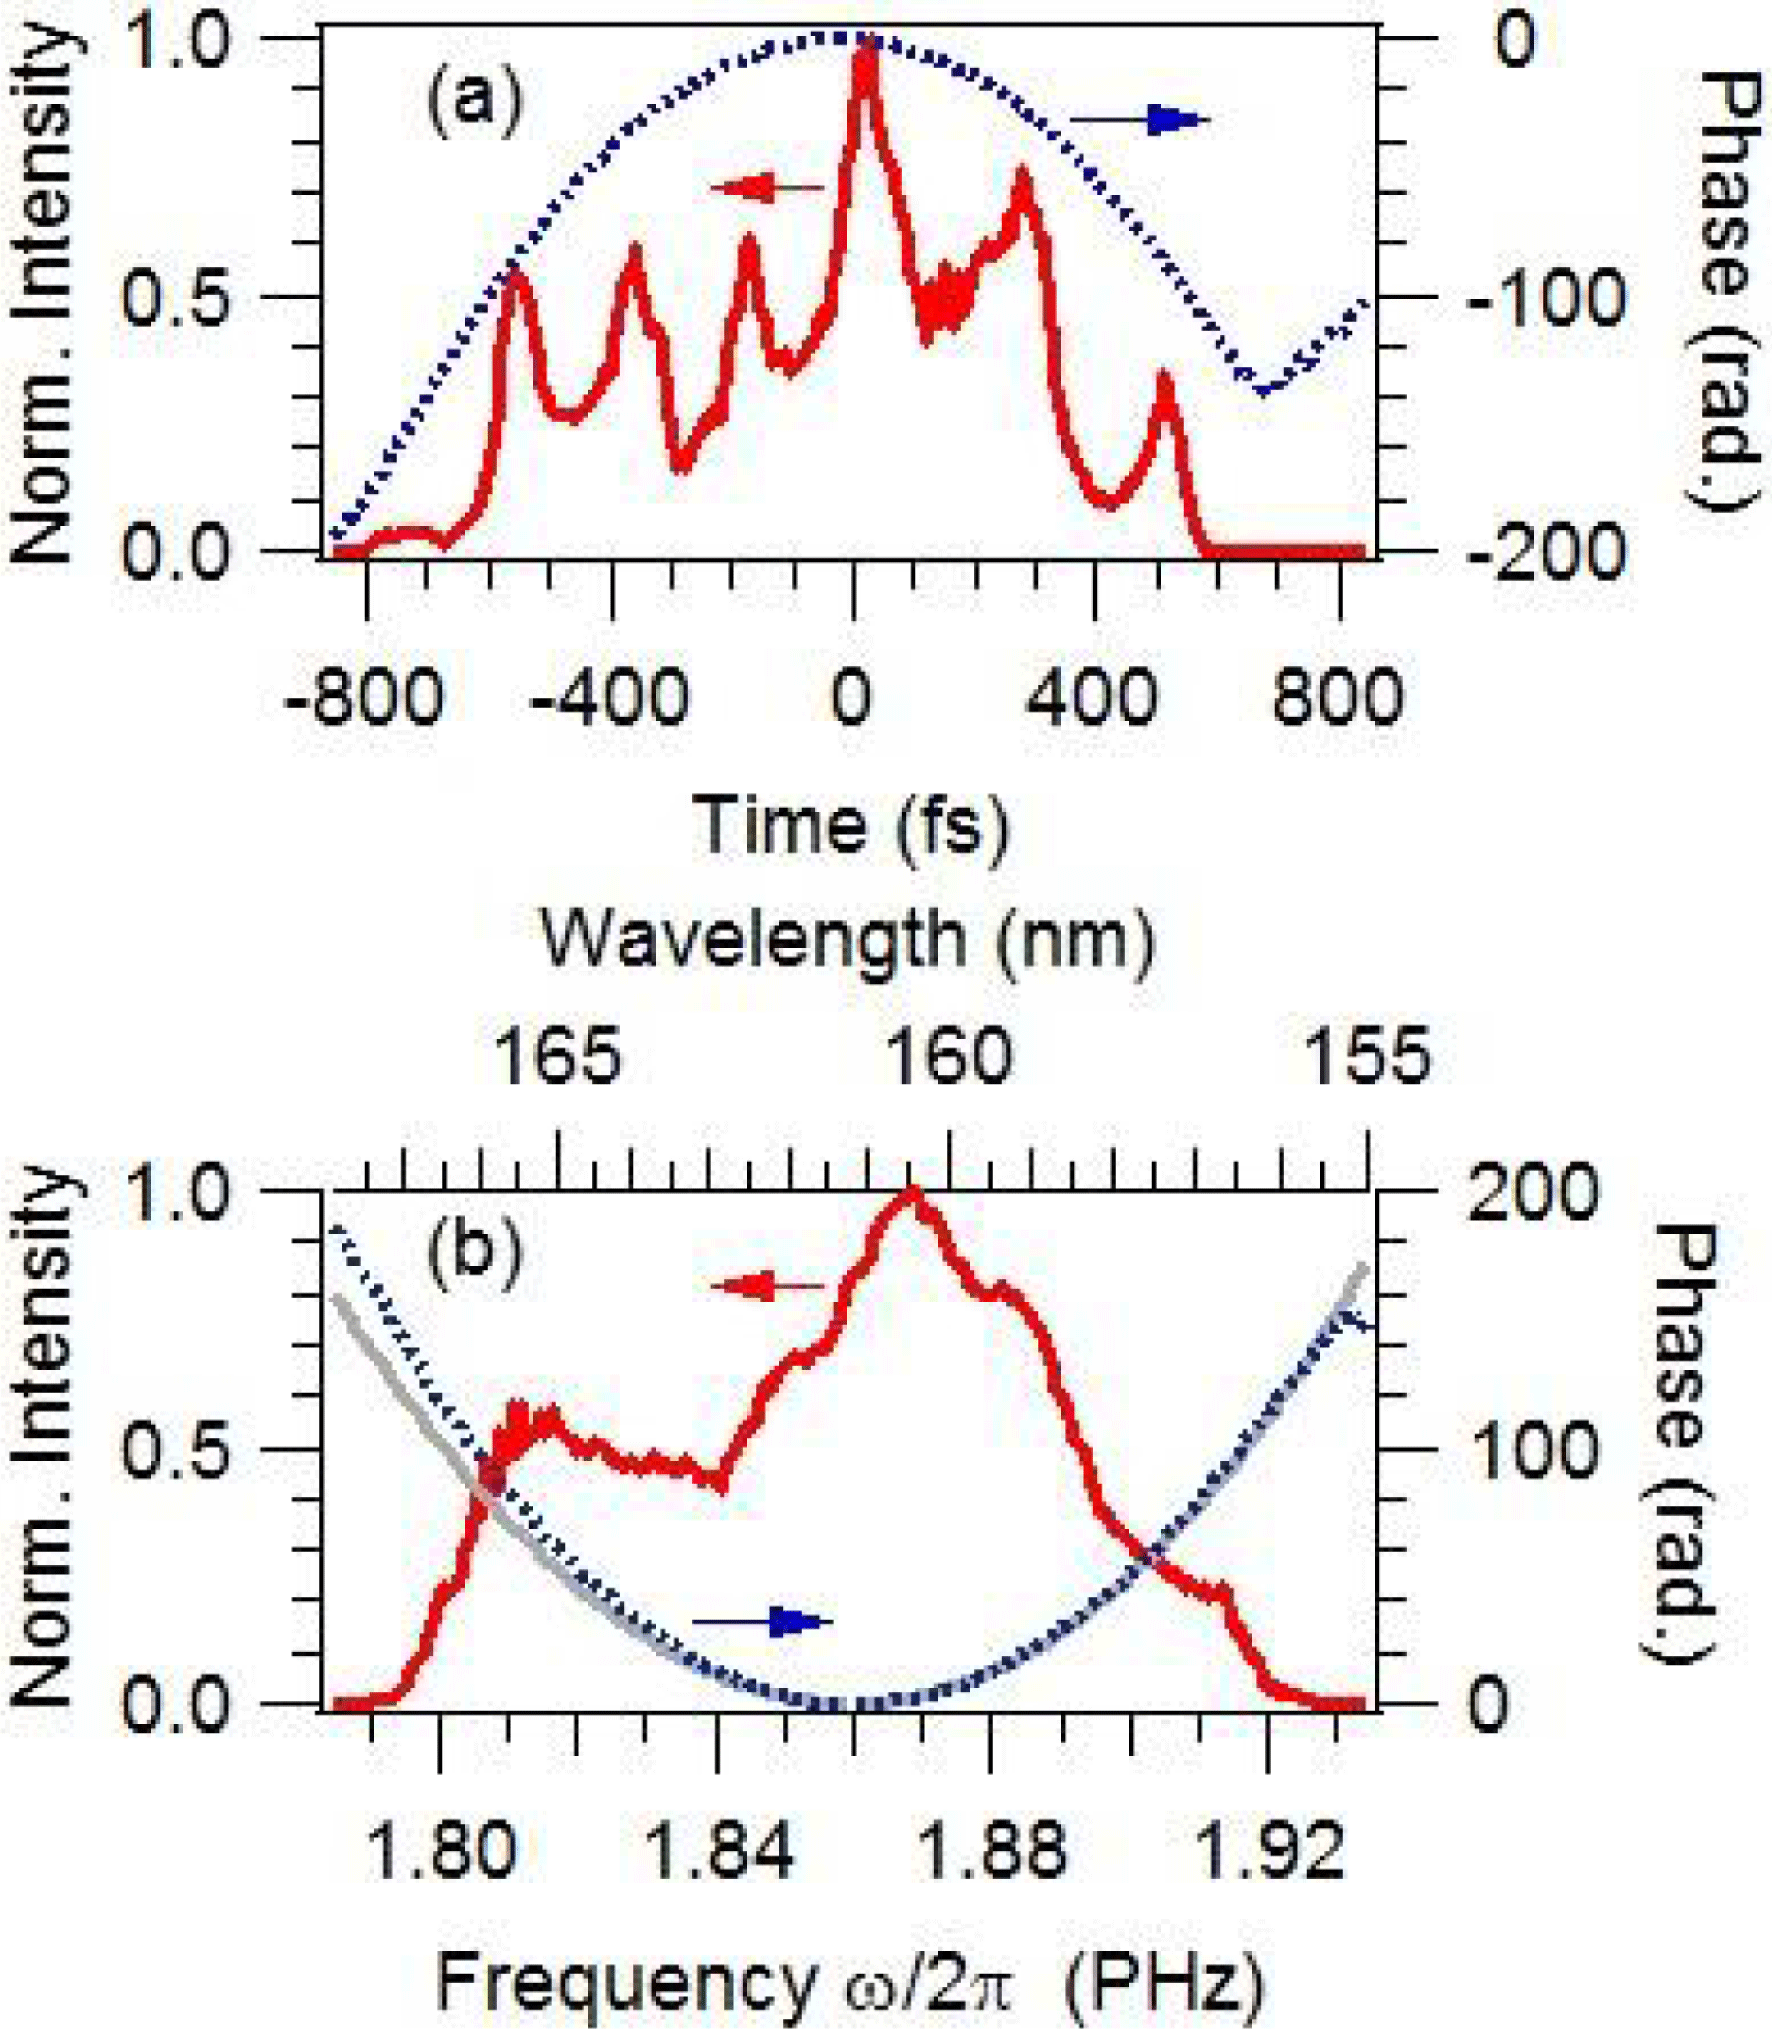
In order to confirm that a significantly chirped pulse can be efficiently extracted by plasma-mirror FROG with the LSGPA, a VUV pulse to be measured is chirped by passing the 2 mm thick ![]() $\text{CaF}_{2}$ plate as well as the LiF lens. Figures 4(a) and (b) are the measured and retrieved plasma-mirror FROG traces, respectively, indicating good agreement with a small FROG error. VUV waveforms as long as 1 ps are successfully extracted, as shown in Figures 5(a) and (b) in the time and frequency domains, respectively. Although the extracted spectral phase is almost explained by the group delay dispersion (GDD) of the LiF lens and the
$\text{CaF}_{2}$ plate as well as the LiF lens. Figures 4(a) and (b) are the measured and retrieved plasma-mirror FROG traces, respectively, indicating good agreement with a small FROG error. VUV waveforms as long as 1 ps are successfully extracted, as shown in Figures 5(a) and (b) in the time and frequency domains, respectively. Although the extracted spectral phase is almost explained by the group delay dispersion (GDD) of the LiF lens and the ![]() $\text{CaF}_{2}$ plate, the inherent phase from harmonic generation remains as a non-negligible difference. The spiky temporal waveform shown in Figure 5(a) would originate from this difference.
$\text{CaF}_{2}$ plate, the inherent phase from harmonic generation remains as a non-negligible difference. The spiky temporal waveform shown in Figure 5(a) would originate from this difference.

Figure 5. (a) Temporal and (b) spectral waveform of the VUV pulse extracted from the plasma-mirror FROG trace in Figure 4(a) based on the LSGPA. The solid and dotted lines indicate the intensity and relative phase, respectively. The intensity is normalized at the maximum. The GDD induced by the LiF lens and the ![]() $\text{CaF}_{2}$ plate is plotted as a grey line in (b).
$\text{CaF}_{2}$ plate is plotted as a grey line in (b).
The reflection difference, ![]() $R(t)-R_{0}$, is also extracted, as shown in Figure 6. It should be noted that the rising time is measured to be shorter than 100 fs even when the VUV probe pulse duration is as long as 1 ps. This fact suggests that plasma-mirror FROG is a promising experimental method for monitoring ultrafast electronic dynamics of highly excited solid states leading to laser plasmas and ablation. In the present experimental setup, the pump laser pulse, whose original pulse duration is 60 fs (FWHM), might be distorted in the propagation through the Ar cell for high-order harmonic generation. In order to gain more insight into ultrafast electronic dynamics, the accurate waveform of the pump laser pulse on the FS surface has to be measured for comparison with the time-dependent reflectivity.
$R(t)-R_{0}$, is also extracted, as shown in Figure 6. It should be noted that the rising time is measured to be shorter than 100 fs even when the VUV probe pulse duration is as long as 1 ps. This fact suggests that plasma-mirror FROG is a promising experimental method for monitoring ultrafast electronic dynamics of highly excited solid states leading to laser plasmas and ablation. In the present experimental setup, the pump laser pulse, whose original pulse duration is 60 fs (FWHM), might be distorted in the propagation through the Ar cell for high-order harmonic generation. In order to gain more insight into ultrafast electronic dynamics, the accurate waveform of the pump laser pulse on the FS surface has to be measured for comparison with the time-dependent reflectivity.

Figure 6. Plasma-mirror reflectivity difference, ![]() $R(t)-R_{0}$, extracted from the plasma-mirror FROG trace in Figure 4(a) based on the LSGPA.
$R(t)-R_{0}$, extracted from the plasma-mirror FROG trace in Figure 4(a) based on the LSGPA.
It is worthwhile to discuss what governs the shortest VUV pulse duration characterized by the present method. Similarly to attosecond streaking[Reference Goulielmakis, Schultze, Hofstetter, Yakovlev, Gagnon, Uiberacker, Aquila, Gullikson, Attwood, Kienberger, Krausz and Kleineberg2, Reference Zhao, Zhang, Chini, Wu, Wang and Chang3], even if the pulse duration of the VUV pulse is shorter than the rising time of the plasma mirror, the VUV pulse can be characterized in principle. The limitation originates not from the rising time, but from the precision in the measurement and the stability of the temporally varying reflectivity, which will be quantitatively evaluated in our future study.
Additionally, more stable experimental conditions are required for measuring a more accurate time-dependent reflectivity in a long temporal range. As shown in Figures 3(a) and (b), the rising features in the reflectivity obtained by the two different retrieval algorithms are very close, while the oscillatory structures after rising do not agree very well. It is suggested that the rising feature is precisely extracted, but the oscillatory feature after rising contains a large uncertainty. In the measured FROG traces (Figures 1(a) and 4(a)), there are horizontal lines indicating the oscillation as a function of delay. This oscillatory feature is not reproduced well in the retrieved FROG traces (Figures 1(b) and 4(b)), where the lines are tilted due to the chirp of the VUV pulses. It is thus suggested that the oscillatory feature after rising in the reflectivity shown in Figures 3 and 6 is caused by long-term fluctuation of our experimental conditions such as laser output energy and movement of the FS plate. Nevertheless, the influence of the fluctuation in the VUV waveform and the rising feature in the reflectivity is expected to be limited, because the VUV waveform and the rising feature in the reflectivity are dominantly governed by the rising edge at each frequency component in the FROG trace.
4 Summary
In this study, we have updated the analysis procedure of plasma-mirror FROG using the LSGPA. The aliasing problem has been removed and the computational cost is significantly reduced. Consequently, even when the VUV pulse is chirped to be as long as 1 ps, the retrieval of the plasma-mirror FROG trace is accomplished with a reasonable computational cost. The present method to extract the VUV waveform and the reflectivity of the plasma mirror simultaneously opens the door to investigation of ultrafast dynamics of plasma formation by an intense laser pulse.
Acknowledgements
The authors thank Prof. T. Nakajima (Kyoto University) and Dr. T. Otobe (QST-KPSI) for their fruitful discussion. They are also grateful to Drs. M. Nishikino and N. Hasegawa (QST-KPSI) for their support in the laser operation. This study is partly supported by the Consortium for Photon Science and Technology programmed by MEXT of Japan. RI acknowledges JSPS KAKENHI (Grant No. 26288013) and the Joint Usage/Research Program on Zero-Emission Energy Research, Institute of Advanced Energy, Kyoto University (Grant No. ZE26B-27).


