1. Introduction
Transposable elements (TEs) are mobile, repetitive DNA sequences that constitute a structurally dynamic component of genomes. They have been found in nearly all eukaryotic organisms and make up a large part of their genome. In Drosophila melanogaster, TEs account for 20% of the genome, 5·3% of the euchromatin and 50% of the heterochromatin (Quesneville et al., Reference Quesneville, Bergman, Andrieu, Autard, Nouaud, Ashburner and Anxolabehere2005). Each TE family has a distinctive number of copies in natural populations (Vieira et al., Reference Vieira, Lepetit, Dumont and Biémont1999; Kaminker et al., Reference Kaminker, Bergman, Kronmiller, Carlson, Svirskas, Patel, Frise, Wheeler, Lewis, Rubin, Ashburner and Celniker2002). The forces that control the abundance and distribution of TEs in genomes have been the subject of a great deal of empirical and theoretical research, although their nature and evolutionary significance is still a matter of debate (Nuzhdin, Reference Nuzhdin1999; Kidwell, Reference Kidwell2005; Lee & Langley, Reference Lee and Langley2010). Several non-excluding hypotheses have been proposed to explain the constraint of TE copy number. The elements could be maintained by a balance between transposition and selection, either against deleterious effects of insertions or opposing deleterious effects of rearrangements due to unequal exchange among insertions (Charlesworth & Langley, Reference Charlesworth and Langley1989; Pasyukova et al., Reference Pasyukova, Nuzhdin, Morozova and Mackay2004). The rate of transposition could also be self-regulated, i.e. the transposition rate decreases as the copy number increases (Charlesworth & Langley, Reference Charlesworth and Langley1986, Reference Charlesworth and Langley1989; Biémont, Reference Biémont1994). Moreover, transposition can be repressed by the host (Brookfield, Reference Brookfield1991). Recent investigations have shown that transposition can be regulated in the Drosophila germline through small interference RNAs (see Aravin et al., Reference Aravin, Hannon and Brennecke2007). Small RNA pathways of gene silencing are ancient mechanisms that, besides gene regulation, are involved in the control of viruses and TEs (Vagin et al., Reference Vagin, Sigova, Li, Seitz, Gvozdev and Zamore2006).
A key parameter to understand the dynamics of TEs is their transposition rate. However, there have been few systematic studies on spontaneous transposition rates of TEs, other than those involving hybrid dysgenesis (Eggleston et al., Reference Eggleston, Johnson-Schlitz and Engels1988; Harada et al., Reference Harada, Yukuhiro and Mukai1990; Nuzhdin & Mackay, Reference Nuzhdin and Mackay1995; Domínguez & Albornoz, Reference Domínguez and Albornoz1996; Pasyukova et al., Reference Pasyukova, Nuzhdin and Filatov1998; Nuzhdin, Reference Nuzhdin1999; Maside et al., Reference Maside, Assimacopoulos and Charlesworth2000, Reference Maside, Bartolome, Assimacopoulos and Charlesworth2001; Alonso-González et al., Reference Alonso-González, Domínguez and Albornoz2006; Papaceit et al., Reference Papaceit, Avila, Aguade and Garcia-Dorado2007; Vázquez et al., Reference Vázquez, Albornoz and Domínguez2007). The outcome of these studies, covering 34 families of elements, is that most individual rates are zero (90 estimates out of 117 were zero including in situ and Southern experiments or 71 out of 96 when only in situ data are considered). Some elements such as roo and copia were shown to transpose in several studies (6 out of 7 and 5 out of 11, respectively), while element 412 did not transpose in any of the six experiments where it was considered. The mean overall transposition rate in these studies is of the order of 10−4 but indirect estimates based on the analysis of nested TEs are one or two orders of magnitude lower (Bergman & Bensasson, Reference Bergman and Bensasson2007).
In order to study TE dynamics, long-term mutation accumulation (MA) lines of D. melanogaster, derived from a genetically homogeneous population, have been monitored for activity of several families of TEs (Alonso-González et al., Reference Alonso-González, Domínguez and Albornoz2006) over generations. The element roo was found highly active in this genetic background, with a rate of insertion of 7×10⁻⁴ insertions per element and generation, as compared with other 15 TE families that presented transposition rates around 10−5 or lower (Domínguez & Albornoz, Reference Domínguez and Albornoz1996; Maside et al., Reference Maside, Bartolome, Assimacopoulos and Charlesworth2001; Alonso-González et al., Reference Alonso-González, Domínguez and Albornoz2006; Vázquez et al., Reference Vázquez, Albornoz and Domínguez2007). Mutations consisting of indels or reordenations within the element (structural mutation) occur at a rate in the order of 10−5 as well (Domínguez & Albornoz, Reference Domínguez and Albornoz1996, Reference Domínguez and Albornoz1999; Albornoz & Domínguez, Reference Albornoz and Domínguez1999). This result is consistent with the reported structural degeneration of the elements in the D. melanogaster genome in spite of being extremely young (Kaminker et al., Reference Kaminker, Bergman, Kronmiller, Carlson, Svirskas, Patel, Frise, Wheeler, Lewis, Rubin, Ashburner and Celniker2002; Bergman & Bensasson, Reference Bergman and Bensasson2007). Structural degeneration is not limited to the TEs in the reference sequence, but is a general phenomenon in populations of Drosophila (Alonso-González et al., Reference Alonso-González, Domínguez and Albornoz2003).
Element roo, with 137 copies, is the most abundant TE in the euchromatic portion of the reference genome of D. melanogaster (Quesneville et al., Reference Quesneville, Bergman, Andrieu, Autard, Nouaud, Ashburner and Anxolabehere2005). Here, we check the long-term evolution of the number of elements per genome and the transposition rate of roo in two different sets of MA lines, both derived from the same isogenic base, which have been accumulating roo insertions for more than 350 generations. This provides an excellent material to check the possible mechanisms that constrain TE copy number and limit their proliferation in natural populations.
2. Materials and methods
(i) MA lines
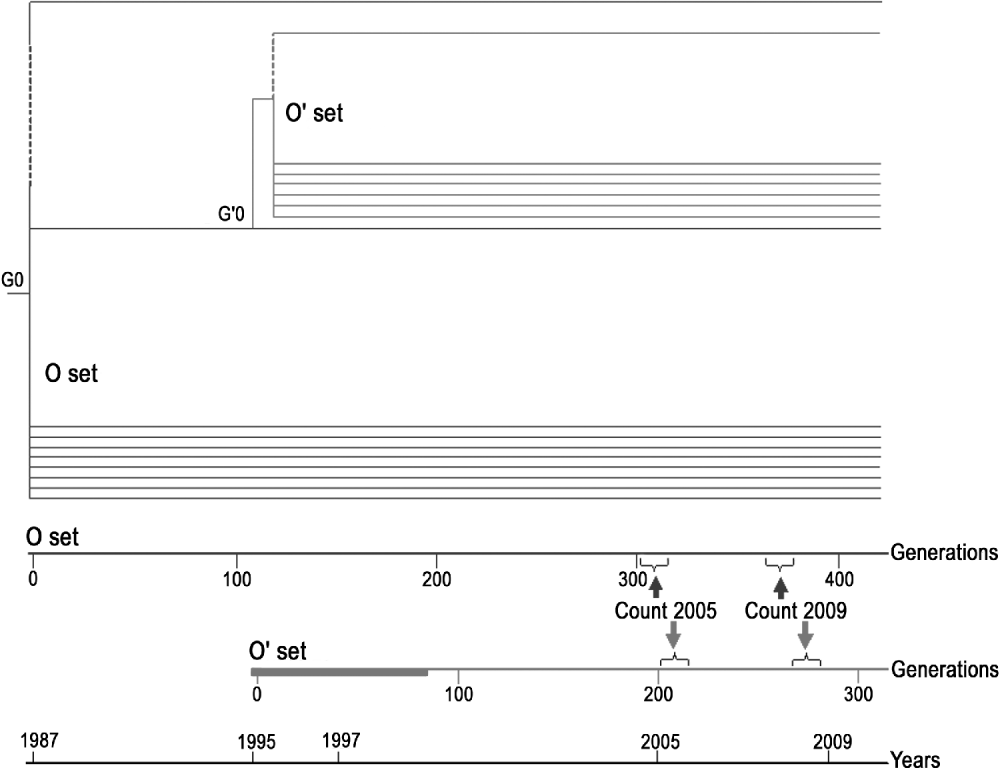
In a previous experiment (Santiago et al., Reference Santiago, Albornoz, Domínguez, Toro and Lopez-Fanjul1992), a set of MA lines was established from a D. melanogaster base population, which was isogenic for all chromosomes, and carried the recessive eye-colour mutation sepia (se) as an indicator of possible contamination. The isogenic stock was classified as Q (weak P) or M′ (pseudo-M) for the P–M system of hybrid dysgenesis. Two sets of MA lines derived from that base (Alonso-González et al., Reference Alonso-González, Domínguez and Albornoz2006) were used in the present experiment (Fig. 1). All the lines were maintained with two pairs of flies per generation.

Fig. 1. Diagrammatic representation of the two sets of MA lines and test that were made over time.
O set (formerly named Oviedo set): consisting of the eight original lines surviving in 2009. These lines were maintained at 24±1°C during the experiment. The insertion pattern of roo was determined in 2009 (generations G371–G376) and compared with the data obtained in 2005 (G297–G324).
O′ set (formerly named Oviedo-28 set): lines derived from one of the O lines (C66) at generation 115 (G115 of the O set corresponds to the generation zero, G′0, of the O′ set). Sixty lines (201–260) were maintained at 28±1°C for 75 generations, while 20 lines (261–280) were maintained at 24±1°C as controls. From generation G′76 onwards, all the lines of the O′ set were maintained at 24±1°C. The insertion pattern of roo was determined for the 22 surviving lines in 2009 (G′268–G′275) and compared with the data obtained in 2005 (G′213).
All lines were maintained with one or two pairs of parents per generation, reared in the standard medium of this laboratory (brewer's yeast–agar–sucrose) in glass vials (20 mm diameter and 100 mm height).
(ii) Analysis of transposition rate
Initially, all lines in each set were expected to share the same pattern of in situ hybridization sites. This was confirmed by the constancy of the insertion pattern among the lines in each set. Line differences will thus reflect new insertions and excisions that have been fixed in the lines. Under the neutral model, the number of mutations occurring per generation and locus is μ×2Ne (where μ is the mutation rate and Ne is the effective size) and their probability of fixation is 1/(2Ne). Thus, the fixation rate under neutrality is equal to the mutation rate. In small populations, detrimental mutations with a selective disadvantage smaller than 1/(2Ne) will behave as effectively neutral (Hedrick, Reference Hedrick2010). Comparisons between the number of insertions and transposition rates determined in 2009 with the respective parameters determined in 2005 for the same lines were made by paired Student t-test. The dependence of the transposition rate per element per generation in 2009 on the number of elements in 2005 was studied by regression. The homogeneity of regression slopes in the two sets of lines was tested by an analysis of covariance using SPSS, following Sokal and Rohlf (Reference Sokal and Rohlf1995) .
(iii) Fluorescent in situ hybridization (FISH)
In situ hybridization to polytene chromosomes was carried out following the protocol of Gatti et al. (Reference Gatti, Bonaccorsi and Pimpinelli1994) . The probe used was the internal 2·3 kb SalI–HindIII fragment labelled with digoxigenin-11-dUTP using Nick Translation Mix (Roche). Signals were detected with anti-digoxigenin-rhodamine Fab fragments (Roche). Probe was hybridized to polytene chromosome squashes of salivary glands from third-instar larvae. After hybridization, slides were air-dried and stained with 4′,6-diamidino-2-phenylindole. Slides were examined under a fluorescence microscope (Olympus BX61). Chromosomal locations of roo elements were determined at the level of cytological subsections on standard Bridges map of D. melanogaster (Lefevre, Reference Lefevre1976). In general, two nuclei were analysed per slide.
3. Results
The distribution of roo insertions in the two sets of MA lines was determined and compared with the ancestral pattern inferred in a previous experiment (Vázquez et al., Reference Vázquez, Albornoz and Domínguez2007) to identify new insertions (see Fig. 2). The evolution of the number of roo insertions along generations of MA is shown in Fig. 3. Several new insertions that have been originally identified in the lines in 2005 were not fixed (18·97% in the set Oviedo and 21·43% in the set Oviedo-28), as they were not mapped in the present experiment. No excisions of the ancestral patterns (63 elements for the O lines and 72 for the O′ lines) were found throughout the experiment. The number of elements of the O lines in 2009 ranged between 70 and 89 with a mean of 81·38±2·02, significantly exceeding that of the previous account, in 2005, that was 77·50±2·02 (P=0·0049, paired Student t-test). The number of elements in the O′ set of lines in 2009 ranged between 77 and 103 with a mean of 86·27±1·12 elements per individual, to be compared with the mean of 84·09±0·91 in the previous determination in 2005 (P=0·0058, paired Student t-test). Line 203 departed 3·01 sd from the mean in the count of 2005 and 4·11 sd in the last determination and can therefore be considered an outlier differing from the rest of the lines.

Fig. 2. Cytological detection of roo by in situ hybridization to polytene chromosomes. Dark arrowheads point to new insertions, the remaining hybridization signals correspond to the original pattern. a) Line O-C20 with 71 insertions, b) Line O′-203 with 103 insertions.

Fig. 3. Number of roo insertions against generations.
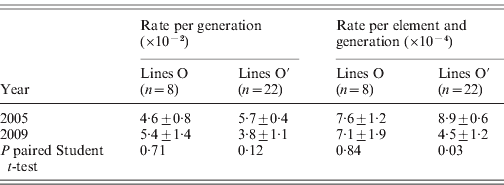
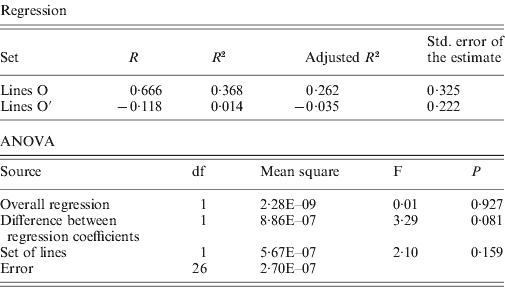
The rates of insertion were calculated both per generation and per element per generation (Table 1). Rates for the O lines remained constant across generations, while the O′ lines that started from a higher number of elements show a decrease that is significant when expressed as insertion rate per element per generation. The overall regression coefficient of insertion rate per element per generation on copy number was non-significant (Table 2). The regression coefficient of number of copies predicting transposition rate per element and generation can be compared across the two sets. Although the difference is not statistically significant (P=0·08, see Table 2), the regression coefficient for the O set is higher (0·606±0·325, P=0·11) than for the O′ set (−0·118±0·222, P=0·60).
Table 1. Roo transposition rate

Table 2. Regression of insertion rate per element and generation on number of elements

4. Discussion
During 370 generations, the Oviedo MA lines have been accumulating roo insertions, starting from 63 elements per genome and reaching a number that varied between 70 and 103. During the second period of MA (2005–2009), the lines O continued to accumulate roo insertions at the same rate as before (1987–2005), but the rate of increase in roo copy number has decreased in the lines O′ with a larger initial copy number. On the other hand, the regression of transposition rate on roo copy number in the O lines, with a lower starting number of copies (77·5), was positive and close to the significance (b=0·6, P=0·11), while the regression coefficient in the O′ lines, with a larger number of copies per haploid genome (84·1) was equal to −0·1. In a similar experiment with the TEs copia and Doc, Pasyukova et al. (Reference Pasyukova, Nuzhdin and Filatov1998) observed a positive correlation between transposition rate and copy number in the early stages of the experiment that disappeared later on. This suggests either the existence of a mechanism of transposition regulation dependent on the number of copies or, alternatively, the increase of the deleterious effects of insertions with the number of copies (Lee & Langley, Reference Lee and Langley2010). A synergistic effect of insertions on fitness is to be expected from the increased rate of deleterious rearrangements that could be associated with an increase in copy number (Langley et al., Reference Langley, Montgomery, Hudson, Kaplan and Charlesworth1988; Charlesworth & Langley, Reference Charlesworth and Langley1989).
D. melanogaster is the species with more roo elements of the genus (de la Chaux & Wagner, Reference de la Chaux and Wagner2009; Díaz-González et al., Reference Díaz-González, Domínguez and Albornoz2010) and the majority of them are very young (Bowen & McDonald, Reference Bowen and McDonald2001; de la Chaux & Wagner, Reference de la Chaux and Wagner2009). The median age of insertion of roo is below the detection limit of 0·05 million years obtained from long terminal repeat (LTR) divergence (de la Chaux & Wagner, Reference de la Chaux and Wagner2009) indicating that most roo elements were recently inserted. This can be related to the reported activity of the element in most laboratory lines studied (Eggleston et al., Reference Eggleston, Johnson-Schlitz and Engels1988; Nuzhdin & Mackay, Reference Nuzhdin and Mackay1995; Pasyukova et al., Reference Pasyukova, Nuzhdin and Filatov1998; Maside et al., Reference Maside, Assimacopoulos and Charlesworth2000, Reference Maside, Bartolome, Assimacopoulos and Charlesworth2001; Vázquez et al., Reference Vázquez, Albornoz and Domínguez2007). The number of roo elements in the Oviedo lines has surpassed the characteristic number of elements estimated from in situ hybridization studies in D. melanogaster natural populations (67·60±13·87, Vieira et al., Reference Vieira, Lepetit, Dumont and Biémont1999; 63·0, Kaminker et al., Reference Kaminker, Bergman, Kronmiller, Carlson, Svirskas, Patel, Frise, Wheeler, Lewis, Rubin, Ashburner and Celniker2002). In the Oviedo lines, the rate of accumulation of roo drops as the number of elements increase, pointing out to regulation as the possible mechanism for the containment of roo, and consistent with the proposed density-dependent mechanism of defence by iRNAs (Abrusán & Krambeck, Reference Abrusán and Krambeck2006; Lu & Clark, Reference Lu and Clark2010).
The effect of the genetic background on transposition rates was shown in several reports of instability for one or more TEs (Lim et al., Reference Lim, Simmons, Raymond, Cox, Doll and Culbert1983; Georgiev et al., Reference Georgiev, Kiselev, Simonova and Gerasimova1990; Pasyukova & Nuzhdin, Reference Pasyukova and Nuzhdin1993), and it was demonstrated that several episodes of TE mobilization causing instability in diverse families were related to the RNAi (RNA interference) pathways that control transposition (Desset et al., Reference Desset, Conte, Dimitri, Calco, Dastugue and Vaury1999; Kalmykova et al., Reference Kalmykova, Klenov and Gvozdev2005; Mével-Ninio et al., Reference Mével-Ninio, Pélisson, Kinder, Campos and Bucheton2007). In our experiment, two unstable lines accumulating a great number of insertions have been detected, one line (line 275 belonging to the controls of the O′ set) was identified in 2005 and was lost shortly after, but the other one (line 203 of the O′ set, raised at high temperature during 75 generations) is still accumulating insertions (see Fig. 3). The instability of these lines indicates that transposition is regulated and that mutations causing instability can arise at a non-negligible rate (two unstable mutants/13 828 generations, giving 1·4×10−4 unstable mutations per line and generation). In nature, unstable mutations are presumably eliminated from large populations by selection but, in small populations, it is possible that they can be fixed by drift and hence they constitute an important source of variation. The unstable line 203 was previously shown to present a high rate of structural mutation that affected different families of TEs (Alonso-González et al., Reference Alonso-González, Domínguez and Albornoz2006) suggesting that this might affect nets of TEs in the genome. The expression of chimeric sequences from TE nets in β-heterochromatin may co-suppress transcripts of TEs located in euchromatic arms (Bergman et al., Reference Bergman, Quesneville, Anxolabehere and Ashburner2006). Thus, it may be speculated that the mutations causing instability in lines 203 and 275 might be related with the RNAi pathways controlling transposition.
We thank Carlos López-Fanjul and Trinidad Pérez for their critical reading of the manuscript and Sara de Albornoz for the correction of English usage.


