


1 Introduction
Keynes (Reference Keynes1921) and Knight (Reference Knight1921) emphasized the importance of developing models for ambiguity (unknown probabilities). Ambiguity is ubiquitous in economic decisions and in everyday life. Ellsberg (Reference Ellsberg1961) showed that ambiguity models have to be fundamentally different from traditional risk (known probabilities) models. Despite the importance of ambiguity, only at the end of the 1980s people succeeded in developing the first decision models for ambiguity (Gilboa Reference Gilboa1987; Gilboa and Schmeidler Reference Gilboa and Schmeidler1989; Schmeidler Reference Schmeidler1989). Since then, many fields in economics started catching up with ambiguity, including game theory, the field considered in this paper.
In games, a major source of uncertainty concerns opponents’ strategy choices. Traditional game theory invariably assumed that all uncertainties could be expressed in terms of Bayesian probabilities (e.g., Crawford et al. Reference Crawford, Costa-Gomes and Iriberri2013). Yet, there is much evidence showing that the Bayesian principles are empirically violated and that people are usually ambiguity averse (Trautmann and van de Kuilen Reference Trautmann and van de Kuilen2015). With the increased awareness of the importance of ambiguity in economics, many theoretical studies have applied ambiguity models to the analysis of games, producing more realistic predictions of people’s choices.Footnote 1 However, experimental exploration is lagging behind. For instance, many experimental studies measure subjective beliefs of players about strategy choices of others, but these studies commonly take beliefs to be Bayesian (ambiguity neutral) additive probabilities because no alternative tools were available yet.Footnote 2 Even if one assumes that using such probabilities is rational,Footnote 3 then this assumption still does not hold empirically.
Some experimental studies did allow for non-neutral ambiguity attitudes and tested their effects on behavior in games.Footnote 4 However, they did not measure ambiguity attitudes directly but rather varied the level of ambiguous information. Inferences from this approach are limited because ambiguity attitudes of subjects are heterogeneous. Furthermore, manipulating levels of ambiguity (e.g., by matching subjects with foreign vs. domestic opponents) produces confounds due to changes in beliefs about opponents’ strategy choices. Controlling for beliefs would have been required, but this could not be done properly without also accounting for ambiguity attitudes.
A difficulty that has hampered the application of ambiguity theories to natural events, including strategy choices of others, arises from the necessity to control for beliefs when measuring ambiguity. Until recently, it was not known how to do this for natural events. This is why ambiguity measurements have so far focused on artificial ambiguity through Ellsberg urns or experimenter-specified probability intervals, where controlling for beliefs is possible using symmetries introduced by the experimental design. Such symmetries are rarely available for natural events, such as those about moves by others in strategic situations. Baillon et al. (Reference Baillon, Huang, Selim and Wakker2018b) resolved the aforementioned difficulty for individual choice. They introduced an ambiguity measurement method that works for all events without the need for artificial symmetries in beliefs. We show how Baillon et al.’s method can be applied to games. By relating ambiguity attitudes to behavior in games, we thus show, with the specific example of the trust game, how accounting for ambiguity can enrich our understanding of decisions under strategic ambiguity.
2 Trust and ambiguity
Trust has received much interest in economics (Fehr Reference Fehr2009; Johnson and Mislin Reference Johnson and Mislin2011; Li Reference Li2007; Smith and Wilson Reference Smith and Wilson2017). In the commonly accepted sense, trust represents people’s belief in the trustworthiness of others (Gambetta Reference Gambetta2000). In deciding to trust others, however, not only people’s beliefs but also their attitudes towards uncertainty matter because usually it is uncertain whether their trust will be reciprocated. Most previous studies focused on how people’s risk attitude impacts their trust decisions. No clear relation was found (Eckel and Wilson Reference Eckel and Wilson2004; Houser et al. Reference Houser, Schunk and Winter2010). However, we almost never know an objective probability of others being trustworthy, and the decision to trust is usually a decision under ambiguity. It has been well documented in the literature that people treat ambiguity differently than risk (Ellsberg Reference Ellsberg1961; Trautmann and van de Kuilen Reference Trautmann and van de Kuilen2015). To properly understand people’s trust decisions, it is desirable to take their ambiguity attitudes into account. To illustrate, assume we observe two risk neutral persons. Person A decides not to trust whereas person B does. Then it is still possible that A is not less trusting than B, but only more ambiguity averse (see Case 3 in the Appendix). Hence, a control for ambiguity attitude is needed. This paper provides this control. We separate ambiguity attitudes from subjective beliefs and measure beliefsFootnote 5 properly also if subjects are not ambiguity neutral.
We can now reveal how ambiguity affects trust decisions. Whereas risk attitudes may be unrelated to trust decisions, ambiguity attitudes play a significant role. They contaminate trusting decisions as predicted by most current ambiguity theories: the decision to trust involves making oneself vulnerable to the trustworthiness of another, which is ambiguous. Hence, the more a person dislikes ambiguity, the less attractive she will find the trusting option. We thus empirically confirm, for the first time controlling all the aforementioned components, that, given same beliefs in trustworthiness of the other, people who are more ambiguity averse decide to trust less.
Corcos et al. (Reference Corcos, Pannequin and Bourgeois-Gironde2012) also argued that the trust game involves ambiguity, and found a positive relation between ambiguity aversion and trust decisions. They measured ambiguity aversion in the traditional way using artificial Ellsberg urns.Footnote 6 However, ambiguity attitudes towards unknown urns can be different than towards the trustworthiness of others (Tversky and Fox Reference Tversky and Fox1995). We will measure ambiguity attitudes directly for trust game events, thus increasing validity. In this respect, our contribution is the analog for ambiguity of what Bohnet and Zeckhauser (Reference Bohnet and Zeckhauser2004), Evans and Krueger (Reference Evans and Krueger2017) and Fairley et al. (Reference Fairley, Sanfey, Vyrastekova and Weitzel2016) did for risk: they measured risk attitudes both for artificial events and for trust game events, and showed that risk attitudes provide better predictors in the latter case.
Apart from aversion, which is a motivational component describing how much a person dislikes ambiguity, ambiguity attitude is characterized by a second, cognitive component called insensitivity. Insensitivity has been found to be an important predictor of behavior in experimental studies of individual choice (Trautmann and van de Kuilen Reference Trautmann and van de Kuilen2015). It describes how much people perceive ambiguity in a given decision situation. The more they do, the more they treat all events alike, as one blur, resulting in lower discriminatory power towards different likelihood levels. As a result, insensitivity reduces a person’s tendency to act based on her beliefs. We show that insensitivity also plays a significant role in the trust decision. Although people with more optimistic beliefs about others’ trustworthiness decide to trust more, we find that people who have equally optimistic beliefs but are more insensitive decide to trust less often. On the other hand, for people with equally pessimistic beliefs about the other’s trustworthiness the more insensitive people decide to trust more often. Thus, we find that ambiguity about the opponent’s choice in a strategic game has a two-fold effect on behavior: it makes safe strategies more attractive to averse players, and it makes insensitive players less likely to act based on their beliefs.
Because our techniques allow us to properly measure beliefs, we can further contribute new evidence to a number of open issues in the literature. In particular, we consider the relationship between behavioral and survey measures of trust. We can confirm that introspective survey questions on trust, such as the ones included in the well-known and widely used World Values Survey (WVS) and General Social Survey (GSS), do capture trust in the commonly accepted sense of belief in trustworthiness of others. Some authors have suggested that people use their own trustworthiness as a signal, and therefore thrustworthy people are more likely to trust others. We show that this is indeed due to their beliefs: they believe others to be similar to themselves. This self-similar reasoning in belief formation may also explain why some previous studies found survey measures of trust—which, as argued before, capture people’s beliefs about others—to be related to own trustworthiness (Glaeser et al. Reference Glaeser, Laibson, Scheinkman and Soutter2000). Trustworthiness, as we show, serves as a signal for forming beliefs about others.
3 Method
Figure 1 shows the trust game used in our study. A trustor faces a binary choice. If she chooses the distrust option, both she and her trustee receive €10 for sure and there is no uncertainty. Alternatively, she can choose the trust option, whose outcome is uncertain. Then the amount she receives depends on the trustee’s choice from three allocation options, where the first amount is the payment for the trustor and the second is for the trustee: R (Reciprocate) = (€15, €15), M (Middle) = (€10, €18), and S (selfish) = (€8, €22).
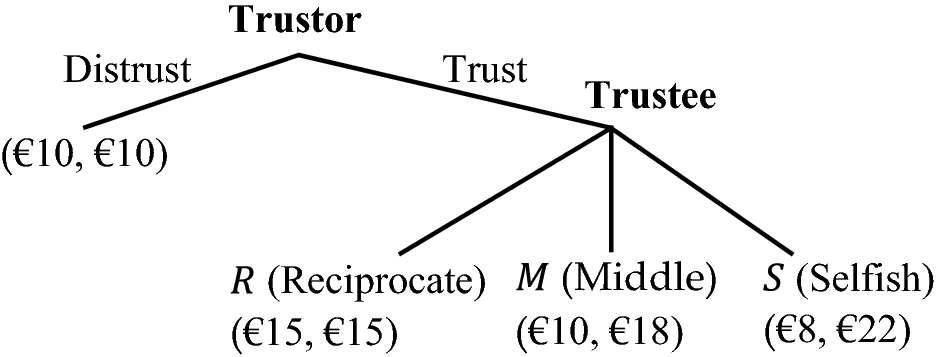
Fig. 1 Trust game
The game we used is a modification of the trust game of Bohnet and Zeckhauser (Reference Bohnet and Zeckhauser2004) and Bohnet et al. (Reference Bohnet, Greig, Herrmann and Zeckhauser2008). The only difference is that the trustee has one extra option (M). Option M gives the trustee the possibility to be selfish without hurting the trustor but at a slight efficiency cost—the total payment is then €28 instead of €30. We added this extra option so that we could observe ambiguity-generated insensitivity (defined later), for which at least three events are needed (Baillon et al. Reference Baillon, Huang, Selim and Wakker2018b).
Let E i (i = r, m, or s) denote the event that the trustee chooses option I (I = R, M, or S). These events are exhaustive and mutually exclusive. We refer to them as single events. A composite event, denoted E ij (i ≠ j), is the union E i ∪ E j of two single events. For each event E (E i or E ij) and for a fixed outcome X > 0 (X = €15 in the experiment), X E0 denotes a—possibly ambiguous—prospect that pays X if event E happens and 0 otherwise. Similarly, X q0 denotes a risky prospect that pays X with probability q and 0 with probability 1 − q.
Definition 3.1
The matching probability m (mi or mij) of an event E (Ei or Eij) is the probability such that the decision maker is indifferent between prospects XE0 and Xm0.
The matching probability m of an event E depends on the decision maker’s subjective belief in event E, but also on her ambiguity attitude. Dimmock et al. (Reference Dimmock, Kouwenberg and Wakker2016, Theorem 3.1) showed that, if we know beliefs, then matching probabilities capture people’s ambiguity attitudes while controlling for their risk attitudes. Baillon et al. (Reference Baillon, Huang, Selim and Wakker2018b) added the control for unknown beliefs. We next briefly introduce the two indexes of Baillon et al. (Reference Baillon, Huang, Selim and Wakker2018b) that we use. Let
 denote the average single-event matching probability and let
 denote the average composite-event matching probability.
Definition 3.2
The ambiguity aversion index is
Definition 3.3
The a(mbiguity-generated)-insensitivity index is
Under ambiguity neutrality,
 and
and
 so that both indexes are 0. The indexes have been normalized to have value 1 as maximum (under a regularity assumption). Note how we could calibrate ambiguity neutrality without knowing beliefs. This is key to this method. For an ambiguity averse person, the matching probabilities are low and accordingly the aversion index is high. She is willing to pay a premium (in winning probability) to avoid ambiguity. A maximally ambiguity averse person has all matching probabilities 0 and the aversion index is 1. For ambiguity seeking subjects, the aversion index is negative.
The insensitivity index concerns the (lack of) discriminatory power of the decision maker regarding different levels of likelihood. For a completely insensitive person who does not distinguish between composite and single events
 the insensitivity index takes its maximal value 1. This happens for people who take all uncertainties as fifty–fifty. The better a person discriminates between composite and single events, the larger
 is and the smaller the insensitivity index is. The index thus captures cognitive discriminatory power, and also perception of ambiguity. The more ambiguity a person perceives, the more the likelihoods of the events are perceived as one blur and the higher the index is.
Several indexes of ambiguity attitude have been proposed in the literature under particular theoretical assumptions. The beginning of §6 explains that our indexes agree with most of those on their domain of definition. Further, they generalize those domains. In this way, our indexes unify and extend many existing indexes.
Our elicitation method allows for extrapolating a-neutral probabilities p i. These can be interpreted as the beliefs of an ambiguity neutral twin of the decision maker, who is exactly the same as the decision maker except that she is ambiguity neutral. That is, a-neutral probabilities are additive subjective probabilities that result after correcting for ambiguity attitudes. Online Appendix C shows that, under certain assumptions:

The Appendix provides numerical examples to illustrate that ambiguity attitudes can confound measurements of social preferences, and that it is desirable to correct for it.
We summarize our predictions:
1. Matching probabilities are not Bayesian, and violate additivity; i.e., they are not ambiguity neutral. Instead, subjects are (1a) ambiguity averse and (1b) a-insensitive.
2. Ambiguity attitudes confound effects of social preferences. (2a) more ambiguity averse people decide to trust less often; (2b) a-insensitivity makes people less likely to act upon their beliefs, dampening the effect of prediction 3 below.
3. People with more optimistic beliefs in others’ trustworthiness decide to trust more often.
4 Experimental design
4.1 Subjects
In total, 182 subjects (56% male) were recruited from the subject pool of the experimental laboratory at Erasmus School of Economics.
4.2 Incentives
The experiment was computer-basedFootnote 7 and consisted of seven sessions. It was incentivized using a modification of the prior incentive system (Prince; Johnson et al. Reference Johnson, Aurélien, Bleichrodt, Li, van Dolder and Wakker2015), avoiding income effects (Blanco et al. Reference Blanco, Engelmann, Koch and Normann2010). At the beginning of each session (with n subjects), one volunteer was invited to randomly select n/2 pairs of sealed envelopes. The experimenter then unpaired the envelopes in the selected pile (by removing the clips holding each pair together). Next each subject would draw one envelope from the pile.
It was explained to each subject that, throughout the experiment, she would be paired with a partner whose subject ID was inside the envelope. During the experiment, she would face different decision situations, where her payments depended on both her own and her partner’s decisions. One of these decision situations was inside the envelope, and this was the only one that mattered for the real payment at the end. Each subject earned €5 participation fee, plus the earnings from the decision situation inside her envelope. Including the participation fee, an average subject earned €14.87 in our experiment.
4.3 Stimuli
During the experiment, subjects were confronted with three types of decision situations. They were also asked to answer some demographic and introspective survey questions, which were not incentivized. Each subject first faced the trustor decision of the trust game (Fig. 2). It was explained to her that her own and her partner’s choice as a trustee would determine their final payment if this decision situation was in her envelope.
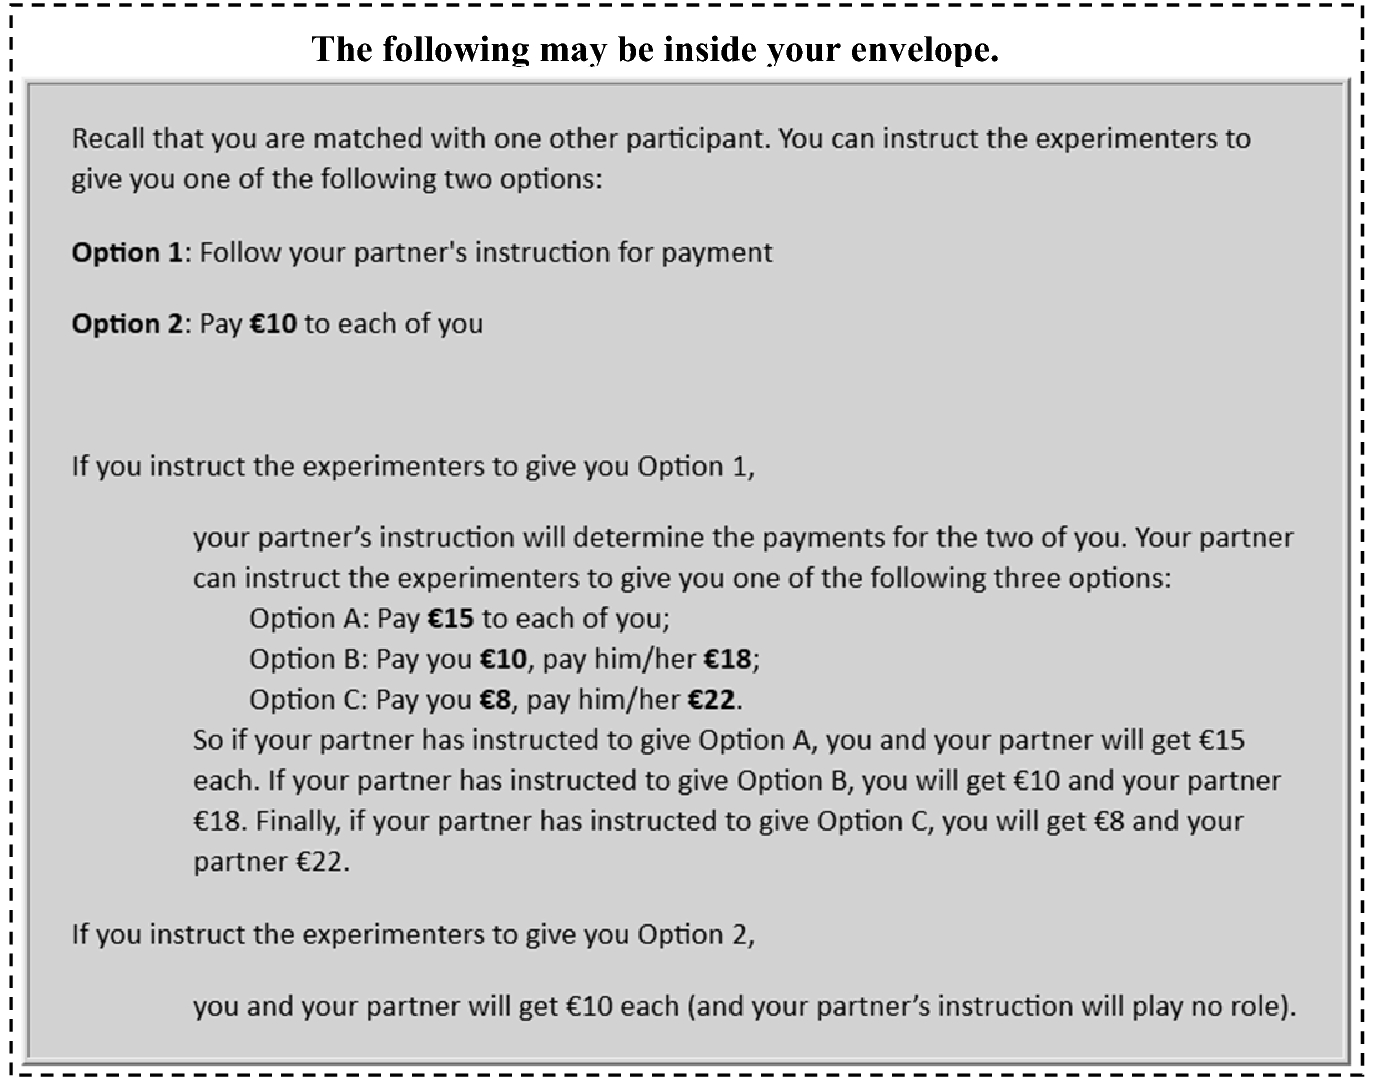
Fig. 2 Trust game: trustor decision situation
After making their choices as the trustor, subjects proceeded to the second part of the experiment, where they faced 24 decision situations designed to elicit their matching probabilities. Figure 3 depicts a typical decision situation of this type. A subject chose between two options, both of which could pay her €15 but under different conditions. Option 1 was an ambiguous prospect paying €15 if her partner (as the trustee) chose option R in the trust game. Option 2 was a risky prospect paying €15 with a 50% chance.
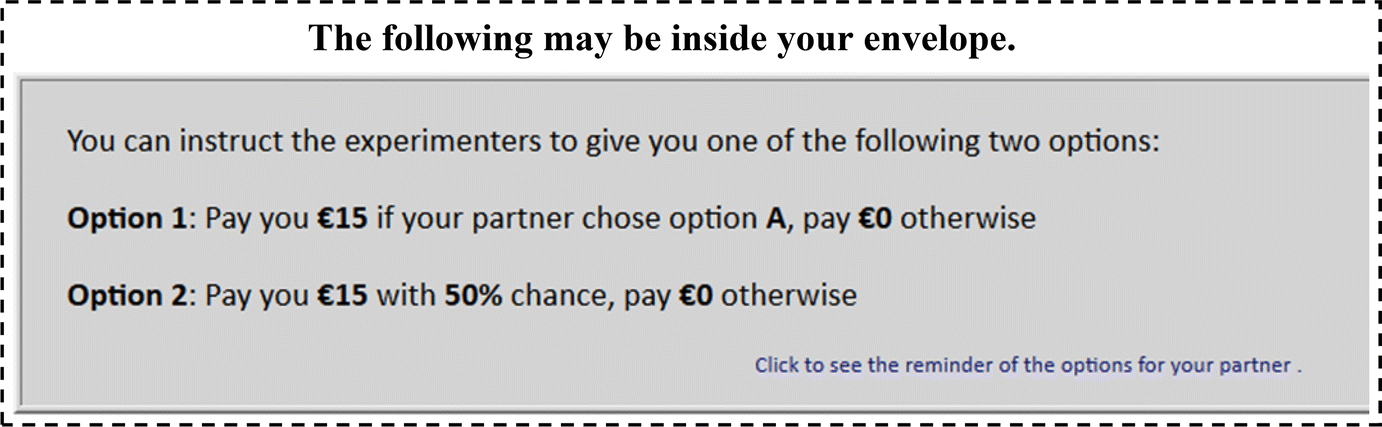
Fig. 3 A typical ambiguity decision situation
An example with an explanation of the typical decision situation was presented to the subjects before they made their decisions. To check whether they understood the procedure, subjects had to answer four questions correctly before they could proceed.Footnote 8 They could also click on a reminder button to view the description of the trust game again.
Matching probabilities were elicited for all single events
 and composite events
 For each single or composite event, bisection was used to elicit its matching probability. For instance, for event E
r the subject first faced the decision situation in Fig. 3. If she chose option 1, the winning probability in option 2 increased in the next decision situation; otherwise, it decreased. For each event, subjects faced four decision situations, where option 1 stayed fixed and the winning probability in option 2 varied depending on the choices in the previous situation.Footnote 9 Figure 4 shows how the probabilities for later decision situations and ultimately the event’s matching probability were determined by subjects’ choices. We will refer to the four decision situations for each event as a block. The 24 decision situations for eliciting matching probabilities thus constituted six blocks. The blocks appeared in random order. After each block, a demographic question was asked to refresh subjects’ thinking mode. The demographic questions also appeared in random order.
For each single or composite event, bisection was used to elicit its matching probability. For instance, for event E
r the subject first faced the decision situation in Fig. 3. If she chose option 1, the winning probability in option 2 increased in the next decision situation; otherwise, it decreased. For each event, subjects faced four decision situations, where option 1 stayed fixed and the winning probability in option 2 varied depending on the choices in the previous situation.Footnote 9 Figure 4 shows how the probabilities for later decision situations and ultimately the event’s matching probability were determined by subjects’ choices. We will refer to the four decision situations for each event as a block. The 24 decision situations for eliciting matching probabilities thus constituted six blocks. The blocks appeared in random order. After each block, a demographic question was asked to refresh subjects’ thinking mode. The demographic questions also appeared in random order.
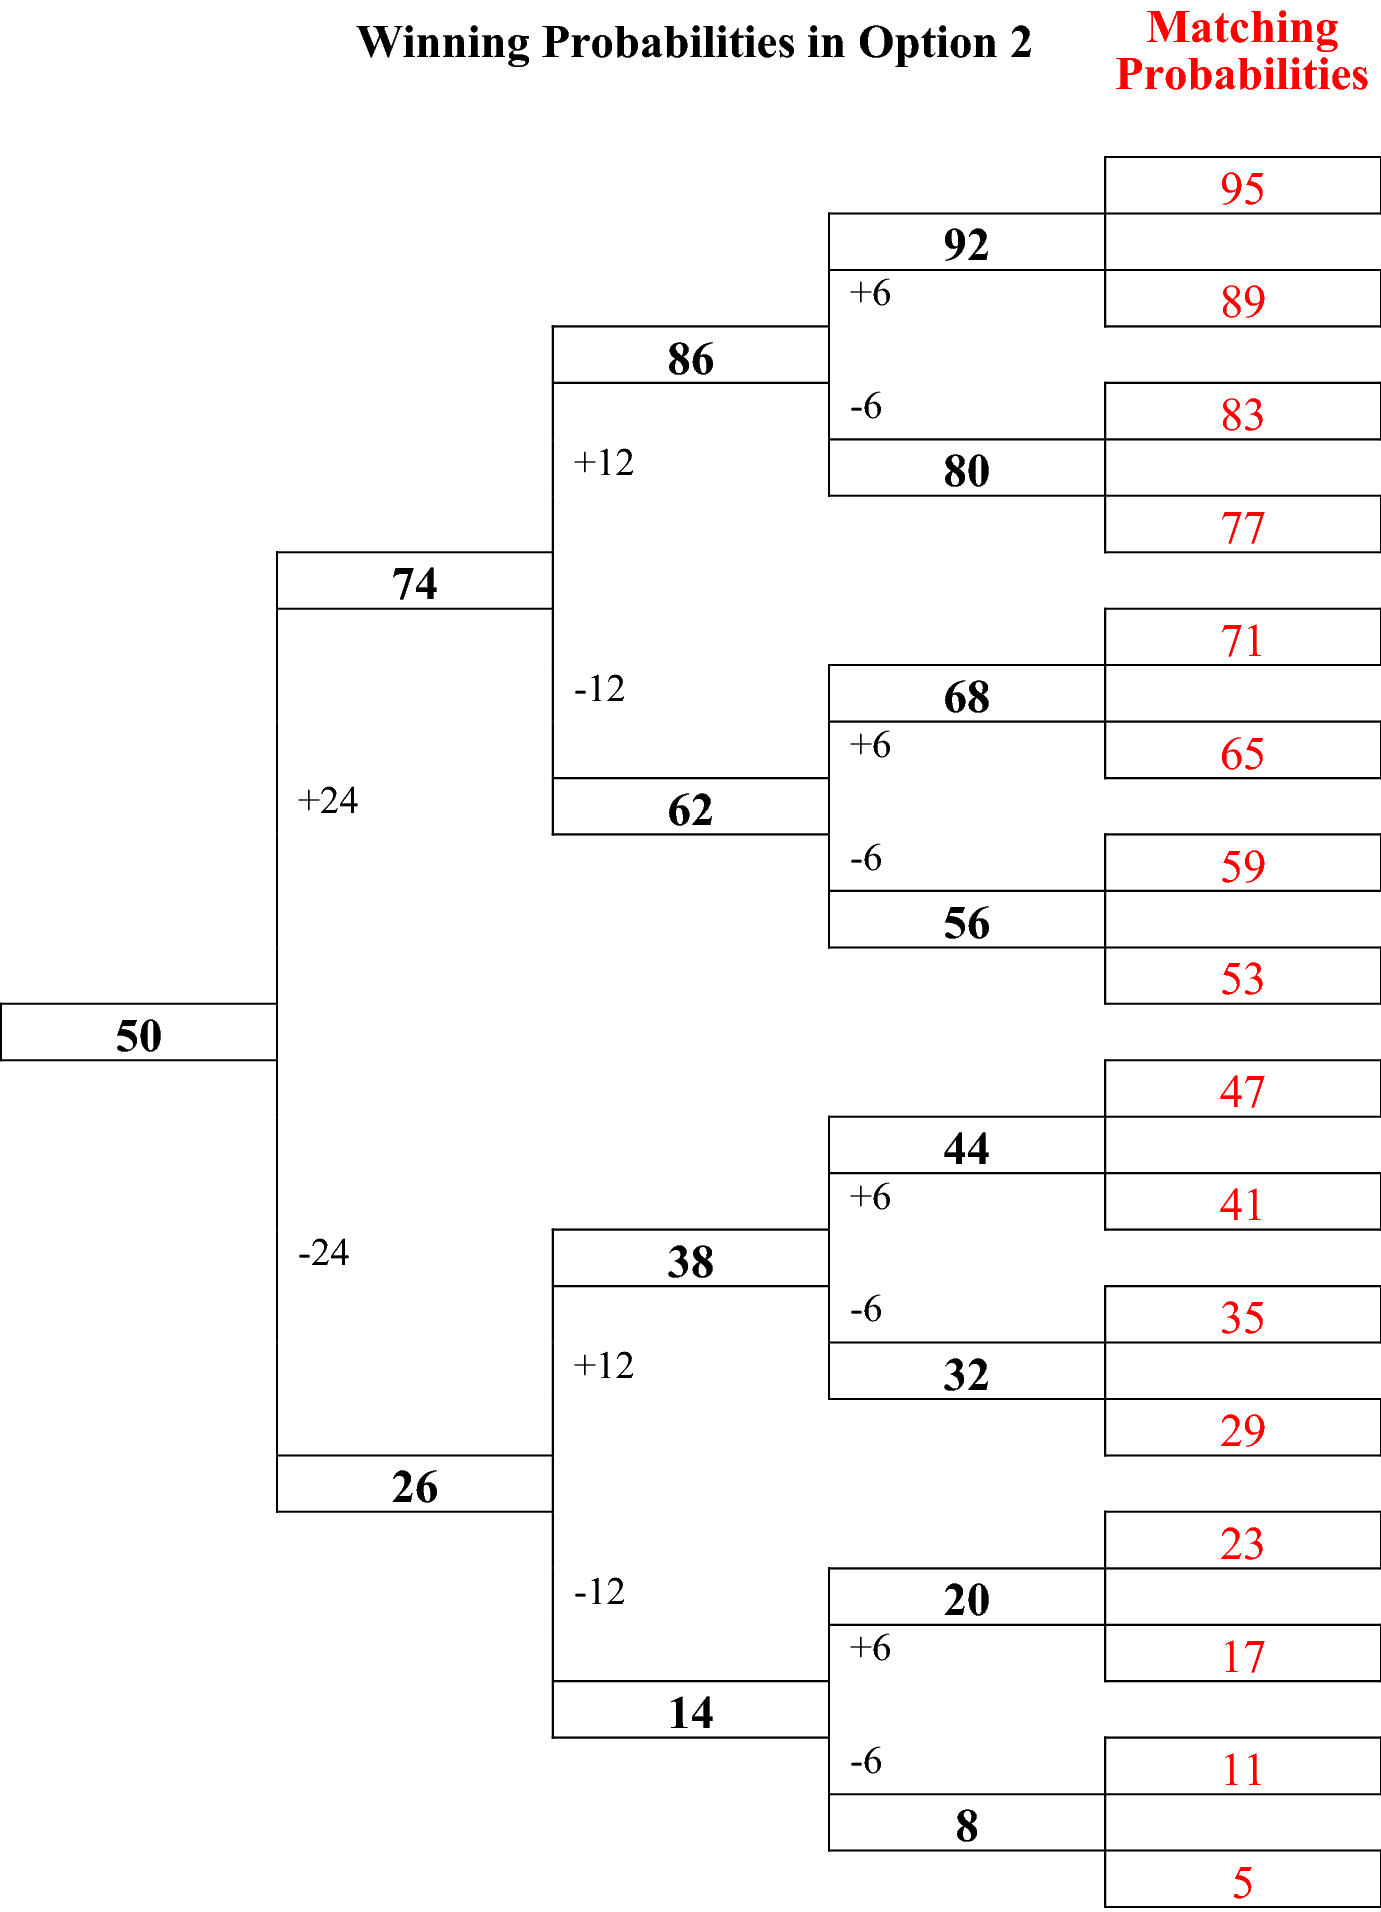
Fig. 4 Determination of probabilities in the bisection method. Notes For each event, the winning probability of the first decision situation is always 50%. At each node, if the subject chooses option 1 (2), the probability on the upper (lower) branch is used as the winning probability in option 2 in the next decision situation, while option 1 remains the same. The last column is the matching probability recorded depending on subjects’ choices in the previous four decision situations
In the third part of the experiment subjects made a decision as the trustee in the same trust game as before. Figure 5 shows the trustee decision situation.
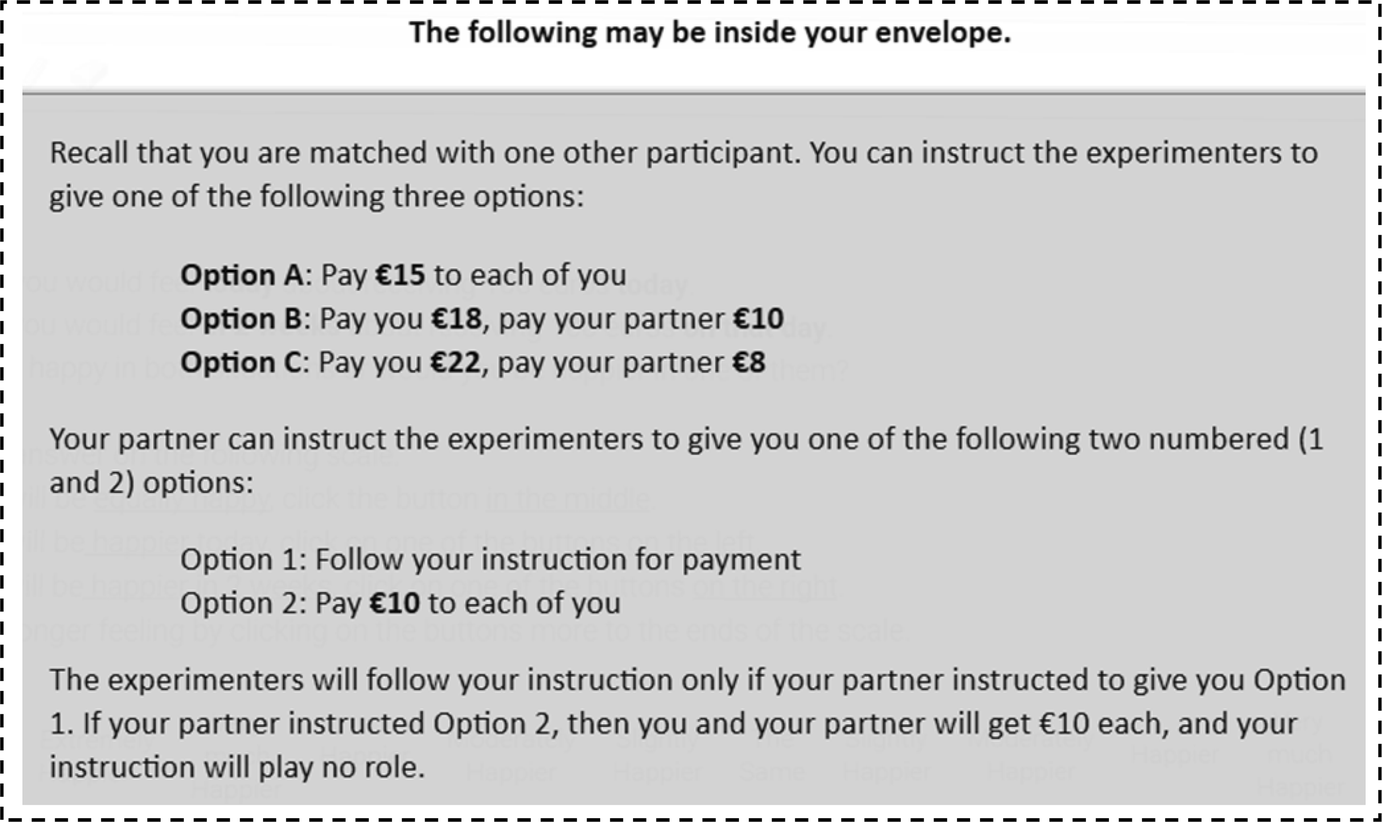
Fig. 5 Trust game: trustee decision situation
Subjects also answered non-incentivized introspective questions about their general trust attitudes. The three questions, which are identical to the general trust questions used in the VWS and the GSS, were: “Generally speaking, would you say that most people can be trusted or that you can’t be too careful in dealing with people?”; “Would you say that most of the time, people try to be helpful, or that they are mostly just looking out for themselves?”; and “Do you think that most people would try to take advantage of you if they got the chance or would they try to be fair?”. In each question, subjects could either agree or disagree with the statement. The answer indicating the trust decision was coded as 1 for each question, and the other answer as 0. The general trust measure was then taken as the average of the three responses.
4.4 Payment
After all subjects had completed the experiment, they were called to the payment desk one by one. Each subject opened her envelope. If it was the trust game decision situation (either as the trustor or the trustee), her decision and her partner’s choice determined her final payment. If the envelope contained a matching probability decision situation that she had encountered during the experiment, her partner’s trustee decision determined her final payment if she had chosen the ambiguous option 1. Otherwise, the winning probability of option 2 decided her payment.Footnote 10 The same matching probability decision situation was in her partner’s envelope, so that her trustee decision determined her partner’s final payment if her partner had chosen the ambiguous option 1. It could also happen that the subject had not encountered the matching probability decision situation that was in her envelope. We then inferred the subject’s choice in the new situation from her choice in a similar situation by dominance. For instance, suppose the subject had chosen option 1 in the decision situation in Fig. 3, but a decision situation with a winning probability of 26% was in her envelope. Because of the bisection procedure, she could not have encountered this situation during the experiment. We would then explain to the subject that, since she preferred the ambiguous option 1 to an even better option 2 (with 50% winning chance), we inferred that she would also prefer option 1 in the decision situation where option 2 gives 26% winning chance. We would then implement option 1.
5 Results
5.1 Description of data
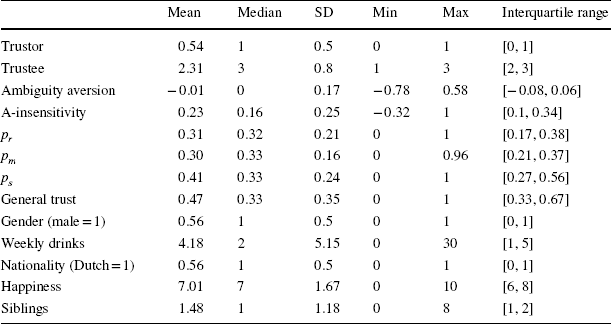
Of the 182 participants, we removed 20 (11.0%) who failed monotonicity checksFootnote 11 at least twice. Table 1 shows summary statistics. 54% of trustors chose to trust their trustees. Of the trustees, 22% reciprocated the trust by choosing option R, 25% chose the middle option M, and 53% chose the selfish option S. There was substantial heterogeneity in the trustors’ ambiguity attitudes and beliefs. The median trustor was ambiguity indifferent (b = 0; contrary to prediction 1a), a-insensitive (prediction 1b), and believed that the trustee was equally likely to choose any of the three options. In addition to these variables elicited from subjects’ choices, Table 1 also describes subjects’ responses to the introspective survey questions about general trust, gender, drinking habits, nationality, subjective well-being (happiness), and number of siblings.
Table 1 Summary statistics
|
Mean |
Median |
SD |
Min |
Max |
Interquartile range |
|
|---|---|---|---|---|---|---|
|
Trustor |
0.54 |
1 |
0.5 |
0 |
1 |
[0, 1] |
|
Trustee |
2.31 |
3 |
0.8 |
1 |
3 |
[2, 3] |
|
Ambiguity aversion |
− 0.01 |
0 |
0.17 |
− 0.78 |
0.58 |
[− 0.08, 0.06] |
|
A-insensitivity |
0.23 |
0.16 |
0.25 |
− 0.32 |
1 |
[0.1, 0.34] |
|
p r |
0.31 |
0.32 |
0.21 |
0 |
1 |
[0.17, 0.38] |
|
p m |
0.30 |
0.33 |
0.16 |
0 |
0.96 |
[0.21, 0.37] |
|
p s |
0.41 |
0.33 |
0.24 |
0 |
1 |
[0.27, 0.56] |
|
General trust |
0.47 |
0.33 |
0.35 |
0 |
1 |
[0.33, 0.67] |
|
Gender (male = 1) |
0.56 |
1 |
0.5 |
0 |
1 |
[0, 1] |
|
Weekly drinks |
4.18 |
2 |
5.15 |
0 |
30 |
[1, 5] |
|
Nationality (Dutch = 1) |
0.56 |
1 |
0.5 |
0 |
1 |
[0, 1] |
|
Happiness |
7.01 |
7 |
1.67 |
0 |
10 |
[6, 8] |
|
Siblings |
1.48 |
1 |
1.18 |
0 |
8 |
[1, 2] |
Trustor = 1 if the trustor chooses the trusting option 1 and 0 otherwise; trustee = 1, 2, and 3 if trustee chooses option R, M, and S respectively; ambiguity aversion and a-insensitivity are the index values of ambiguity attitudes; p r, p m, and p s are the a-neutral probabilities for the three events; general trust is the mean score in the WVS/GSS questions; gender = 1 if the subject is male; weekly drinks is the weekly number of alcoholic beverages consumed; nationality = 1 if the subject is Dutch and 0 if not; happiness is the subjective answer to the question “Do you feel happy in general?”, which can take values from 0 to 10; siblings is the number of siblings
We did not find any gender effects and therefore do not report statistics on them. Unsurprisingly, trustees’ decisions were not related to their ambiguity aversion
 nor to their a-insensitivity
 We now turn to trustors.
5.2 Ambiguity attitudes and beliefs as determinants of trust decisions
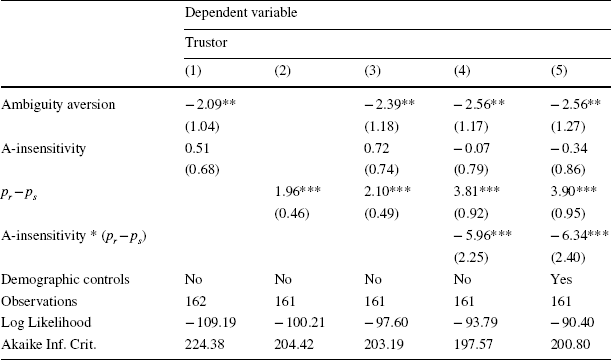
Table 2 presents binary logistic regressions of our subjects’ decisions to trust on their ambiguity attitudes and beliefs. Model 1 includes as explanatory variables the two indexes (aversion and insensitivity) describing subjects’ ambiguity attitudes. Model 2 includes a variable that measures subjects’ beliefs about their trustees’ trustworthiness, (p r − p s), with higher values corresponding to more optimistic beliefs. Model 3 combines Models 1 and 2. Model 4 adds an interaction between beliefs and a-insensitivity, and Model 5 adds demographic controls.
Table 2 Regression: what contributes to the decision to trust?
|
Dependent variable |
|||||
|---|---|---|---|---|---|
|
Trustor |
|||||
|
(1) |
(2) |
(3) |
(4) |
(5) |
|
|
Ambiguity aversion |
− 2.09** |
− 2.39** |
− 2.56** |
− 2.56** |
|
|
(1.04) |
(1.18) |
(1.17) |
(1.27) |
||
|
A-insensitivity |
0.51 |
0.72 |
− 0.07 |
− 0.34 |
|
|
(0.68) |
(0.74) |
(0.79) |
(0.86) |
||
|
p r − p s |
1.96*** |
2.10*** |
3.81*** |
3.90*** |
|
|
(0.46) |
(0.49) |
(0.92) |
(0.95) |
||
|
A-insensitivity * (p r − p s) |
− 5.96*** |
− 6.34*** |
|||
|
(2.25) |
(2.40) |
||||
|
Demographic controls |
No |
No |
No |
No |
Yes |
|
Observations |
162 |
161 |
161 |
161 |
161 |
|
Log Likelihood |
− 109.19 |
− 100.21 |
− 97.60 |
− 93.79 |
− 90.40 |
|
Akaike Inf. Crit. |
224.38 |
204.42 |
203.19 |
197.57 |
200.80 |
162 subjects remained after removing those who failed monotonicity checks at least twice. Model 2–5 have 161 observations because one subject’s matching probabilities for all events were the same so that her a-neutral probabilities were not identifiable
*p < 0.1; **p < 0.05; ***p < 0.01
Because the decision to trust involves choosing an ambiguous prospect over a certain prospect, the more ambiguity averse a trustor is, the less attractive she is expected to find the trusting option. More ambiguity averse subjects indeed decided to trust less often (prediction 2a). Subjects’ beliefs also mattered for their decisions to trust. Subjects who were more optimistic about their trustees’ trustworthiness were more likely to decide to trust (prediction 3). However, this positive effect of optimistic beliefs on trusting behavior was dampened by subjects’ a-insensitivity—the second component of ambiguity attitude (prediction 2b). Subjects who were more insensitive distinguished less between different levels of likelihoods, so that their decisions were less impacted by those differences and their acts were less based on their beliefs. The negative interaction effect between insensitivity and beliefs (in Models 4 and 5) confirms this prediction.
Average marginal effects computed from the regression results in Table 2 indicate that the aforementioned effects were also behaviorally significant. For instance, estimates of Model 5 show that one standard deviation increase in ambiguity aversion was associated with a decrease of 8 percentage points in the subject’s predicted probability of deciding to trust. As beliefs became more optimistic by one standard deviation increase in p r − p s, the probability that a subject with a-insensitivity index value 0 decided to trust increased by 26 percentage points. But for subjects with a-insensitivity index values of, say 0.16 and 0.34, corresponding to the 0.5 and 0.75 quantiles, respectively, the same improvement in beliefs led to lower increases in the probability of deciding to trust: 22 and 15 percentage point increases, respectively.
5.3 What do introspective survey questions measure?
In the literature on trust, an oft addressed and still unresolved issue concerns the validity of attitudinal survey questions on trust. For instance, experiments by Ashraf et al. (Reference Ashraf, Bohnet and Piankov2006), Glaeser et al. (Reference Glaeser, Laibson, Scheinkman and Soutter2000) and Lazzarini et al. (Reference Lazzarini, Madalozzo, Artes and de Oliveira Siqueira2005) found that, instead of measuring people’s trust in others, attitudinal survey questions captured people’s own trustworthiness. Fehr et al. (Reference Fehr, Fischbacher, von Rosenbladt, Schupp and Wagner2002), however, found that trustworthiness was unrelated to attitudinal trust, and that trusting behavior did in fact correlate with some of the survey questions on trust. In Sapienza et al. (Reference Sapienza, Toldra-Simats and Zingales2013), attitudinal trust was related to both trust and trustworthiness behaviors. These authors argued that trust decisions are affected by other-regarding preferences and risk aversion—preference components other than people’s belief in the trustworthiness of others—whereas survey questions may mainly capture the belief component. (Fehr et al. Reference Fehr, Fischbacher, von Rosenbladt, Schupp and Wagner2002 also suggested that attitudinal trust may relate to trust behavior through the belief component.)
Our main findings have shown that ambiguity present in the trust game also affects trusting behavior through the trustor’s motivational (aversion) and cognitive (or perceptual) attitudes toward ambiguity. We have thus shown an additional preference-based component affecting trusting behavior. We later show that people’s trust survey responses are positively correlated with their beliefs. Thus, we provide evidence confirming that survey questions on trust measure trust in the commonly accepted sense of belief in others’ trustworthiness. For example, this was expressed by Gambetta (Reference Gambetta2000): “When we say we trust someone or that someone is trustworthy, we implicitly mean that the probability that he will perform an action that is beneficial or at least not detrimental to us is high enough for us to consider engaging in some form of cooperation with him.”
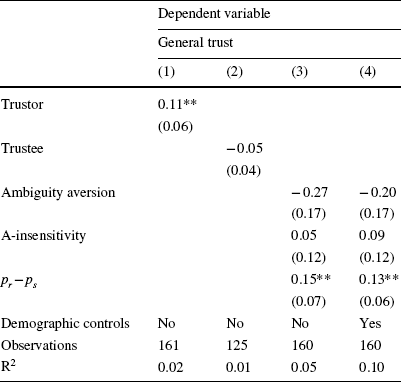
In Table 3 we examine the relationship between our subjects’ responses to the introspective survey questions about general trust and their trusting and trustworthiness behaviors. For all models, we use linear regressions with the dependent variable being the mean score of subjects’ responses to the three WVS and GSS questions about general trust. Model 1 examines the extent to which trusting behavior in the two-person game is related to the survey measure of trust. Model 2 looks at subjects’ trustworthiness behavior rather than at their trusting behavior. In Model 3 we include subjects’ ambiguity attitudes and beliefs, which were found to determine trusting behavior, as explanatory variables. Model 4 adds our demographic controls to Model 3.
Table 3 Regression: What is the general trust survey measuring?
|
Dependent variable |
||||
|---|---|---|---|---|
|
General trust |
||||
|
(1) |
(2) |
(3) |
(4) |
|
|
Trustor |
0.11** |
|||
|
(0.06) |
||||
|
Trustee |
− 0.05 |
|||
|
(0.04) |
||||
|
Ambiguity aversion |
− 0.27 |
− 0.20 |
||
|
(0.17) |
(0.17) |
|||
|
A-insensitivity |
0.05 |
0.09 |
||
|
(0.12) |
(0.12) |
|||
|
p r − p s |
0.15** |
0.13** |
||
|
(0.07) |
(0.06) |
|||
|
Demographic controls |
No |
No |
No |
Yes |
|
Observations |
161 |
125 |
160 |
160 |
|
R2 |
0.02 |
0.01 |
0.05 |
0.10 |
In Table 3, the number of observations in all models is 1 less than for the models in Table 2, because one subject’s survey responses were missing. The number of observations for Model 2 is lower because 36 subjects in the first two sessions of the experiment did not make the trustee decision
*p < 0.1; **p < 0.05; ***p < 0.01
Subjects’ responses to the survey questions were positively correlated with their decisions to trust, but had no relation with their decisions as the trustee (trustworthiness behavior).Footnote 12 These findings are reflective of the mixed results obtained in previous studies. Models 3 and 4 offer an insight. In our sample, subjects with more optimistic beliefs about their trustees’ trustworthiness scored higher in the survey measure of trust, whereas their ambiguity attitudes were unrelated to the scores in the survey measure. These results show that the survey questions about general trust do capture people’s beliefs. They also suggest an added reason for why the survey measure of trust may not robustly relate to trusting behavior in the trust game: trusting behavior is affected by people’s beliefs and ambiguity attitudes, whereas the survey measure captures beliefs alone and is not distorted by ambiguity attitudes.
The finding that survey questions on trust can capture people’s beliefs in the trustworthiness of others also offers an explanation for why some studies (e.g., Glaeser et al. Reference Glaeser, Laibson, Scheinkman and Soutter2000) found a correlation between people’s own trustworthiness behavior and their answers to survey questions on trust in others. People often form their beliefs about others based on their own types (Ross et al. Reference Ross, Greene and House1977; Rubinstein and Salant Reference Rubinstein and Salant2016). They expect others to be similar to themselves. Consistent with this self-similar reasoning in belief formation, Fig. 6 shows that subjects’ beliefs in the trustworthiness of others is strongly correlated with their own trustworthiness. Subjects who chose the reciprocating option R in the role of a trustee also believed their trustees to be most likely to choose option R (p value < 0.01; Jonckenheere test). Those who chose the selfish option S similarly believed their trustees to be most likely to do the same (p-value < 0.01; Jonckenheere test), but this was not so for option M.

Fig. 6 Belief about partner by own trustworthiness. Notes Each panel in Fig. 6 presents the median a-neutral probabilities of an event (R, M, or S) split by subjects’ own trustee decisions. The dashed horizontal line indicates the actual frequency
If survey questions capture beliefs about others’ trustworthiness and if beliefs about others are based on own trustworthiness, then it is plausible to expect a correlation between the survey measure and people’s own trustworthiness. However, as shown in Table 3 (Model 2) there was no significant relationship between trustworthiness and the survey measure of trust in our sample.
Finally, we note that the self-similar reasoning in belief formation provides insight into previous findings on earnings in trust games, namely, that trusting people lost money on average (Berg et al. Reference Berg, Dickhaut and McCabe1995; Ashraf et al. Reference Ashraf, Bohnet and Piankov2006). In our sample, the actual frequencies of trustee decisions (21, 27, and 52% choosing option R, M, and S, respectively) were closest to the median beliefs of the most prevalent type: the selfish trustees who chose option S. The self-similar reasoning in belief formation would predict this. Applying the same reasoning, the other two types ended up being overly optimistic about others’ trustworthiness. Because trusting behavior is driven by (overly) optimistic beliefs, trusting subjects lost money on average.
6 Discussion and related literature
We used the indexes of Baillon et al. (Reference Baillon, Huang, Selim and Wakker2018b) for ambiguity attitude measurements. We briefly discuss features and validity of these indexes here. See Baillon et al. (Reference Baillon, Bleichrodt, Li and Wakker2018a) for more details. Indexes can never completely capture complex phenomena, and cannot be valid for all theories. For instance, the popular relative risk aversion index
 varies with wealth under constant absolute risk aversion, and with probability under prospect theory (Wakker Reference Wakker2008). Baillon et al. (Reference Baillon, Bleichrodt, Li and Wakker2018a) explain that their ambiguity indexes are valid under all “uni-separable” ambiguity theories. This includes Ghirardato and Marinacci’s (Reference Ghirardato and Marinacci2001) biseparable utility and, thus, Gilboa and Schmeidler’s (Reference Gilboa and Schmeidler1989) maxmin expected utility, Gilboa’s (Reference Gilboa1987) and Schmeidler’s (Reference Schmeidler1989) Choquet expected utility, Tversky and Kahneman’s (Reference Tversky and Kahneman1992) prospect theory for gains (as in our case), and α-maxmin utility (Ghirardato et al. Reference Ghirardato, Maccheroni and Marinacci2004; Luce and Raiffa Reference Luce and Raiffa1957, Sect. 13.5). Non-biseparable theories include Einhorn and Hogarth (Reference Einhorn and Hogarth1985). Baillon et al.’s indexes agree with, and thus unify and generalize (e.g., by not assuming expected utility for risk) many indexes proposed in papers before, including those of Dow and Werlang (Reference Dow and Werlang1992) and Schmeidler (Reference Schmeidler1989) for Choquet expected utility, Abdellaoui et al. (Reference Abdellaoui, Baillon, Placido and Wakker2011) and Dimmock et al. (Reference Dimmock, Kouwenberg and Wakker2016) for prospect theory, Ghirardato et al. (Reference Ghirardato, Maccheroni and Marinacci2004) and Luce and Raiffa (Reference Luce and Raiffa1957, Sect. 13.5) for α-maxmin expected utility, and Dimmock et al. (Reference Dimmock, Kouwenberg, Mitchell and Peijnenburg2015) and Epstein and Schneider (Reference Epstein and Schneider2010) for ε-contamination multiple priors. Baillon et al. (Reference Baillon, Bleichrodt, Li and Wakker2018a) also showed that, whereas the aversion index could be estimated from two matching probabilities, we need six for the insensitivity index.
The aforementioned theories have in common that ambiguity attitudes are modeled through event dependence; i.e., functions operating on events. The utility function of outcomes is assumed invariant across different contexts. This assumption underlies the use of matching probabilities.Footnote 13 Another kind of ambiguity theories capture ambiguity attitudes through functions on outcomes, Klibanoff et al.’s (Reference Klibanoff, Marinacci and Mukerji2005) smooth model being the most popular one. Under these theories, our indexes become outcome dependent, in the same way as the relative index of risk aversion can be wealth or probability dependent. Outcome dependence is, indeed, characteristic of such theories. It also holds for more general theories including Gul and Pesendorfer (Reference Gul and Pesendorfer2015) and Maccheroni et al. (Reference Maccheroni, Marinacci and Rustichini2006).
A convenient feature of matching probabilities, and the indexes derived from them, is that they capture ambiguity attitudes irrespective of risk attitudes (Dimmock et al. Reference Dimmock, Kouwenberg and Wakker2016, Theorem 3.1). The intuitive explanation is that risk attitude plays the same role for the two prospects in Definition 3.1 and, hence, drops from the equations. The remarkable implication is that measuring ambiguity attitudes is easier than measuring risk attitudes.
Many theoretical studies, and some empirical studies (see introduction), recently incorporated ambiguity into game theory. We are aware of two studies that measured aversion towards strategic ambiguity (Camerer and Karjalainen Reference Camerer, Karjalainen, Munier and Machina1994; Ivanov Reference Ivanov2011). However, these studies did not use ambiguity attitudes to predict strategic behavior, but, conversely, devised special games with the purpose of deriving ambiguity attitudes from strategic behavior. They did not derive beliefs from revealed preferences, but Ivanov (Reference Ivanov2011) controled for beliefs by deriving them from introspection. Both studies only considered ambiguity aversion, and not insensitivity. Our measurements of ambiguity attitudes, carried out in trust games, can be used in all game situations, are independent from the actual behavior in the games so that they can be used to predict game behavior, are entirely revealed preference based, and also consider insensitivity. It is not surprising that prediction 1a (ambiguity averson) was not confirmed. Many recent studies found that ambiguity aversion is less prevalent than thought a decade ago; see Kocher et al. (Reference Kocher, Lahno and Trautmann2018) and their references.
Most studies on decisions to trust have so far focused on relations with risk attitudes. Fehr (Reference Fehr2009) reviewed the existing literature and argued that trust decisions are not just a special case of decision under risk. In decisions under social uncertainty, like the betrayal uncertainty faced in the trust decision, other components of preferences play important roles. Our study supports this claim. Even if risk attitudes of trustors play no role in their decisions to trust (Ashraf et al. Reference Ashraf, Bohnet and Piankov2006; Eckel and Wilson Reference Eckel and Wilson2004; Houser et al. Reference Houser, Schunk and Winter2010), ambiguity attitudes matter. Our measures of ambiguity attitude describe attitudes of our subjects specifically toward the betrayal ambiguity that they face in the trust game. We have shown that aversion to this ambiguity reduces people’s tendency to trust others. In addition, the ambiguity-generated likelihood insensitivity dampens the tendency of people to act on their beliefs about the trustworthiness of others. Clots-Figueras et al. (Reference Clots-Figueras, González and Kujal2016) and Evans and Krueger (Reference Evans and Krueger2017) considered effects of information provision on trust games, both in the form of objective risks and in the form of ambiguous risks. The former study found no significant differences, but the latter found more effect from objective than from ambiguous information, suggesting that the latter information is less valuable and changes less relative to the real situation.
Our methodology allows for separating preference-based ambiguity attitudes from the belief component. This opens up the possibility to examine whether differences in attitudes or beliefs drive observed trust differences, e.g., concerning social groups and culture. Social groups (Etang et al. Reference Etang, Fielding and Knowles2011; Ferschtman and Gneezy Reference Ferschtman and Gneezy2001) and culture (Doney et al. Reference Doney, Cannon and Mullen1998; Bornhorst et al. Reference Bornhorst, Ichino, Kirchkamp, Schlag and Winter2010) have been argued to drive a wedge in trust. Another question concerns whether such differences are driven primarily by differences in preferences or in beliefs.
Belief measurements have been widely used in experimental economics, but invariably under the empirically invalid assumption of ambiguity neutrality. Ambiguity attitudes have therefore confounded such belief measurements so far. Using our techniques, we substantiated a number of hypotheses on trust and trustworthiness with evidence from revealed preference data and proper measurements of beliefs.
Our finding that optimistic beliefs about others’ trustworthiness (after correcting for ambiguity attitudes) increase trust decisions is similar to the findings of Ashraf et al. (Reference Ashraf, Bohnet and Piankov2006) and Sapienza et al. (Reference Sapienza, Toldra-Simats and Zingales2013). They used a variation of Berg et al. (Reference Berg, Dickhaut and McCabe1995) investment game, in which trustors could choose which part of their endowment to send to their trustee. The amount sent to the trustee would then be tripled, and the trustee decided how much of the amount received to send back to the trustor. To elicit subjects’ beliefs about their trustees’ trustworthiness, they asked subjects to estimate the amount their trustee would return. They found a positive correlation between subjects’ estimations of the amount returned and the amount that subjects sent.
Our measure of belief is directly expressed in terms of probabilities rather than indirectly through a point estimate of a money amount, and is directly derived from revealed preferences with incentivization. Sapienza et al. (Reference Sapienza, Toldra-Simats and Zingales2013) rewarded accurate estimates of average amounts that would be sent back by trustees, but their implementation was not fully incentive compatible. First, because minimal distances between the estimates and the actual amounts sent were rewarded, subjects did not have the incentive to truthfully reveal extreme expectations. Second, because subjects were rewarded for accurate estimates for each possible amount sent and sent back, hedging through strategic (and not truthful) guesses was possible.
Using our belief measurements, we also provided evidence confirming that introspective survey questions on trust are good measures of trust in the sense of belief in others’ trustworthiness. Whereas decisions in the trust game are affected by both beliefs and ambiguity attitudes, trust survey responses are only positively correlated with beliefs, and not with ambiguity attitudes. This provides an additional explanation for why survey and behavioral measures of trust may not be robustly related to each other. Moreover, we confirm that people’s beliefs about others are positively correlated with their own trustworthiness.
In the psychology literature, false consensus has been found, which describes people’s tendency to expect others to be close to themselves in characteristics, preferences, and so on (Ross et al. Reference Ross, Greene and House1977). For instance, people who are happy themselves expect a larger proportion of the population to be happy than unhappy people do. Although the name of this phenomenon suggests that it is a bias, later studies showed that it could be the result of rational Bayesian updating using one’s own type as a signal (Dawes Reference Dawes and Hogarth1990; Prelec Reference Prelec2004). Similar to Rubinstein and Salant (Reference Rubinstein and Salant2016), we find support for the self-similar reasoning in our game theoretical setting: people’s belief about others’ trustworthiness is correlated with their own trustworthiness. This result may explain why several studies found that survey measures of trust were correlated with people’s own trustworthiness. Combined with our finding that survey measures do capture beliefs in others’ trustworthiness, the self-similar reasoning in belief formation predicts that people’s own trustworthiness is correlated with their beliefs about others.
Interestingly, the aforementioned result indicates that prevalence of own type may determine the accuracy of beliefs about others in strategic interactions and, hence, it may also determine the earning of players acting on those beliefs. In our sample, the beliefs of the most prevalent type—the non-trustworthy one—are indeed closest to the actual distribution of trustworthiness. Previous findings that, on average, trusting people lost money (Berg et al. Reference Berg, Dickhaut and McCabe1995; Ashraf et al. Reference Ashraf, Bohnet and Piankov2006) may be explained by the trustworthy types not being prevalent in the samples considered.
7 Conclusion
Most studies on decisions to trust have so far focused on relations with risk attitudes (usually finding none) because ambiguity attitudes, while relevant, could not be measured there. We could measure them, by applying Baillon et al.’s (Reference Baillon, Huang, Selim and Wakker2018b) new method to games. Thus, we could analyze—and correct for—ambiguity attitudes. In particular, we could correct belief measurements (e.g., about another person being trustworthy) this way. Belief measurements have been widely used in experimental economics, but invariably under the empirically invalid assumption of ambiguity neutrality. These belief measurements have so far been confounded by ambiguity attitudes.
We used our method to investigate the role of ambiguity in trust games. We found that the motivational ambiguity aversion reduces people’s trusting behavior. The cognitive likelihood insensitivity, not studied before in game theory, dampens the effect of people’s beliefs about others’ trustworthiness on their trust decisions. By analyzing and correcting belief measurements for ambiguity attitudes, we could shed new light on some unsettled issues in the literature. Thus, based on revealed preference data, we showed that survey trust questions do capture people’s beliefs about others’ trustworthiness. Moreover, people’s beliefs about others are positively correlated with their own trustworthiness. Hence, own type serves as a signal about others, explaining why trustworthy people lose excessively if most others are untrustworthy. This paper has shown how to reckon with ambiguity attitudes when studying human behavior in strategic situations, and the desirability to do so.
Appendix: Numerical illustration
This appendix illustrates numerically how ignoring ambiguity attitudes can lead to wrong conclusions about social preferences in the trust game. To focus on ambiguity and simplify the analysis, we assume that both players maximize expected utility for risk. Many social preference models have been used to analyze the trust game and to justify non-selfish choices by the trustee (Cox et al. Reference Cox, Friedman and Gjerstad2007; Galizzi and Navarro-Martínez Reference Galizzi and Navarro-Martínez2017; Smith and Wilson Reference Smith and Wilson2017). Because of its simplicity, we use Fehr and Schmidt’s (Reference Fehr and Schmidt1999) inequity aversion model. The trustee is affected by inequality aversion, so that she may, for instance, prefer (15, 15) to (10, 18). She is also affected by guilt, inducing an extra dislike of outcomes for the trustor below 10 that cause the trustor to suffer from having trusted. Depending on the strength of these effects, she may prefer either of R, M, or S, and the trustor is uncertain about this.Footnote 14 We focus on the trustor’s decision in what follows. We assume that the trustor likes to gamble as much on R, M, and S, so that these events have the same matching probability. If the trustor is ambiguity neutral, maximizing expected utility, then the subjective probabilities of these events are 1/3, and so are their matching probabilities and decision weights. Her utility function is

with a her aversion to being richer and b her aversion to being poorer.Footnote 15 In this game, a is irrelevant because the trustor is always poorer. We assume a = 0. We first present four cases and then discuss them.
Case 1 [no aversion to inequality and ambiguity neutrality]. The trustor is ambiguity neutral and b = 0. Trust has utility
 Trust is chosen.
Case 2 [aversion to inequality and ambiguity neutrality]. The trustor is ambiguity neutral and b = 0.15. Trust has utility
Distrust is chosen.Case 3 [no aversion to inequality and ambiguity aversion]. Here b = 0. But, because no known objective probabilities have been provided, the trustor perceives ambiguity. She is averse to ambiguity, and, relative to Case 1, pays extra attention to deviations in unfavorable directions. She therefore assigns extra weight 0.50 to the unfavorable S, and only weight 0.50 to the expected utility of Case 1.Footnote 16 The utility of the trust decision is 0.50 × 8 + 0.50 × 11 = 9.50 < 10. Distrust is chosen.
Case 4 [aversion to inequality and a-insensitivity]. Here b = 0.15. The trustor perceives ambiguity. Now, because of ambiguity, she reckons more with deviations in both directions (favorable and unfavorable), rather than only with unfavorable directions as in Case 2. It is like increasing variance rather than decreasing expectation. She assigns extra weight 0.25 to the favorable R, extra weight 0.25 to the unfavorable S, and only weight 0.50 to the expected utility of Case 2.Footnote 17 The utility of trust is 0.25 × 5.9 + 0.25 × 15 + 0.50 × 9.9 = 10.18 > 10. Trust is chosen.


The four cases show how ambiguity attitudes can confound the analyses of social preferences. A researcher who does not reckon with ambiguity aversion in Case 3 may confuse it with Case 2 and erroneously conclude that there is inequality aversion. Similarly, Case 4 may be confused with Case 1 with the erroneous conclusion that there is no inequality aversion. Galizzi and Navarro-Martínez (Reference Galizzi and Navarro-Martínez2017) reported negative findings on the external validity of social preference models in game theory. Correcting for ambiguity attitudes may help to improve the case.


 Open access