Hostname: page-component-586b7cd67f-t7czq Total loading time: 0 Render date: 2024-11-25T16:22:21.946Z Has data issue: false hasContentIssue false

Responses of soil–plant C, N, and P concentrations and stoichiometry to contrasting application rates of biochar to subtropical paddy field

Published online by Cambridge University Press:  09 August 2023
Qiang Jin
Affiliation:
Key Laboratory of Humid Sub-tropical Eco-Geographical Process of Ministry of Education, Fujian Normal University, Fuzhou, China College of Resources and Environmental Science and Engineering, Hubei University of Science and Technology, Xianning, China
Weiqi Wang*
Affiliation:
Key Laboratory of Humid Sub-tropical Eco-Geographical Process of Ministry of Education, Fujian Normal University, Fuzhou, China
Xu Song
Affiliation:
Key Laboratory of Humid Sub-tropical Eco-Geographical Process of Ministry of Education, Fujian Normal University, Fuzhou, China
Jordi Sardans*
Affiliation:
CSIC, Global Ecology Unit CREAF-CSIC-UAB, 08913 Bellaterra, Catalonia, Spain CREAF. 08913 Cerdanyola del Vallès, Catalonia, Spain
Xuyang Liu
Affiliation:
Key Laboratory of Humid Sub-tropical Eco-Geographical Process of Ministry of Education, Fujian Normal University, Fuzhou, China
Shaoying Lin
Affiliation:
Key Laboratory of Humid Sub-tropical Eco-Geographical Process of Ministry of Education, Fujian Normal University, Fuzhou, China
Akash Tariq
Affiliation:
State Key Laboratory of Desert and Oasis Ecology, Xinjiang Institute of Ecology and Geography, Chinese Academy of Sciences, Urumqi, China Cele National Station of Observation and Research for Desert-Grassland Ecosystems, Cele, China
Fanjiang Zeng
Affiliation:
State Key Laboratory of Desert and Oasis Ecology, Xinjiang Institute of Ecology and Geography, Chinese Academy of Sciences, Urumqi, China Cele National Station of Observation and Research for Desert-Grassland Ecosystems, Cele, China
Josep Peñuelas
Affiliation:
CSIC, Global Ecology Unit CREAF-CSIC-UAB, 08913 Bellaterra, Catalonia, Spain CREAF. 08913 Cerdanyola del Vallès, Catalonia, Spain
*
Corresponding authors: Weiqi Wang; Email: [email protected]; Jordi Sardans; Email: [email protected]
Rights & Permissions [Opens in a new window]

Summary

Biochar is increasingly used in crop production as a fertilizer; however, its effects on nutrient cycling and stoichiometry in rice paddy soil–plant systems are unclear. We tested for effects of contrasting rates of biochar on soil and rice plant organ carbon (C), nitrogen (N), and phosphorus (P) concentrations and stoichiometry and soil physicochemical properties in early and late paddies. Overall, biochar reduced soil bulk density by an average of 7.4%, while application at 10, 20, and 40 t ha−1 increased soil C and N concentrations in early paddies by 31.6, 41.3, and 104.2%, respectively, and by 8.0, 5.0, and 21.8%, respectively; in late paddies, there were increases of 23.0, 94.1, and 117.0%, respectively, and 6.7, 15.4, and 18.0%, respectively (P < 0.05). Following biochar application at 10, 20, and 40 t ha−1, soil concentration of P decreased in early paddies by 10.9, 19.0, and 13.9%, respectively, and increased in late paddies by 4.3, 16.4, and 20.1%, respectively. Biochar increased ratios of soil C:N and C:P in early and late paddies (P < 0.05), and there was no effect on concentration and stoichiometry of soil available nutrients. Biochar reduced rice plant organ concentration of N and P in early rice and increased leaf N:P ratios. Despite the biochar application improved nutrient status in plant–soil system, we did not observe a significant increase in yield (P > 0.05). According to the N:P value of leaves between treatments, it was found that biochar alleviated the current situation of N limitation in paddy fields during the mature period and transformed the N limitation of early rice into a joint limitation of N and P. These results show that the addition of biochar to subtropical paddy soils leads to a short-term reduction in soil bulk density and increases in soil C and N concentrations and soil fertility. Thus, biochar applied at optimal rates is likely to improve the sustainability of subtropical paddy rice production.

Type
Research Article
Copyright
© The Author(s), 2023. Published by Cambridge University Press

Introduction

Biochar is a carbon (C)-rich product formed from the pyrolysis of biomass (Sun et al., Reference Sun, He, Zhang, Shao and Xu2016a), and the application of biochar to soils could increase C fixing, indicating its potential role in the mitigation of climate change (Lehmann, Reference Lehmann2007). In addition, biochar may increase levels of soil pH and soil organic matter concentration and promote biochemical cycling of soil nitrogen (N) and phosphorus (P) to improve soil fertility and availability of nutrients to plants (Abiven et al., Reference Abiven, Hund, Martinsen and Cornelissen2015; Hossain et al. Reference Hossain, Bahar, Sarkar, Donne, Ok, Palansooriya, Kirkham, Chowdhury and Bolan2020). However, negative impacts of biochar applications to soils have been reported, including on crop growth. For example, Feng et al. (Reference Feng, He, Xue, Liu, Sun, Guo, Wang and Zheng2021) found that the application of 3% biochar restricted growth of rice and nitrogen use efficiency, while field growth of wheat was inhibited following soil applications of 4.5% oak biochar (Aguilar-Chávez et al., Reference Aguilar-Chávez, Díaz-Rojas, Cárdenas-Aquino, Dendooven and Luna-Guido2012), likely as a result of reduced nutrient utilization and release of high levels of salt concentrations and phytotoxic chemicals from the biochar (Aguilar-Chávez et al., Reference Aguilar-Chávez, Díaz-Rojas, Cárdenas-Aquino, Dendooven and Luna-Guido2012). While impacts of biochar on forest and dryland agricultural ecosystems tend to be well studied (Herrmann et al., Reference Herrmann, Lesueur, Robin, Robain, Wiriyakitnateekul and Bräu2019; Zhang et al., Reference Zhang, Shi, Zhou and Ma2019a), impacts on rice paddy field ecosystems, with heterogeneous water and fertilizer management regimes, remain less clear (Zhang et al., Reference Zhang, Bian, Pan, Cui, Hussain, Li, Zheng, Zheng, Zhang, Han and Yu2012). Currently, most of the research is on single-season planting, while the research on double-season planting is insufficient (Das et al., Reference Das, Gwon, Khan, Jeong and Kim2020). Thus, there is an urgent need to understand the effects of applications of biochar to paddy soils, as a possible tool to improve the sustainability of rice, as a global staple food crop.

Biological and environmental stoichiometric ratios of elements, such as in organisms and soils (Cleveland and Liptzin, Reference Cleveland and Liptzin2007), allow a greater understanding of the influence of plant–soil interactions on nutrient cycling and limitation of geochemical elements (Mooshammer et al., Reference Mooshammer, Wanek, Hämmerle, Fuchslueger, Hofhansl, Knoltsch, Schnecker, Takriti, Watzka, Wild, Keiblinger, Zechmeister-Boltenstern and Richter2014; Zechmeister-Boltenstern et al., Reference Zechmeister-Boltenstern, Keiblinger, Mooshammer, Peñuelas, Richter, Sardans and Wanek2015). The principal elements of soils, carbon (C), nitrogen (N), and phosphorus (P) drive balances in ecosystem productivity (Elser et al., Reference Elser, Bracken, Cleland, Gruner, Harpole, Hillebrand, Ngai, Seabloom, Shurin and Smith2007), as they represent a large proportion of dry matter concentration of plants (C) (Ågren, Reference Ågren2008) and are essential for plant growth (N and P) (Elser et al., Reference Elser, Bracken, Cleland, Gruner, Harpole, Hillebrand, Ngai, Seabloom, Shurin and Smith2007). Thus, stoichiometric ratios of soil C, N, and P indicate ecosystem structure and function (Liu et al., Reference Liu, Ma, Ma and Li2017). However, soil C, N, and P stoichiometry is affected by complex natural and human factors (Zhang et al., Reference Zhang, Song, Lu and Xue2013), where soil C:P and C:N reflect the variation in C sequestration capacity of plants with nutrient availability and plant growth rate (Ågren, Reference Ågren2004; Sun et al., Reference Sun, Yu, Shugart and Wang2016b). Given soil–plant C, N, P stoichiometric ratios vary with geographic region (Hu et al., Reference Hu, Li, Xie, Deng and Chen2018), exogenous inputs (Shen et al., Reference Shen, Wu, Fan, Liu, Guo, Duan, Hu, Lei and Wei2019), soil and vegetation type (Yu et al., Reference Yu, Wang, Huang, Lin, Vadeboncoeur, Searle and Chen2018), and, in agroecosystems, with crop species (Wang et al., Reference Wang, Min, Sardans, Wang, Asensio, Bartrons and Peñuelas2016a), particularly in the context of climate change (Tian et al., Reference Tian, Reich, Chen, Xiang, Luo, Shen, Meng, Han and Niu2019). It is likely that applications of biochar to agricultural soils affect soil–plant concentrations and stoichiometry of C, N, and P.

Paddy rice is a staple food for more than 60% of the global population; paddy rice cultivation in China covers an area of 28.4 million hm2, accounting for nearly 30% of global paddy production (IRRI, 2009).While the application of biochar as a soil improver may improve the soil–plant N-P cycle, effects on paddy soil–plant C, N, and P are unclear (Li et al., Reference Li, Liang and Shangguan2017) and impacts on wider paddy soil physicochemical properties, such as soil bulk density, soil salinity, nutrient availability, stoichiometry, and rice yields, are required exploration. For example, following the application of biochar to paddy soils, concentration of soil organic matter has been shown to increase, with no effect on soil available P (Chen et al., Reference Chen, Liu, Ali, Zhou, Zhan, Chen, Pan and Zeng2020), along with increases in crop yields, due to higher levels of soil pH (Wang et al., Reference Wang, Liu, Shen, Chen, Li, Jiang and Wu2018a). But analysis of impacts on stoichiometry has tended to focus on the separate components of plants and soils (Shen et al., Reference Shen, Wu, Fan, Liu, Guo, Duan, Hu, Lei and Wei2019; Zhang et al., Reference Zhang, Zhao, Lin, Hu, Hänninen and Wu2019b), rather than the soil–plant system. Therefore, the objectives of this study were to quantify the responses of subtropical paddy soil properties and soil–plant C, N, and P concentrations and stoichiometry to contrasting biochar application rates as a potential tool to improve the sustainability of paddy rice production.

Materials and Methods

Study sites

The experimental paddy field study site was located at the Rice Research Institute of the Fujian Academy of Agricultural Sciences at Wufeng (26.1°N, 119.3°E), where the climate conditions are subtropical maritime monsoon, with an annual average temperature and precipitation of 19.6 ºC and 800–1500 mm, respectively, and an annual frost-free period of 330 d (Fig. S1). The study site is located on an alluvial plain, where surface soils (0–15 cm) comprise 12, 28, and 60% clay, sand, and silt, respectively, with a pH of 6.5, organic C, total N, and total P concentration of 18.16, 1.93, and 1.80 g kg−1, respectively, and soil available P, NH4 +-N, and NO3--N concentration of 87.48, 24.91, and 4.51 mg kg−1, respectively (Wang et al., Reference Wang, Zeng, Sardans, Wang, Zeng and Peñuelas2016b). Rice production in the region is characterized by an early-late paddy-vegetable rotation, and we cultivated ‘Hesheng No. 10’ (conventional) and ‘Qinxiangyou 212’ (sterile hybrid) from April 21, 2016 to July 6, 2016 and from July 28, 2016 to October 31, 2016, respectively. Rice plants were machine-inserted into soils at 14 × 28 cm spacings, with nursery periods of early and late paddies of about 1 month and 15 days, respectively. Compound fertilizers (N:P2O5:K2O = 16%:16%:16%) were applied prior to transplantation at 42, 40, and 40 kg ha−1, respectively, at the splitting stage, 1 week after transplantation at 35, 20, and 20 kg ha−1, respectively, and then at panicle formation (8 weeks after transplantation) at 18, 10, and 10 kg ha−1, respectively (Wang et al., Reference Wang, Neogi, Lai, Zeng, Wang and Zeng2017). The water management in the rice-growing period is to implement flooding management in the early stage of rice and implement a combination of roasting field, flooding, and moist irrigation after the tillering period.

Experimental design

We established three replicate 10-m2 plots of three biochar treatments (10, 20, and 40 t ha−1) and an untreated control that were arranged at random and each surrounded by 0.5 cm thick and 30 cm high PVC boards; plots were separated by a 1-m wide buffer. The biochar was prepared by slow pyrolysis at 600 °C for 90 min from rice straw, average temperature rise rate was between 3 and 5 ° C min−1, and the biochar particle size was 0.8 and 1.0 mm. Biochar nutrient information is provided in Table S1. Before application, a small amount of water was added to mix well biochar and soil. The biochar was screened through a 2-mm sieve before application. Further, it was added to 0–15 cm of soil on the first day before early and late rice transplanting in the same studied area.

Soil sampling and analysis

Soil samples from the 0 to 15 cm layer were collected at the splitting, jointing, flowering, and mature growth from three locations within each plot using a corer. Samples were bulked in a ziplock bag to form a composite sample per plot before they were taken to the laboratory in a portable incubator where plant residues and impurities were removed; then, soil samples were divided into two, with one portion stored at 4 °C and the other air-dried prior to analysis.

Soil total C (TC) and N (TN) concentrations were determined using a CN element analyzer (ElementarVario MAX CN, Hanau, Germany), and soil total P (TP) concentration was analyzed, following digestion using the HCIO4-H2SO4 method, in a continuous flow analyzer (San++, Skalar Corporation production, Breda, Netherlands). Dissolved organic C (DOC) was extracted using deionized water (water-to-soil ratio of 4:1); after centrifugation and shaking, the solution was filtered through a 0.45-μm filter membrane and DOC was measured using a TOC analyzer (TOC-VWP; Shimadzu, Kyoto, Japan). Available N (AN) was extracted using 2 mol L−1 of KCl and measured using a continuous flow analyzer (San++, Skalar Corporation production, Breda, Netherlands), while available P (AP) was extracted from a Mehlich III extract and measured using a continuous flow analyzer (Carter and Gregorich, Reference Carter and Gregorich2007).

Soil salinity and temperature were measured in the field using a salinity/temperature meter (2265FS, Spectrum Technologies Inc., Paxinos, USA). Soil pH was determined using a water-to-soil mass ratio of 2.5:1, shaken for 30 min and left for 30 min with a pH meter (STARTER 300, Parsippany, USA). Bulk density was measured using three 15 × 3 cm cores (Wang et al., Reference Wang, Min, Sardans, Wang, Asensio, Bartrons and Peñuelas2016a) and was estimated by core mass dry weight divided by core volume and represent the averaged bulk density of 0–15 cm. We measured iron (Fe) concentration, following leaching with 0.5 mol L−1 of HCl for 24 h, using o-phenanthroline colorimetry; then, Fe3+ was reduced to Fe2+ using hydroxylamine hydrochloride (Lu, Reference Lu1999).

Plant sampling and analysis

Mature rice plants (three plants were collected for each treatment) from the early and late paddies were collected at 92 and 106 days after transplantation, stored in a portable refrigerator, and taken to the laboratory. Then, the root, stem, and leaf material of the rice plants were dried at 70 ºC to a constant weight, milled using a grinder, passed through a 100-mesh sieve, and sealed in a plastic bag prior to analysis. Concentrations of C and N of the plant parts were measured using an elemental analyzer (CHNOS, Elemental Analyzer Vario EL III, Germany), and P concentration was measured, following digestion with HCIO4-H2SO4, using a continuous flow analyzer (San++, Skalar Corporation production, Breda, Netherlands).

Statistical analyses

We tested for treatment differences using one-way ANOVA, and associations between soil–plant nutrients and soil properties were tested using Pearson’s correlation analysis in SPSS 20.0 (SPSS Inc., Chicago, IL, USA). We mainly conducted repeated measurement analysis of variance on nutrient factors and growth period of rice and regression fitting relationship of soil nutrient factors. Redundancy analysis (RDA) was performed on each indicator and environmental factor using Canoco 5.0 software (Microcomputer Power, Ithaca, USA). We used Pearson’s correlation analysis in the corrplot packages of R to test for associations between soil element concentrations and stoichiometry and soil environmental factors.

Results

Soil physicochemical properties

The application of biochar at 40 t ha−1 increased soil salinity in early and late paddies (P < 0.05), and there were contrasting effects of biochar on pH between early and late paddies; overall, there were no within-season effects of biochar on soil temperature, bulk density, or pH (Fig. 1). Biochar application can increase soil Fe2+ concentration and decrease soil Fe3+ concentration (Fig. 2). The application of biochar at 40 t ha−1 increased soil Fe2+ concentration in rice flowering period (P < 0.05). We found growing season differences in soil temperature, salinity, pH, bulk density, and concentrations of Fe2+, Fe3+, and total Fe (P < 0.05, Table S2).

Figure 1. Effects of rate of biochar on soil physicochemical properties within rice growth stages in early and late paddies. Data are means ±SE; different lowercase letters indicate within-growth stage treatment differences at P < 0.05.

Figure 2. Effects of rate of biochar on soil Fe2+, Fe3+, and total Fe within rice growth stages in early and late paddies. Data are means ±SE; different lowercase letters indicate within-growth stage treatment differences at P < 0.05.

Soil carbon, nitrogen, and phosphorus concentrations

In early paddy of the growth period, concentration of TC and TN was greater following addition of biochar, while concentration of TP was decreased. In late paddy of the growth period, concentration of TC, TN, and TP was greater following the application of 20 and 40 t ha−1 of biochar (P < 0.05, Fig. 3). Effects of biochar treatment on soil TC and TP concentrations varied with rice growth stage in early and late paddies and on soil TN in late paddies (P < 0.05, Table S3).

Figure 3. Effects of rate of biochar on concentrations of soil C, N, and P within growth stages in early and late paddies. Data are means ±SE; different lowercase letters indicate within-growth stage treatment differences at P < 0.05.

There were no overall effects of biochar on DOC, AN, or AP, with the exception of lower levels of AP following the application of 10 t ha−1of biochar (P < 0.05; Fig. S2). Effects of biochar on soil AN varied with rice growth stage in late paddies (P < 0.05, Table S3).

There were positive associations between soil TN and TC in early and late paddies (P < 0.01), and for soil TP with TC (P < 0.01) and TN (P < 0.05) in late paddies; soil TP was negatively associated with TC (P < 0.05) and TN in early paddies (P < 0.01) (Fig. 4).

Figure 4. Regression analysis between soil C, N, P, DOC, available N, and available P in early and late paddies.

Soil nutrient stoichiometry

The application of biochar at 20 and 40 t ha−1 tended to increase C:N and C:P ratios in early and late paddy soils and increased N:P ratios in early paddy soils (P < 0.05, Fig. 5). With the exception of effects on N:P ratios in late paddy, effects of biochar on nutrient ratios varied with rice growth stage (P < 0.01, Table S4).

Figure 5. Effects of rate of biochar on soil C:N, C:P, and N:P ratios within growth stages in early and late paddies. Data are means ±SE; different lowercase letters indicate within-growth stage treatment differences at P < 0.05.

With the exception of ratios of DOC:AP in early paddy soils, where the application of biochar at 20 t ha−1 reduced DOC:AP ratios in early paddy soils (P < 0.05), there were no effects of biochar on ratios of soil DOC, AN, and AP in early or late paddy soils (Fig. S3). Effects of biochar on ratios of AN:AP varied with rice growth stage in late paddy soils (P < 0.05, Table S4).

Association between environmental conditions and soil nutrient stoichiometry

There was a greater number of associations between environmental variables and soil nutrients in paddy fields (Fig. 6). Soil concentration of TC was positively correlated with salinity (P < 0.05) and Fe2+ (P < 0.01) and negatively correlated with Fe3+ (P < 0.05), while soil concentration of TN was negatively correlated with pH (P < 0.05) and soil concentration of TP was positively correlated with salinity, Fe3+, and total Fe (P < 0.05); ratios of soil C:N were positively associated with salinity and Fe2+ (P < 0.01) and negatively correlated with Fe3+ (P < 0.05), while ratios of soil C:P were positively associated with Fe2+ (P < 0.01) and negatively correlated with Fe3+ (P < 0.05), and ratios of soil N:P were negatively correlated with salinity, Fe3+, and total Fe (P < 0.05).

Figure 6. Pearson’s correlation (a) and redundancy (b) analysis of association between soil nutrients and soil properties. (ST: soil temperature; BD: bulk density; * P < 0.05; **P < 0.01).

We know from RDA that Fe2+ and Fe3+ were the main environmental factors associating with soil nutrients and their stoichiometric ratios in paddy fields (P < 0.05, Fig. 6).

Plant nutrient concentrations and stoichiometry

Effects of rate of biochar on nutrient concentration and stoichiometry of plant organs were inconsistent between early and late paddies (Table 1). In early paddy, 20 t ha−1 of biochar reduced N concentration of stem and leaf material and increased P concentration of root and leaf material (P < 0.05), whereas in late paddy, this treatment increased concentration of N and P of stem material and P concentration of leaf material. In late paddy, 40 t ha−1of biochar increased stem and leaf concentration of N and root and stem concentration of P (P < 0.05).

Table 1. ANOVA of biochar differences in rice plant organ nutrient concentration and ratios in early and late paddies. Data are means ±SE; different lower case letters indicate differences at P < 0.05

In early paddy, the application of biochar at 20 and 40 t ha−1 increased root and stem ratios of C:N, while application at 10 t ha−1 increased stem C:N, C:P, and N:P ratios (P < 0.05). In late paddy, the application of biochar at 20 and 40 t ha−1 reduced stem and leaf ratios of C:N and the application of each of the three rates of biochar reduced stem ratios of C:P; the application of 10 and 20 t ha−1 of biochar reduced stem N:P ratios (P < 0.05).

Relationship between plant and soil nutrient stoichiometry

Soil TC was positively correlated with root TP and root C:N ratio, stem TP, and leaf TN (P < 0.05) and negatively correlated with stem TC (P < 0.05) and leaf C:N ratio (P < 0.01), while soil TN was positively correlated with root C:N ratio (P < 0.01) and soil TP was positively correlated with stem TN and TP and leaf TN (P < 0.05) and negatively correlated with leaf C:N ratio (P < 0.05) (Table 2).

Table 2. Pearson’s correlation analysis of associations between soil and plant nutrient concentration and stoichiometry

SC: soil total C concentration; SN: soil total N concentration; SP: soil total P concentration; SC:N: soil C:N ratio; SC:P: soil C:P ratio; SN:P: soil N:P ratio; RC: root organic C concentration; RN: root total N concentration; RP: root total P concentration; RC:N: root C:N ratio; RC:P: root C:P ratio; RN:P: root N:P ratio; STC: stem organic C concentration; STN: stem total N concentration; STP: stem total P concentration; STC:N: stem C:N ratio; STC:P: stem C:P ratio; STN:P: stem N:P ratio; LC: leaf organic C concentration; LN: leaf total N concentration; LP: leaf total P concentration; LC:N: leaf C:N ratio; LC:P: leaf C:P ratio; LN:P: leaf N:P ratio. * (P < 0.05), ** (P < 0.01).

Ratios of soil C:N were positively correlated with stem TP and leaf TN (P < 0.05) and negatively associated with stem TC (P < 0.01), stem TC:P ratios (P < 0.05), and leaf C:N ratios (P < 0.01); soil C:P ratios were positively correlated with root C:N ratios (P < 0.01) and negatively correlated with leaf TC and leaf C:N ratios (P < 0.05), and soil N:P ratios were positively associated with root C:N ratios (P < 0.01) (Table 2).

Rice yields

The application of biochar at 10 t ha−1 increased early and late rice yields by 15.7 and 16.9%, respectively, while application at 40 t ha−1reduced yields by 17.3 and 3.8%, respectively (P > 0.05, Fig. 7).

Figure 7. Effects of biochar application rate on rice yield in early and late paddies.

Discussion

Effects of biochar rate on paddy soil physicochemical properties

In this short-term study, the application of biochar reduced soil bulk density, consistent with previous research (Herath et al., Reference Herath, Camps-Arbestain and Hedley2013), likely due to its low bulk density (Bhogal et al., Reference Bhogal, Nicholson and Chambers2009). Iron is a trace element necessary for plant growth and development (Hussain et al., Reference Hussain, Min, Xiuxiu, Khan, Lifeng and Hui2019). We found that the soil concentration of Fe3+ gradually decreased from the splitting growth stage to flowering, before increasing during mature rice growth, likely reflecting the transition from wet to dry paddy conditions. Under flooded conditions, Fe3+ reduces to Fe2+ that is fixed as iron oxide and released into soil pore water. In contrast under dry, aerobic conditions, Fe2+ is gradually oxidized to Fe3+ (Sun et al., Reference Sun, Qian, Shaaban, Wu, Hu and Hu2019).

Effects of biochar rate on paddy soil nutrient concentrations

In this study, the application of biochar increased paddy soil concentration of C and N due to its concentration of unstable C and N that is subsequently converted to soil organic C and N (Liang et al., Reference Liang, Ji, He, Su, Liu and Tian2014). The concentration of N produced from low-nutrition lignocellulosic raw materials leads to short-term increases in soil N (Gul and Whalen, Reference Gul and Whalen2016; Luo et al., Reference Luo, Durenkamp, De Nobili, Lin and Brookes2011). In addition, the large number of carbonaceous bonds with complex cross-linking networks in biochar that represents a more persistent form of C than preexisting organic C (Bhaduri et al., Reference Bhaduri, Saha, Desai and Meena2016; Knicker et al., Reference Knicker, González-Vila and González-Vázquez2013). We found that effects of biochar on soil P concentrations contrasted between early and late paddies, where P concentration was decreased in early paddy soils and increased in late paddy soils. This may be due to incomplete digestion of P by HClO4 after biochar application and possible sorption of P by residual biochar (Mukherjee and Zimmerman, Reference Mukherjee and Zimmerman2013; Takaya et al., Reference Takaya, Fletcher, Singh, Anyikude and Ross2016), the timing of application and soil concentration of coexisting anions and other nutrients (Qian et al., Reference Qian, Zhang, Hu and Jiang2013). The chemical composition and surface characteristics of the biochar, as alkaline biochar is known to convert P from mobile to recalcitrant pools (Chintala et al., Reference Chintala, Schumacher, McDonald, Clay, Malo, Papiernik, Clay and Julson2014), and can absorb the from rock weathering and leaching (Lü et al., Reference Lü, Freschet, Kazakou, Wang, Zhou and Han2015) that are particularly prevalent in subtropical regions.

Soil available nutrients are easily absorbed by plants during growth and indicate soil quality (Dong et al., Reference Dong, Zhang, Wang, Dai, Sun, Qiu and Yang2012; Su et al., Reference Su, Zhao, Dong and Chen2019). In this study, there was no effect of biochar on soil concentration of DOC, AN, or AP (Fig. 4), showing that, although biochar fixes C (Lehmann, Reference Lehmann2007), it does not increase the short-term availability of soil nutrients but suppose the short-term increase of N and P soil storing capacity. In addition, the pore structure of biochar provides a good habitat for soil microorganisms, increases nutrient availability, and promotes nutrient absorption by rice (Hossain et al., Reference Hossain, Bahar, Sarkar, Donne, Ok, Palansooriya, Kirkham, Chowdhury and Bolan2020). Biochar may decelerate the short-term release of available nutrients, improving the sustainability of paddy rice production, due to high chemical recalcitrance and resistance to biodegradation (Diatta et al., Reference Diatta, Fike, Battaglia, Galbraith and Baig2020).

In addition, biochar contains a high nutrient concentration, and we found that biochar application increased total soil N and P concentration, suggesting that an increase in total concentration in the short term may be translated to increases in available forms at longer time (Bhaduri et al., Reference Bhaduri, Saha, Desai and Meena2016).

Effects of biochar rate on stoichiometry of paddy soil nutrients

Studies have shown that microbial activity and decomposition of organic matter are enhanced at soil C:N ratios <25 (Mooshammer et al., Reference Mooshammer, Wanek, Hämmerle, Fuchslueger, Hofhansl, Knoltsch, Schnecker, Takriti, Watzka, Wild, Keiblinger, Zechmeister-Boltenstern and Richter2014). In this study, soil C:N ratios increased from <25 in the untreated control paddies to >25 in the mid- and later growth stages of early and late rice following the application of biochar, indicating higher levels of microbial activity and increased decomposition of organic matter. Soil C:P ratios reflect the availability of P, and soil N:P ratios reflect the supply of soil nutrients during plant growth (Wang and Yu, Reference Wang and Yu2008). We found that biochar increased soil C:P ratios that tended to increase during the early and vigorous rice growth stages (splitting and jointing) under irrigated conditions, before decreasing due to storage in senescent leaf material during the mature stage. We found that C:P ratios of late paddy soils were higher than for early paddy soils, due to differences in temperature, as indicated by the negative association between soil C:P ratios and soil temperature. Activity of microorganisms is positively associated with decomposition of C in biochar, and rises in temperature lead to increases in soil phosphatase activity (Sardans et al., Reference Sardans, Peñuelas and Estiarte2006), thereby enhancing the absorption of P by plants and further reducing soil P concentrations.

High soil N:P could indicate some degree of P deficiency in soil and plants (Guo et al., Reference Guo and Jiang2019; Du et al., Reference Du, Zhang, Zheng, Li, Wang, Huang, Yu, Ye and Liu2020). In this study, we found that there was a possible shift from N to P deficiency in rice growth following the application of biochar, likely as a result of short-term net N fixation and greater soil N concentrations (Gul and Whalen, Reference Gul and Whalen2016; Luo et al., Reference Luo, Durenkamp, De Nobili, Lin and Brookes2011) and P migration to the root system (Zhao et al., Reference Zhao, Li and Yang2021). In this study, there was no effect of biochar on soil available nutrient stoichiometry (Fig. S3), perhaps as a result of the complex environmental conditions of the paddy soils. For example, soil available nutrient stoichiometry is affected by changes in fractional mass and is closely related to levels of soil salinity, temperature, and pH. Given the effective release of nutrients from biochar may be short term, further research on longer-term release mechanisms is required to improve the efficiency of biochar as a fertilizer.

Effects of biochar rate on rice yield and plant organ nutrient stoichiometry

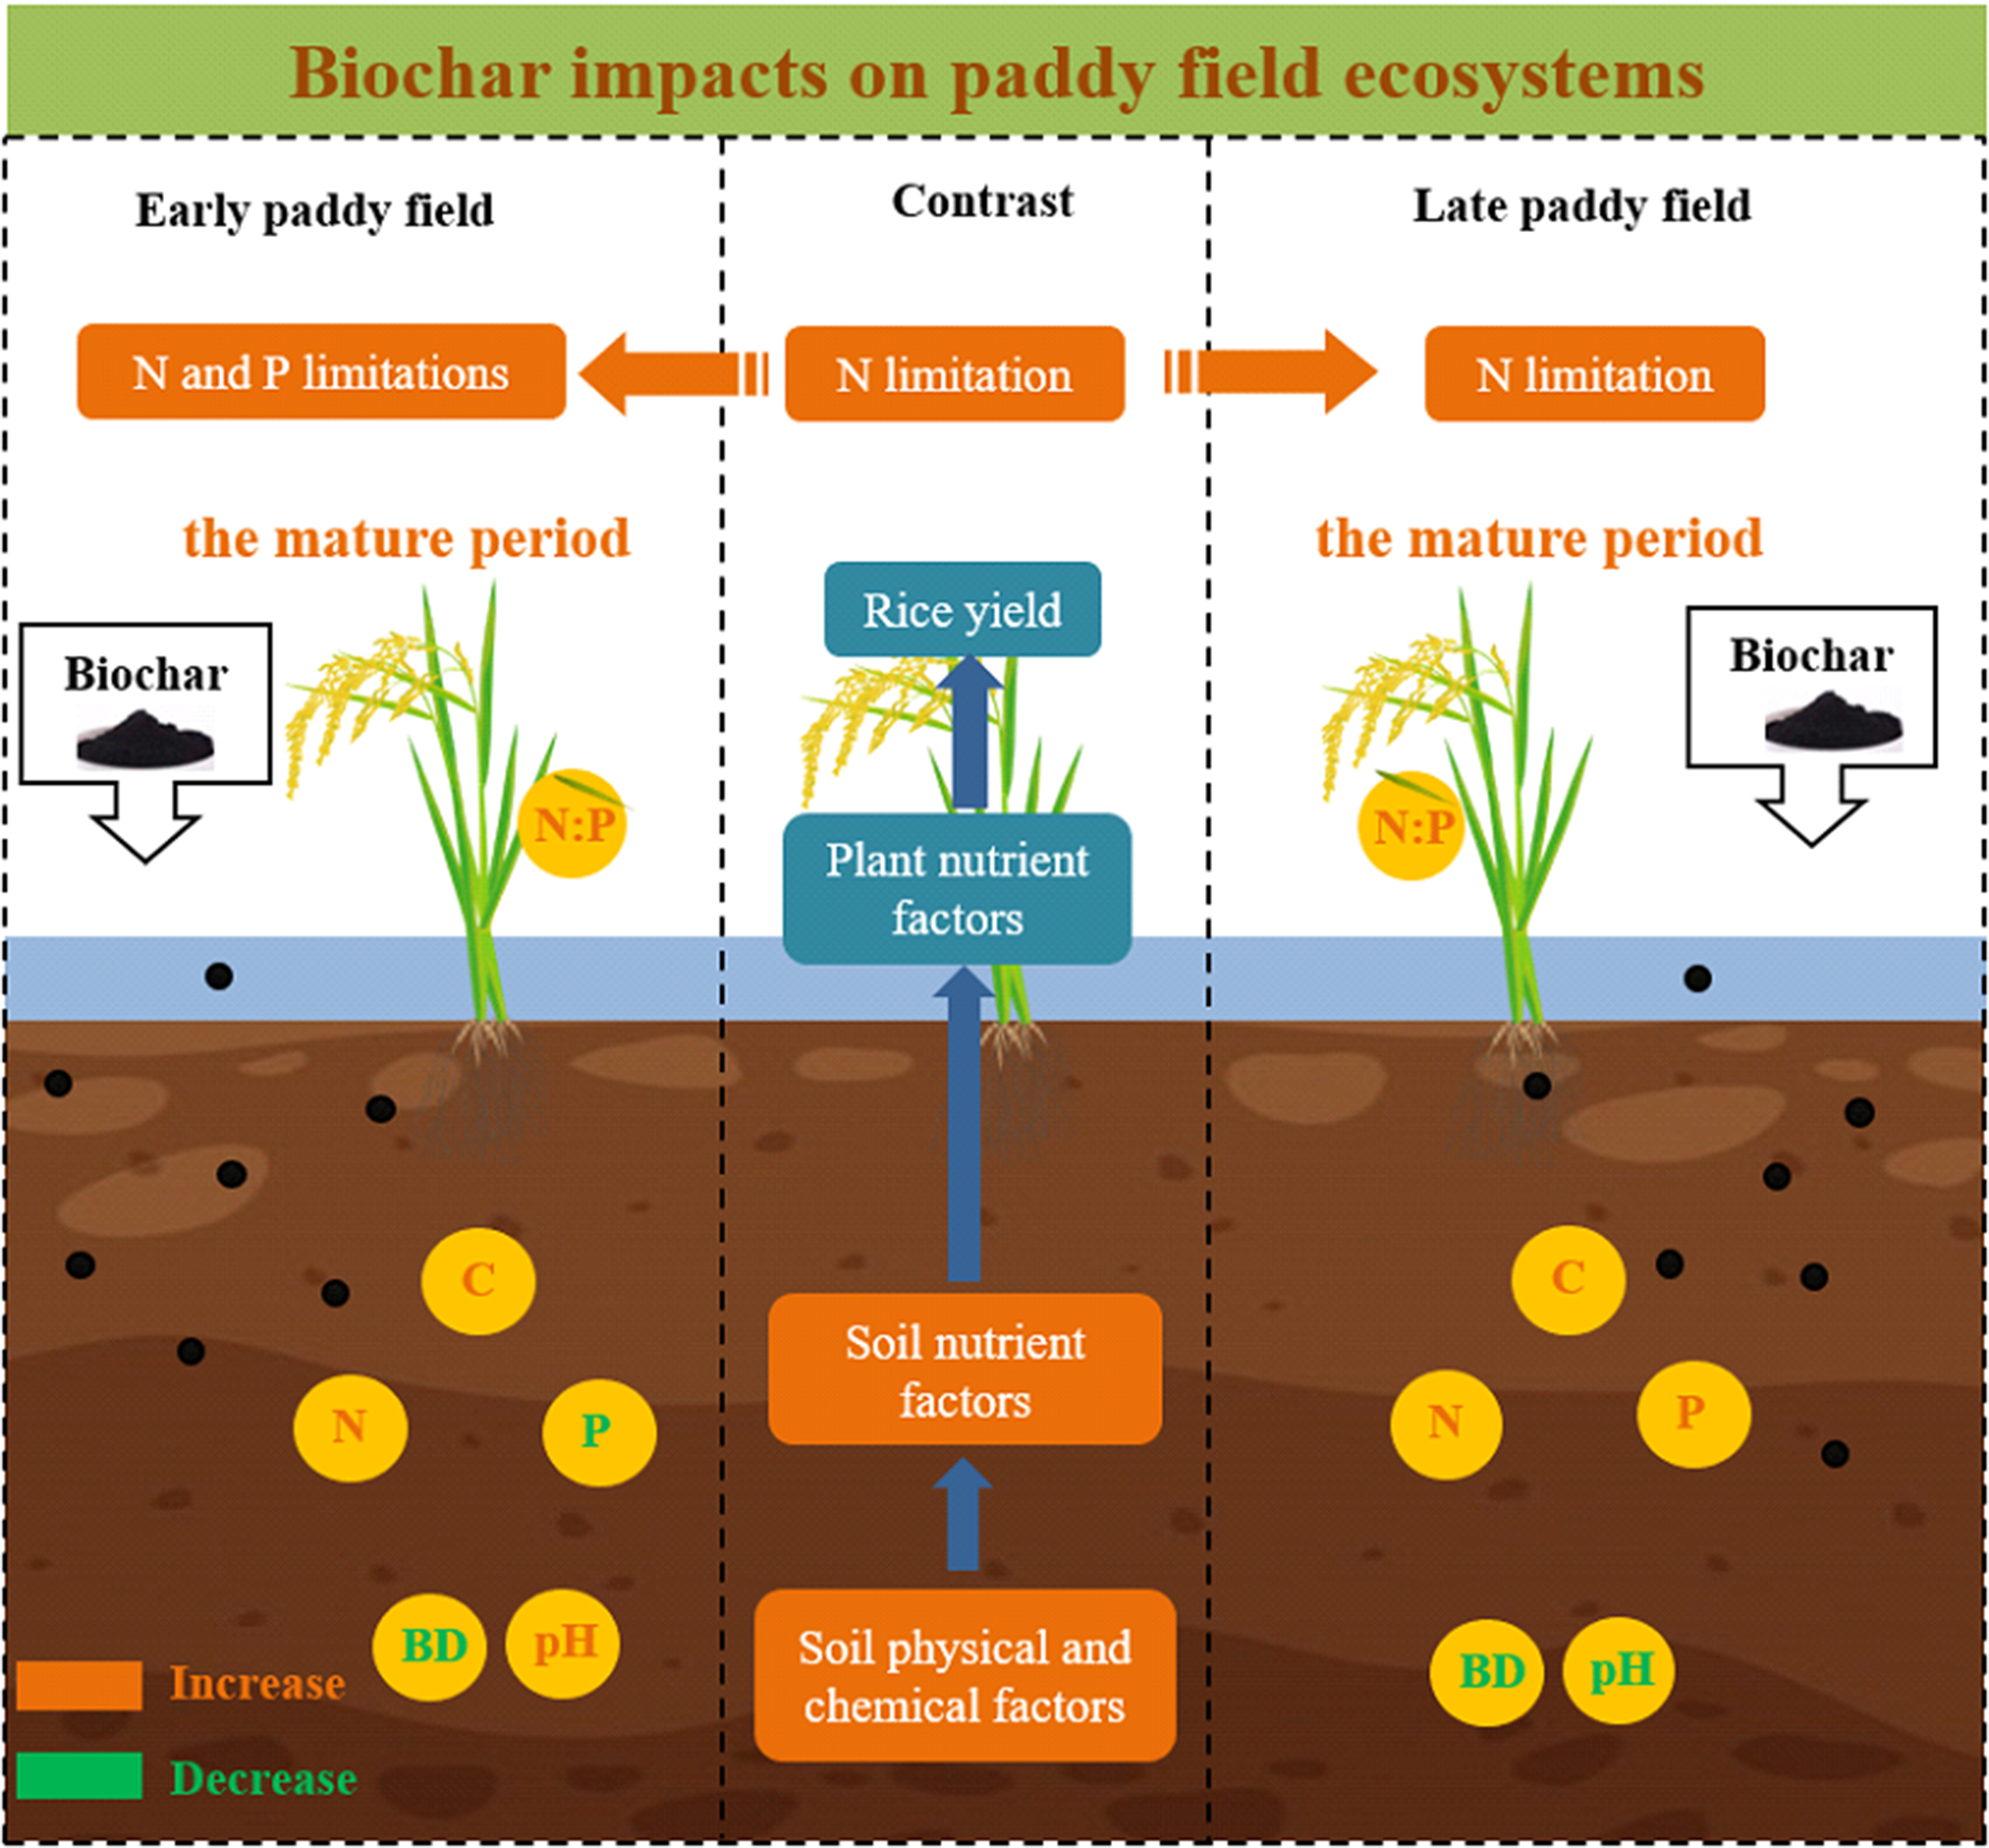
Despite the biochar application improved nutrient status in plant–soil system, we did not observe a significant increase in yield production (P > 0.05). Anyway, a moderate application on 10 t ha−1 could be tested in future studies as also a potential source to improve rice yield. In addition, studies have shown that variation in level of reduction in plant organ N concentration with rate of biochar may be related to inhibitory effects on plant growth at higher application rates (Kammann et al., Reference Kammann, Linsel, Gößling and Koyro2011). Supporting our finding that increases in TN concentration of early paddy soils, but not AN following biochar application, possibly due to increases in inert N, with limited effects on plant nutrient concentration. Limitation of N occurs when plant leaf N:P ratios are <14 and P limitation occurs at plant leaf N:P ratios of >16. Limitation of N and P limitation occurs at plant leaf ratios of 14 < N:P < 16 (Güsewell et al., Reference Güsewell, Koerselman and Jos2003). In this study, we found that the application of biochar to early paddies (during the mature period) shifted N limitation to N and P co-limitation (Fig. 8) due to lower plant P concentration. However, there were contrasting responses of plant organ nutrient concentrations and stoichiometry to biochar applications in early and late paddies. This may be due to the indirect effects of biochar on plants (Wu et al., Reference Wu, Ata-Ul-Karim, Singh, Wang, Wu, Liu, Fang, Zhou, Wang and Chen2019) mediated by factors, such as temperature, precipitation, light, and growth stage (Wang et al., Reference Wang, Lai, Abid, Neogi, Xu and Wang2018b). Our results suggest that biochar has a higher capacity for retaining N than P, indicating a more efficient biochar–soil N exchange, as previously suggested. Biochar produced through the pyrolysis of organic wastes tends to be acidic (pH range of 4.6–6.1). Under near-neutral soil conditions, such as the ones in our study, biochar has a greater capacity to absorb positively charged, low-mass soil components, such as NH4 +, than negatively charged ones, such as PO4- (Li et al., Reference Li, Dong, da Silva, de Oliveira, Chen and Ma2017). As a result, biochar is more efficient in the retention and control of the release and biochar–soil exchange of N than P.

Figure 8. Conceptual model diagram of effects on soil and plant stoichiometry of biochar in early and late paddies. (BD: bulk density. pH = soil pH).

Conclusions

Short-term experiments of biochar in subtropical rice paddies reduced bulk density, with smaller effects on dynamics of soil temperature and soil iron. Biochar increased levels of soil C and N concentration in early and late paddies, reduced soil P concentration of early paddies, and increased P concentration of late paddy soils; biochar increased C:N and C:P ratios of early and late paddy soils. The application of biochar (10 t ha−1) reduced rice plant organ concentration of N in early paddy. According to the N:P value of leaves between treatments, it was found that biochar alleviated the current situation of N limitation in paddy fields during the mature period and transformed the N limitation of early rice into a joint limitation of N and P. Based on these findings, we suggest that biochar with high capacity for P and overall N adsorption in neutral soils, and further capacity to supply these nutrients more gradually, reducing their leaching risk, should be applied to subtropical rice paddy soils. We recommend additional research on the mechanisms of nutrient release from biochar to improve soil fertility levels and rice yields.

Supplementary material

The supplementary material for this article can be found at https://doi.org/10.1017/S0014479723000108

Acknowledgements

This work was financially supported by the National Science Foundation of China (41571287; 42077087) and Hubei University of Science and Technology Doctoral Start-up Fund Project (BK202313). JP and JS acknowledge financial support from the Catalan Government grants SGR 2021-1333, the Spanish Government grant TED2021-132627B-I00 funded by MCIN, AEI/10.13039/501100011033 and the European Union NextGenerationEU/PRTR, and the Fundación Ramón Areces grant ELEMENTAL-CLIMATE.

Competing interests

The authors declare that they have no known competing financial interests or personal relationships that could have appeared to influence the work reported in this paper. All the authors have contributed to this study.

Footnotes

*

The original version of this article was published with an incorrect funding statement. A notice detailing this has been published and the errors rectified in the online PDF and HTML version.

References

Abiven, S., Hund, A., Martinsen, V. and Cornelissen, G. (2015). Biochar amendment increases maize root surface areas and branching: a shovelomics study in Zambia. Plant and Soil 395, 4555.CrossRefGoogle Scholar
Ågren, G.I. (2004). The C:N:P stoichiometry of autotrophs – theory and observations. Ecology Letters 7, 185191.CrossRefGoogle Scholar
Ågren, G.I. (2008). Stoichiometry and nutrition of plant growth in natural communities. Annual Review of Ecology, Evolution, and Systematics 39, 153170.CrossRefGoogle Scholar
Aguilar-Chávez, Á., Díaz-Rojas, M., Cárdenas-Aquino, M.d.R., Dendooven, L. and Luna-Guido, M. (2012). Greenhouse gas emissions from a wastewater sludge-amended soil cultivated with wheat (Triticum spp. L.) as affected by different application rates of charcoal. Soil Biology and Biochemistry 52, 9095.CrossRefGoogle Scholar
Bhaduri, D., Saha, A., Desai, D. and Meena, H.N. (2016). Restoration of carbon and microbial activity in salt-induced soil by application of peanut shell biochar during short-term incubation study. Chemosphere 148, 8698.CrossRefGoogle ScholarPubMed
Bhogal, A., Nicholson, F.A. and Chambers, B.J. (2009). Organic carbon additions: effects on soil bio-physical and physico-chemical properties. European Journal of Soil Science 60, 276286.CrossRefGoogle Scholar
Carter, M.R. and Gregorich, E.G. (2007). Soil Sampling and Methods of Analysis, 2nd Edn. Boca Raton: CRC Press, p. 1264. CrossRefGoogle Scholar
Chen, L., Liu, M., Ali, A., Zhou, Q., Zhan, S., Chen, Y., Pan, X. and Zeng, Y. (2020). Effects of biochar on paddy soil fertility under different water management modes. Journal of Soil Science and Plant Nutrition 20, 18101818.CrossRefGoogle Scholar
Chintala, R., Schumacher, T.E., McDonald, L.M., Clay, D.E., Malo, D.D., Papiernik, S.K., Clay, S.A. and Julson, J.L. (2014). Phosphorus sorption and availability from biochars and soil/biochar mixtures. CLEAN – Soil, Air, Water 42, 626634.CrossRefGoogle Scholar
Cleveland, C.C. and Liptzin, D. (2007). C:N:P stoichiometry in soil: is there a “Redfield ratio” for the microbial biomass? Biogeochemistry 85, 235252.CrossRefGoogle Scholar
Das, S., Gwon, H.S., Khan, M.I., Jeong, S.T. and Kim, P.J. (2020). Steel slag amendment impacts on soil microbial communities and activities of rice (Oryza sativa L.). Scientific Reports 10, 6746.CrossRefGoogle ScholarPubMed
Diatta, A.A., Fike, J.H., Battaglia, M.L., Galbraith, J.M. and Baig, M.B. (2020). Effects of biochar on soil fertility and crop productivity in arid regions: a review. Arabian Journal of Geosciences 13, 595.CrossRefGoogle Scholar
Dong, W., Zhang, X., Wang, H., Dai, X., Sun, X., Qiu, W. and Yang, F. (2012). Effect of different fertilizer application on the soil fertility of paddy soils in red soil region of Southern China. PLOS ONE 7, e44504.CrossRefGoogle ScholarPubMed
Du, L., Zhang, X., Zheng, Z., Li, T., Wang, Y., Huang, H., Yu, H., Ye, D. and Liu, T. (2020). Paddy soil nutrients and stoichiometric ratios as affected by anthropogenic activities during long-term tillage process in Chengdu Plain. Journal of Soils and Sediments 20, 38353845.CrossRefGoogle Scholar
Elser, J.J., Bracken, M.E.S., Cleland, E.E., Gruner, D.S., Harpole, W.S., Hillebrand, H., Ngai, J.T., Seabloom, E.W., Shurin, J.B. and Smith, J.E. (2007). Global analysis of nitrogen and phosphorus limitation of primary producers in freshwater, marine and terrestrial ecosystems. Ecology Letters 10, 11351142.CrossRefGoogle ScholarPubMed
Feng, Y., He, H., Xue, L., Liu, Y., Sun, H., Guo, Z., Wang, Y. and Zheng, X. (2021). The inhibiting effects of biochar-derived organic materials on rice production. Journal of Environmental Management 293, 112909.CrossRefGoogle ScholarPubMed
Gul, S. and Whalen, J.K. (2016). Biochemical cycling of nitrogen and phosphorus in biochar-amended soils. Soil Biology and Biochemistry 103, 115.CrossRefGoogle Scholar
Guo, X. and Jiang, Y.F. (2019). Spatial characteristics of ecological stoichiometry and their driving factors in farmland soils in Poyang Lake Plain, Southeast China. Journal of Soils and Sediments 19, 263274.CrossRefGoogle Scholar
Güsewell, S., Koerselman, W. and Jos, T.A.V. (2003). Biomass N:P ratios as indicators of nutrient limitation for plant populations in wetlands. Ecological Applications 13, 372384.CrossRefGoogle Scholar
Herath, H.M.S.K., Camps-Arbestain, M. and Hedley, M. (2013). Effect of biochar on soil physical properties in two contrasting soils: an Alfisol and an Andisol. Geoderma 209–210, 188197.CrossRefGoogle Scholar
Herrmann, L., Lesueur, D., Robin, A., Robain, H., Wiriyakitnateekul, W. and Bräu, L. (2019). Impact of biochar application dose on soil microbial communities associated with rubber trees in North East Thailand. Science of the Total Environment 689, 970979.CrossRefGoogle ScholarPubMed
Hossain, M.Z., Bahar, M.M., Sarkar, B., Donne, S.W., Ok, Y.S., Palansooriya, K.N., Kirkham, M.B., Chowdhury, S. and Bolan, N. (2020). Biochar and its importance on nutrient dynamics in soil and plant. Biochar 2, 379420.CrossRefGoogle Scholar
Hu, C., Li, F., Xie, Y., Deng, Z. and Chen, X. (2018). Soil carbon, nitrogen, and phosphorus stoichiometry of three dominant plant communities distributed along a small-scale elevation gradient in the East Dongting Lake. Physics and Chemistry of the Earth, Parts A/B/C 103, 2834.CrossRefGoogle Scholar
Hussain, S., Min, Z., Xiuxiu, Z., Khan, M.H., Lifeng, L. and Hui, C. (2019). Significance of Fe(II) and environmental factors on carbon-fixing bacterial community in two paddy soils. Ecotoxicology and Environmental Safety 182, 109456.CrossRefGoogle ScholarPubMed
IRRI (2009). World rice statistics: rough rice production by country and geographical region-FAO1961–2007. https://ricestat.irri.org/wrs/ Google Scholar
Kammann, C.I., Linsel, S., Gößling, J.W. and Koyro, H.-W. (2011). Influence of biochar on drought tolerance of Chenopodium quinoa Willd and on soil–plant relations. Plant and Soil 345, 195210.CrossRefGoogle Scholar
Knicker, H., González-Vila, F.J. and González-Vázquez, R. (2013). Biodegradability of organic matter in fire-affected mineral soils of Southern Spain. Soil Biology and Biochemistry 56, 3139.CrossRefGoogle Scholar
Lehmann, J. (2007). A handful of carbon. Nature 447, 143144.CrossRefGoogle ScholarPubMed
Li, H., Dong, X., da Silva, E.B., de Oliveira, L.M., Chen, Y. and Ma, L.Q. (2017) Mechanisms of metal sorption by biochars: biochar characteristics and modifications. Chemosphere 178, 466478.CrossRefGoogle ScholarPubMed
Li, S., Liang, C. and Shangguan, Z. (2017). Effects of apple branch biochar on soil C mineralization and nutrient cycling under two levels of N. Science of the Total Environment 607–608, 109119.CrossRefGoogle ScholarPubMed
Liang, X., Ji, Y., He, M., Su, M., Liu, C. and Tian, G. (2014). Simple N balance assessment for optimizing the biochar amendment level in paddy soils. Communications in Soil Science and Plant Analysis 45, 12471258.CrossRefGoogle Scholar
Liu, X., Ma, J., Ma, Z. and Li, L. (2017). Soil nutrient contents and stoichiometry as affected by land-use in an agro-pastoral region of northwest China. CATENA 150, 146153.CrossRefGoogle Scholar
Lu, R. (1999). Analysis Methods of Soil Science and Agricultural Chemistry. Beijing: Agriculture Science and Technology Press.Google Scholar
, X., Freschet, G.T., Kazakou, E., Wang, Z., Zhou, L. and Han, X. (2015). Contrasting responses in leaf nutrient-use strategies of two dominant grass species along a 30-yr temperate steppe grazing exclusion chronosequence. Plant and Soil 387, 6979.CrossRefGoogle Scholar
Luo, Y., Durenkamp, M., De Nobili, M., Lin, Q. and Brookes, P.C. (2011). Short term soil priming effects and the mineralisation of biochar following its incorporation to soils of different pH. Soil Biology and Biochemistry 43, 23042314.CrossRefGoogle Scholar
Mooshammer, M., Wanek, W., Hämmerle, I., Fuchslueger, L., Hofhansl, F., Knoltsch, A., Schnecker, J., Takriti, M., Watzka, M., Wild, B., Keiblinger, K.M., Zechmeister-Boltenstern, S. and Richter, A. (2014). Adjustment of microbial nitrogen use efficiency to carbon: nitrogen imbalances regulates soil nitrogen cycling. Nature Communications 5, 3694.CrossRefGoogle ScholarPubMed
Mukherjee, A. and Zimmerman, A.R. (2013). Organic carbon and nutrient release from a range of laboratory-produced biochars and biochar–soil mixtures. Geoderma 193–194, 122130.CrossRefGoogle Scholar
Qian, T., Zhang, X., Hu, J. and Jiang, H. (2013). Effects of environmental conditions on the release of phosphorus from biochar. Chemosphere 93, 20692075.CrossRefGoogle ScholarPubMed
Sardans, J., Peñuelas, J. and Estiarte, M. (2006). Warming and drought alter soil phosphatase activity and soil P availability in a Mediterranean shrubland. Plant and Soil 289, 227238.CrossRefGoogle Scholar
Shen, F., Wu, J., Fan, H., Liu, W., Guo, X., Duan, H., Hu, L., Lei, X. and Wei, X. (2019). Soil N/P and C/P ratio regulate the responses of soil microbial community composition and enzyme activities in a long-term nitrogen loaded Chinese fir forest. Plant and Soil 436, 91107.CrossRefGoogle Scholar
Su, B., Zhao, G., Dong, C. and Chen, X. (2019). Scale characteristics and effects on spatial variability of soil available nutrients. Applied Engineering in Agriculture 35, 221230.Google Scholar
Sun, J., He, F., Zhang, Z., Shao, H. and Xu, G. (2016a). Temperature and moisture responses to carbon mineralization in the biochar-amended saline soil. Science of the Total Environment 569–570, 390394.CrossRefGoogle ScholarPubMed
Sun, X., Yu, K., Shugart, H.H. and Wang, G. (2016b). Species richness loss after nutrient addition as affected by N:C ratios and phytohormone GA3 contents in an alpine meadow community. Journal of Plant Ecology 9, 201211.CrossRefGoogle Scholar
Sun, Z., Qian, X., Shaaban, M., Wu, L., Hu, J. and Hu, R. (2019). Effects of iron(III) reduction on organic carbon decomposition in two paddy soils under flooding conditions. Environmental Science and Pollution Research 26, 1248112490.CrossRefGoogle ScholarPubMed
Takaya, C.A., Fletcher, L.A., Singh, S., Anyikude, K.U. and Ross, A.B. (2016). Phosphate and ammonium sorption capacity of biochar and hydrochar from different wastes. Chemosphere 145, 518527.CrossRefGoogle ScholarPubMed
Tian, D., Reich, P.B., Chen, H.Y.H., Xiang, Y., Luo, Y., Shen, Y., Meng, C., Han, W. and Niu, S. (2019). Global changes alter plant multi-element stoichiometric coupling. New Phytologist 221, 807817.CrossRefGoogle ScholarPubMed
Wang, C., Liu, J., Shen, J., Chen, D., Li, Y., Jiang, B. and Wu, J. (2018a). Effects of biochar amendment on net greenhouse gas emissions and soil fertility in a double rice cropping system: a 4-year field experiment. Agriculture, Ecosystems & Environment 262, 8396.CrossRefGoogle Scholar
Wang, S. and Yu, G. (2008). Eco-stoichiometric characteristics of carbon, nitrogen, and phosphorus in ecosystems. Acta EcologicaSinica 8, 39373947.Google Scholar
Wang, W., Lai, D.Y., Abid, A.A., Neogi, S., Xu, X. and Wang, C. (2018b). Effects of steel slag and biochar incorporation on active soil organic carbon pools in a subtropical paddy field. Agronomy 8, 135.CrossRefGoogle Scholar
Wang, W., Min, Q., Sardans, J., Wang, C., Asensio, D., Bartrons, M. and Peñuelas, J. (2016a). Organic cultivation of jasmine and tea increases carbon sequestration by changing plant and soil stoichiometry. Agronomy Journal 108, 16361648.CrossRefGoogle Scholar
Wang, W., Neogi, S., Lai, D.Y.F., Zeng, C., Wang, C. and Zeng, D. (2017). Effects of industrial and agricultural waste amendment on soil greenhouse gas production in a paddy field in Southeastern China. Atmospheric Environment 164, 239249.CrossRefGoogle Scholar
Wang, W., Zeng, C., Sardans, J., Wang, C., Zeng, D. and Peñuelas, J. (2016b). Amendment with industrial and agricultural wastes reduces surface-water nutrient loss and storage of dissolved greenhouse gases in a subtropical paddy field. Agriculture, Ecosystems & Environment 231, 296303.CrossRefGoogle Scholar
Wu, P., Ata-Ul-Karim, S.T., Singh, B.P., Wang, H., Wu, T., Liu, C., Fang, G., Zhou, D., Wang, Y. and Chen, W. (2019). A scientometric review of biochar research in the past 20 years (1998–2018). Biochar 1, 2343.CrossRefGoogle Scholar
Yu, Z., Wang, M., Huang, Z., Lin, T.-C., Vadeboncoeur, M.A., Searle, E.B. and Chen, H.Y.H. (2018). Temporal changes in soil C-N-P stoichiometry over the past 60 years across subtropical China. Global Change Biology 24, 13081320.CrossRefGoogle ScholarPubMed
Zechmeister-Boltenstern, S., Keiblinger, K.M., Mooshammer, M., Peñuelas, J., Richter, A., Sardans, J. and Wanek, W. (2015). The application of ecological stoichiometry to plant–microbial–soil organic matter transformations. Ecological Monographs 85, 133155.CrossRefGoogle Scholar
Zhang, A., Bian, R., Pan, G., Cui, L., Hussain, Q., Li, L., Zheng, J., Zheng, J., Zhang, X., Han, X. and Yu, X. (2012). Effects of biochar amendment on soil quality, crop yield and greenhouse gas emission in a Chinese rice paddy: a field study of 2 consecutive rice growing cycles. Field Crops Research 127, 153160.CrossRefGoogle Scholar
Zhang, H., Shi, W., Zhou, M. and Ma, X. (2019a). Effect of biochar on nitrogen use efficiency, grain yield and amino acid content of wheat cultivated on saline soil. Plant, Soil and Environment 65, 8389.Google Scholar
Zhang, R., Zhao, Y., Lin, J., Hu, Y., Hänninen, H. and Wu, J. (2019b). Biochar application alleviates unbalanced nutrient uptake caused by N deposition in Torreya grandis trees and seedlings. Forest Ecology and Management 432, 319326.CrossRefGoogle Scholar
Zhang, Z., Song, X., Lu, X. and Xue, Z. (2013). Ecological stoichiometry of carbon, nitrogen, and phosphorus in estuarine wetland soils: influences of vegetation coverage, plant communities, geomorphology, and seawalls. Journal of Soils and Sediments 13, 10431051.CrossRefGoogle Scholar
Zhao, Y., Li, Y. and Yang, F. (2021). Critical review on soil phosphorus migration and transformation under freezing-thawing cycles and typical regulatory measurements. Science of the Total Environment 751, 141614.CrossRefGoogle ScholarPubMed
Figure 0

Figure 1. Effects of rate of biochar on soil physicochemical properties within rice growth stages in early and late paddies. Data are means ±SE; different lowercase letters indicate within-growth stage treatment differences at P < 0.05.

Figure 1

Figure 2. Effects of rate of biochar on soil Fe2+, Fe3+, and total Fe within rice growth stages in early and late paddies. Data are means ±SE; different lowercase letters indicate within-growth stage treatment differences at P < 0.05.

Figure 2

Figure 3. Effects of rate of biochar on concentrations of soil C, N, and P within growth stages in early and late paddies. Data are means ±SE; different lowercase letters indicate within-growth stage treatment differences at P < 0.05.

Figure 3

Figure 4. Regression analysis between soil C, N, P, DOC, available N, and available P in early and late paddies.

Figure 4

Figure 5. Effects of rate of biochar on soil C:N, C:P, and N:P ratios within growth stages in early and late paddies. Data are means ±SE; different lowercase letters indicate within-growth stage treatment differences at P < 0.05.

Figure 5

Figure 6. Pearson’s correlation (a) and redundancy (b) analysis of association between soil nutrients and soil properties. (ST: soil temperature; BD: bulk density; * P < 0.05; **P < 0.01).

Figure 6

Table 1. ANOVA of biochar differences in rice plant organ nutrient concentration and ratios in early and late paddies. Data are means ±SE; different lower case letters indicate differences at P < 0.05

Figure 7

Table 2. Pearson’s correlation analysis of associations between soil and plant nutrient concentration and stoichiometry

Figure 8

Figure 7. Effects of biochar application rate on rice yield in early and late paddies.

Figure 9

Figure 8. Conceptual model diagram of effects on soil and plant stoichiometry of biochar in early and late paddies. (BD: bulk density. pH = soil pH).

Supplementary material: File

Jin et al. supplementary material

Tables S1-S4 and Figures S1-S3

Download Jin et al. supplementary material(File)
File 738.9 KB