


Fig. 1 The sLORETA images showing statistical differences between aMCI– APOE ɛ4− and aMCI– APOE ɛ4+ group (3D-view and slice-view) in the P300 time-range. The three slice-view images below located the maximal difference between aMCI– APOE ɛ4− and aMCI– APOE ɛ4+ group (MNI coordinates x, y, z = 10, −35, 0). Negative difference was in blue color with reference of aMCI– APOE ɛ4+ group Abbreviations: aMCI: amnestic mild cognitive impairement; APOE: apoliprotein E; MNI: Montreal Neurological Institute; sLoreta: standardized low-resolution brain electromagnetic tomography analysis.
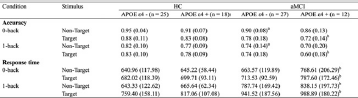
Table 1 Behavioral data (accuracy and response time) for healthy controls and a MCI patients with different APOE ɛ4 status.
Data are presented as mean ± standard deviation (SD). aMCI: amnestic mild cognitive impairement; APOE: apoliprotein E; HC: healthy controls.
aPost-hoc tests by Bonferroni's analysis further revealed the source of ANCOVA difference (P < 0.05, HC-APOE ɛ4−vs. aMCI-APOE ɛ4−).
bPost-hoc tests by Bonferroni's analysis further revealed the source of ANCOVA difference (P < 0.05, HC-APOE ɛ4+vs. aMCI-APOE ɛ4+).
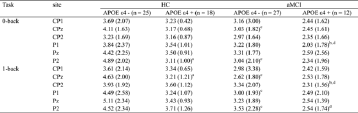
Table 2 ERP data (P300 amplitude) for healthy controls and aMCI patients with different APOE ɛ4 status.
Data are presented as mean ± standard deviation (SD); aMCI: amnestic mild cognitive impairement; APOE: apoliprotein E; HC: healthy controls.
aPost-hoc tests by Bonferroni's analysis further revealed the source of ANCOVA difference (P < 0.05, HC-APOE ɛ4− vs. HC-APOE ɛ4+).
b Post-hoc tests by Bonferroni's analysis further revealed the source of ANCOVA difference (P < 0.05, aMCI-APOE ɛ4− vs. aMCI-APOE ɛ4+).
cPost-hoc tests by Bonferroni's analysis further revealed the source of ANCOVA difference (P < 0.05, aMCI-APOE ɛ4− vs. HC-APOE ɛ4−).
dPost-hoc tests by Bonferroni's analysis further revealed the source of ANCOVA difference (P < 0.05, aMCI-APOE ɛ4+ vs. HC-APOE ɛ4+).


Comments
No Comments have been published for this article.