INTRODUCTION
According to the Centers for Disease Control and Prevention (CDC), ‘public health surveillance (PHS) is the ongoing, systematic collection, analysis, interpretation, and dissemination of data regarding a health-related event for use in public health actions to reduce morbidity and mortality and to improve health’ [Reference German1]. Thus, PHS systems are responsible for gathering and disseminating accurate and timely information in the event of a health emergency. The influenza A(H1N1) pandemic presented a challenge for PHS systems worldwide, especially in light of the fact that the World Health Organization (WHO) stated 4 years ago that many countries were unprepared to respond effectively to an emergency of this magnitude [Reference Ortiz2]. The comprehensive PHS system should be evaluated based on simplicity, flexibility, data quality, acceptability, sensitivity, positive predictive value, representativeness, timeliness, and stability. In addition, PHS systems that detect outbreaks should be tested in terms of their ability to identify the onset of exposure, initiate timely response actions, carry out data entry and processing, generate and disseminate alerts, and implement public health interventions [Reference Buehler3].
The epidemiological response capacity for infectious health problems is low throughout the world, even in countries with long traditions of epidemiological teaching and research. For example, in 2001 it was estimated that a satisfactory response to bioterrorism would require 600 new epidemiologists in the USA, but in that year 1076 graduates specialized in non-infectious chronic diseases and only 70 health professionals were trained in field epidemiology [Reference Smolinski, Hamburg and Lederberg4]. Additionally, a survey by the Council of State and Territorial Epidemiologists found that in comparison with the previous decade full-time equivalent positions in field epidemiology decreased from 1700 to 1400 [Reference Knobler5].
In the case of influenza, the WHO Global Influenza Surveillance Network (GISN), which has existed since 1952, is responsible for updating the influenza vaccine as well as global alert mechanisms in order to identify the emergence of influenza viruses with pandemic potential. It is important to note that the GISN's alert capability is limited because certain areas of the world are underrepresented [Reference Ortiz2]. In the case of the Americas, only 20 countries have at least one National Influenza Centre, and many of those that do not have centres are located in the tropical zone [Reference Viboud, Alonso and Simonsen6]. Therefore, the information received by the Pan American Health Organization (PAHO) regarding the influenza situation in the region is incomplete – a situation which is common in other regions of the world.
Since the beginning of the A(H1N1) pandemic, a question concerning both the scientific community and the general population has been whether health systems, particularly surveillance systems, are adequately responding to this worldwide challenge. Some experts argue that this question cannot be easily answered because there are no established criteria for adequately evaluating PHS systems. Benford's Law, also called the ‘Newcomb–Benford Law’, ‘Law of Anomalous Numbers’, or the ‘First-digit Law’ is a method that can help to overcome this obstacle [Reference Mensua, Mounier-Jack and Coker7]. In the case of the influenza A(H1N1) outbreak, the number of laboratory-confirmed cases can be used to determine whether or not the detection and reporting processes functioned properly. If the incidence follows the distribution described by Benford's Law, there is evidence that reporting was satisfactory. This indicator, along with the percentage of deaths observed in the cases, can serve to evaluate the quality and sensitivity of a PHS system. The objective of this study was to test a new method to evaluate the quality of reporting of national PHS systems to PAHO.
MATERIAL AND METHODS
This study used data from reports of individual countries prepared by the WHO, which were published online on 6 July 2009 (http://www.who.int/csr/don/2009_07_06/en/index.html), and the PAHO Pandemic A(H1N1) 2009 Interactive Map (http://new.paho.org/hq/images/atlas/en/atlas.html). These resources provide information according to epidemiological weeks 13–47 about the number of confirmed cases reported by countries in the Americas. This study used two indicators to make a preliminary evaluation of the quality of PHS reporting for each country, i.e. Benford's Law and mortality.
Benford's Law
This Law states that for a determined set of numbers, those whose leading digit is the number 1 will appear more frequently than those numbers that begin with other digits; the other digits appear with decreasing frequency. This can be expressed formally as
where for a series of numbers, P(d) is the probability that a digit will be the leading number [Reference Benford8, Reference Hill9]. While Benford's Law has been shown to be useful for a variety of topics [Reference Durtschi, Hillison and Pacini10], currently it is used most frequently to detect irregular or fraudulent data.
Since Benford's original paper [Reference Benford8] was published in 1938 numerous researchers have applied Benford's Law to different kinds of data [Reference Newcomb11–Reference Raimi13]. Recently, Formann provided a simple explanation: ‘the good fit of the Newcomb–Benford Law to empirical data can be explained by the fact that in many cases the frequency with which objects occur in “nature” is an inverse function of their size. Very small objects occur much more frequently than do small ones which in turn occur more frequently than do large ones and so on’ [Reference Formann14]. This can be applied to PHS as few cases are reported more frequently than many cases, and epidemic curves are distributed across multiple orders of magnitude (ones, tens, hundreds, etc.) [Reference Brown15]. In the context of the influenza A(H1N1) epidemic, there is evidence that the number of cases is being adequately reported when Benford's Law is fulfilled; therefore it is an indicator of the quality of information obtained by the surveillance system.
Mortality
Preventing deaths is the most important goal for health systems during a pandemic; however, even with systems that function optimally, some deaths occur due to virus characteristics and/or the susceptibility of the individual. A relative excess, when expressed using the percentage of deaths in reported cases, may indicate that clinical treatment services did not function adequately (large numerator) or that the epidemiological surveillance system did not have sufficient coverage (small denominator). Moreover, the quality of the information source must be taken into account, as countries may implement different strategies for diagnosing fatal cases. For example, a country may report all influenza-related deaths or register certain deaths as possible cases – the latter of which would prevent the case from being included in the records analysed in our study. In addition, a country may change its reporting strategy according to the behaviour of the epidemic, which makes it difficult to make comparisons between and within countries.
Algorithm used for evaluation
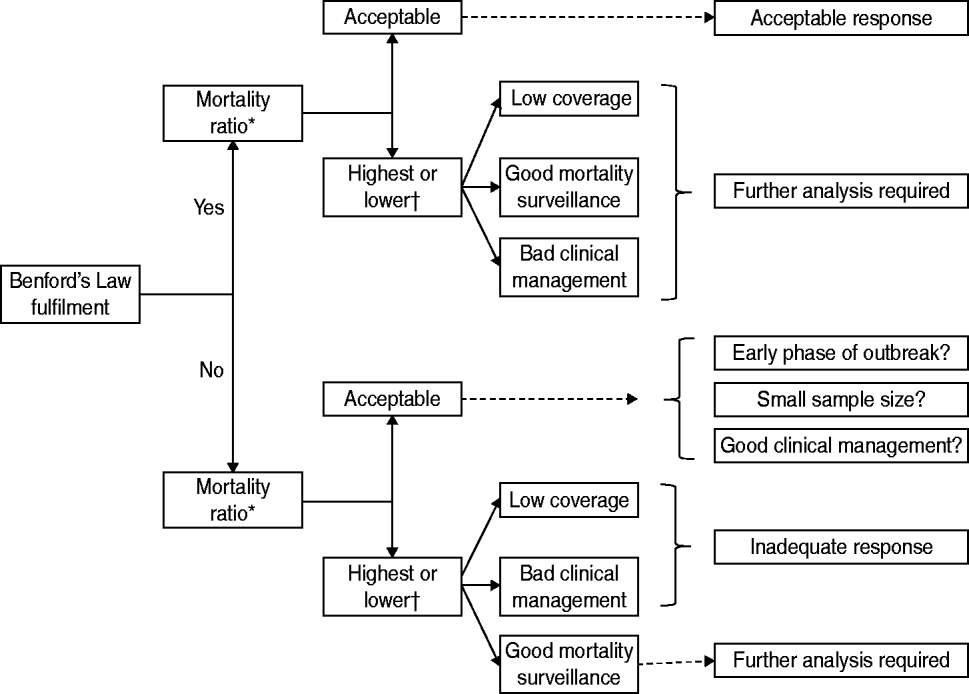
Figure 1 summarizes the proposed algorithm. The first step evaluates the data quality using Benford's Law, and the second step evaluates the mortality ratio (confirmed deaths/confirmed cases). This method generates four possible scenarios. The first scenario is that countries which fulfilled Benford's Law and had a lower mortality than the average mortality of all the countries had an acceptable response. The second scenario is that those countries not fulfilling Benford's Law and whose mortality is greater than the average mortality of all the countries had an inadequate response.

Fig. 1. Proposed algorithm to evaluate the performance of public health surveillance during the influenza A(H1N1) virus pandemic. * In relation to mean mortality in all countries. † Outliers are potential irregular data.
When Benford's Law is fulfilled and there is high mortality, the most plausible explanations are that there was low PHS coverage, poor clinical management of infected individuals, good mortality surveillance, or several simultaneous situations. When Benford's Law is not fulfilled and there is low mortality, possible explanations are that coverage was not adequate, the PAHO reporting process was inadequate, or the country was in an early phase of the epidemic. In the case of the last two scenarios, if it is possible that the PHS system experienced problems, the two indicators cannot be used to identify the problem and complementary studies are necessary.
Statistical methods
First, mortality ratios and their respective 95% confidence intervals (CIs) were estimated. For cases in which the reported mortality was zero, the upper limit of the 95% CI was approximated using Hanley & Lippman-Hand's rule [Reference Hanley and Lippman-Hand16]. Since the data samples were small, Kuiper's test for discrete data [a modified version of the non-parametric Kolmogorov–Smirnov (KS) test] was used to determine if they fulfilled Benford's Law [Reference Kuiper17]. Kuiper's test analysed the data coming from a completely random independent distribution, thus it is suitable for small sample sizes [Reference Stephens18]. In these analyses maximum nine data obtained from national reports were compared with the theoretical data for each digit (Benford distribution). This approach has been used successfully [Reference Tam Cho and Gaines19], specifically in regard to seasonal variations in the incidence of disease [Reference Freedman20]. Additionally, P values obtained with χ2 and log-likelihood ratio tests were reported, as they are widely used to test the fit with Benford distribution, although they are not independent of sample size. In these analyses the sample size depends on the number of epidemiological weeks with positive reports (⩾1 cases). For all three tests, H 0 is that the observed distribution follows that expected by Benford's Law. These analyses were conducted with Stata 11 statistical software (Stata Corporation, USA), using the digdis and circ2sam macros developed by Ben Jann (ETH Zurich), and Nicholas J. Cox (University of Durham), respectively.
RESULTS
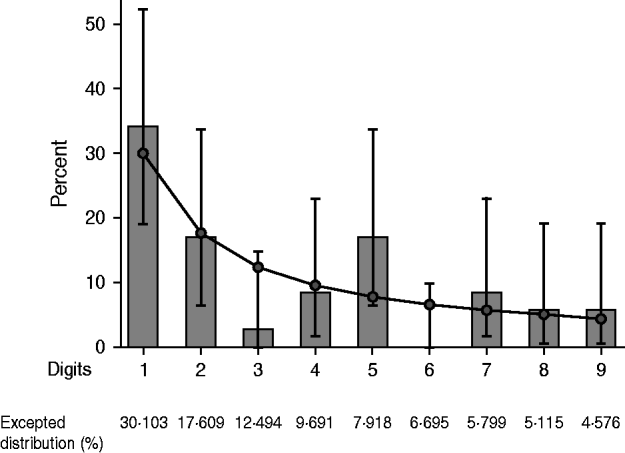
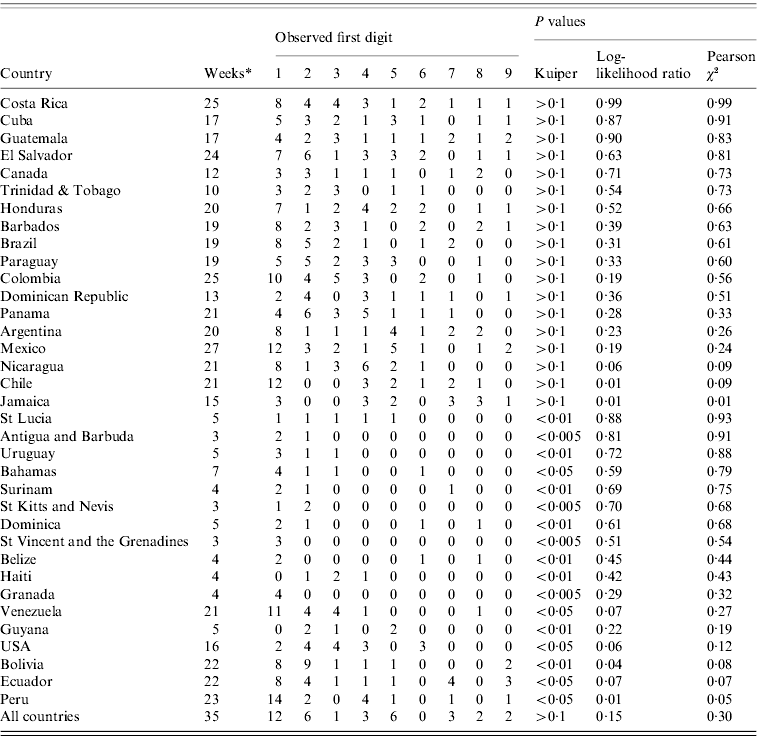
Table 1 shows the results of the quick evaluation of the fulfilment of Benford's Law for each country's PHS system reporting to PAHO. When considering all of the countries, the distribution of the first digits (Fig. 2) followed Benford's Law. The countries that had a distribution similar to the theoretical distribution were Argentina, Barbados, Brazil, Canada, Chile, Colombia, Costa Rica, Cuba, Dominican Republic, El Salvador, Guatemala, Honduras, Jamaica, Mexico, Nicaragua, Panama, Paraguay, and Trinidad & Tobago. When the results obtained with Kuiper's test were compared with the ones obtained with log-likelihood ratio and χ2 tests, different findings were observed for many countries. Therefore, only P values obtained with Kuiper's tests were used during data interpretation. Countries with very small samples and probably type I error in the analysis are identified in Table 2.

Fig. 2. First-digit frequencies for the Benford distribution of weekly reports (number of cases) by all countries in the Americas. (Bars represent the empirical data and markers (with their respective lines) the Benford distribution and confidence intervals.
Table 1. An exploration of the detection and reporting of confirmed cases per week of influenza A(H1N1) using Benford's Law (epidemiological weeks 13–47, 2009)

* Only weeks with positive report (one or more cases) to the Pan American Health Organization.
Table 2. Performance of public health surveillance in American countries during the influenza A(H1N1) epidemic (epidemiological weeks 13–47, 2009)

* Country with small sample size; probably type I error in Kuiper's test.
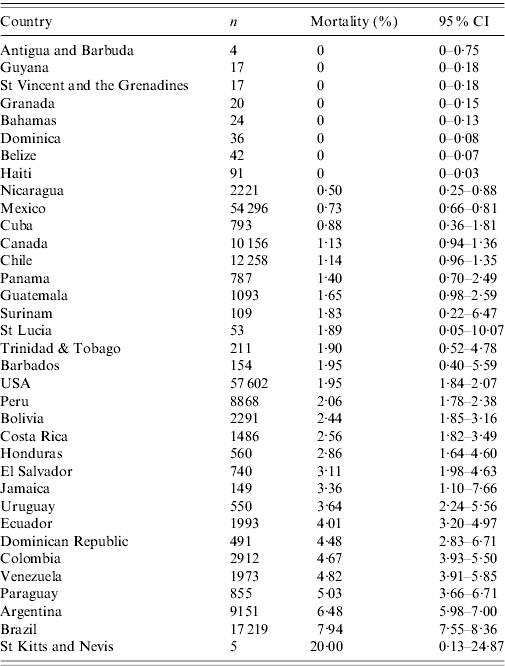
Table 3 shows mortality and the number of confirmed cases reported to PAHO by country up to epidemiological week 42. In general, of the reported cases (n=189 227), only 2·38% (95% CI 2·31–2·44) died as a result of A(H1N1) influenza. Using this cut-off point, the countries can be divided into two large groups: (1) those that report mortality close to the mean; and (2) those that report a higher or lower mortality. The countries with mortality ratios over 3% were St Kitts and Nevis, Brazil, Argentina, Paraguay, Venezuela, Colombia, Dominican Republic, Ecuador, Uruguay, Jamaica, and El Salvador. The countries with low mortality rates (<1%) were Antigua and Barbuda, Guyana, St Vincent and the Grenadines, Granada, Bahamas, Dominica, Belize, Haiti, Nicaragua, Mexico, and Cuba. Table 2 shows the ranking of the countries – those with good performance are located in the top left quadrant, and those with inadequate performance are located in the bottom right quadrant.
Table 3. Confirmed cases of influenza A(H1N1) reported to the Pan American Health Organization, and mortality (epidemiological weeks 13–42, 2009)

DISCUSSION
This study presents the results of a quick test to evaluate the performance of PHS systems in countries in the Americas that submitted reports to PAHO. According to the study Barbados, Canada, Chile, Cuba, Guatemala, Mexico, Nicaragua, Panama, and Trinidad & Tobago had good performance of PHS systems, while poor quality data was reported by Bolivia, Ecuador and Venezuela. St Kitts and Nevis, and Uruguay require special evaluation with other data sources. The other countries fell into intermediate positions, and more research is needed regarding other PHS system characteristics, such as simplicity, flexibility, acceptability, predictive value positive, representativeness, timeliness, and stability.
Although a number of frameworks for the evaluation of public health surveillance have been suggested [Reference German1, 21] there is still a need for the development of objective indicators of the quality of information. In a previous evaluation of influenza surveillance and response capabilities in Latin America, Mensua et al. provided an analysis based on seven dimensions related to administrative preparation for an influenza emergency [Reference Mensua, Mounier-Jack and Coker7]. Mensua et al. identified Bolivia, Ecuador, and Uruguay as weak in terms of the dimension of ‘communication’. Of the countries with adequate reporting performance, the study positively evaluated only Chile and Mexico in terms of the following dimensions: ‘planning and coordination’, ‘surveillance’, ‘public health interventions’, ‘health services response’, ‘communication’, and ‘putting plans in action’ [Reference Mensua, Mounier-Jack and Coker7]. Therefore, the results suggest a differential among the countries in terms of the epidemic's severity. This could mean that administrative evaluations are not necessarily useful for evaluating the actual response of a country. It is noteworthy that the differences in the distribution of the digits in Benford's Law the number of cases, and mortality were partially related to the country's level of economic development. Countries that do not fulfil Benford's Law, especially those with high mortality, have low gross national product; the USA is an exception. Future research is needed to explore this issue.
These results should be carefully interpreted, given the limitations of Benford's Law and the data analysed. A rejection of the null hypothesis in some of the tests does not necessarily indicate that the collection of data was inadequate, and should be understood in terms of a need for more detailed research regarding the way in which the process was conducted. Benford's Law is widely applied in the detection of financial fraud, as numbers that do not comply with the expected first-digit distribution are usually interpreted as an indicator of data forging. However, using this interpretation in the case of influenza would be inappropriate, as deliberate data altering is not the only plausible cause of non-compliance with the distribution. Any situation that results in the reporting and registering of voluntarily or involuntarily fabricated data could have this result. In a survey context, examples of this situation include respondents' tiredness, or selective recall, where people tend to report round numbers. In the case using Benford's Law to evaluate PHS systems, it is possible that epidemiologists underreported cases due to heavy workload.
An issue of special discussion is the effect of sample size on results. In general, studies on Benford distribution have used the χ2 and the log-likelihood ratio tests, but these tests are demanding in terms of sample size. Some articles suggest different alternatives to overcome the problem, e.g. the use of the KS test [Reference Tam Cho and Gaines19, Reference Marchi and Hamilton22], Kuiper's test [Reference Tam Cho and Gaines19, Reference Giles23], a modified KS test for discrete distributions [Reference Conover24], and the use of a measure of fit based on Euclidean distance from Benford distribution in the nine-dimensional space occupied by any first-digit vector [Reference Tam Cho and Gaines19]. The KS and Kuiper's tests can be modified with a correction factor introduced by Stephens 40 years ago, to produce accurate test statistics with small sample sizes [Reference Stephens18]. According to Noether's results, both tests are conservative for testing discrete distributions because they are based on the H 0 of continuous distributions that means the test can be extremely cautious in rejecting the null hypothesis [Reference Noether25]. Thus, although Kuiper's test has good performance with small sample sizes it is difficult to identify a Benford distribution with few data, because it supposes that a natural order of first digits is not identifiable with an excessively short succession of numbers.
Another limitation of this study is data quality. This was most evident in terms of mortality, as data are difficult to compare across and within countries due to the different strategies used to determine this number. To minimize this effect, the algorithm used Benford's Law in the first step and mortality in the second, which gave the first indicator more weight in identifying the countries with better performance. Although this limits the ability of the study to identify a ranking between countries, it is a useful theoretical strategy. In addition, using data within the same country may minimize the variability in the quality of the data. It would also be helpful to have other data that validate the weekly epidemiological reports used is this study; one possible strategy would be to estimate the degree of correlation between data regarding influenza A(H1N1) and acute respiratory infections.
It is clear that an evaluation of the real capacity of a PHS system requires complex analysis that uses various factors that evaluate reporting capability [Reference German1, Reference Buehler3]. However, this study provides a quick, low-cost method to identify general trends which could be used in the future to prospectively evaluate national and subnational PHS systems and make timely decisions to improve surveillance activities for influenza or other diseases. During early outbreaks or when data are sparse we recommend using Kuiper's test for discrete distributions with caution.
ACKNOWLEDGEMENTS
We are grateful to three anonymous referees for their very useful comments on previous versions of the manuscript.


