INTRODUCTION
Noroviruses are an important cause of sporadic cases and outbreaks of acute gastroenteritis worldwide, with more than 20 million cases estimated to occur annually in the United States [Reference Mead1]. Noroviruses are a frequent cause of outbreaks in long-term care (LTC) facilities [Reference Lopman2] and are the most common cause of gastroenteritis outbreaks on cruise ships [Reference Isakbaeva3]. Previous summaries of noroviral outbreak activity in the United States have often been based on food- and waterborne outbreaks that are reported to the Centers for Disease Control and Prevention (CDC), or a subset of outbreaks that were referred to CDC for laboratory diagnostic testing [Reference Blanton4–Reference Fankhauser6]. Results of these studies may be biased towards foodborne outbreaks and may under-represent smaller outbreaks. Since 2000, the Florida Department of Health has conducted its own diagnostic testing for norovirus. As more states perform their own diagnostic testing for norovirus, state and local population-based studies become more feasible, and provide important detail to more accurately characterize the epidemiology of this disease in different regions.
During 2006–2007, widespread increases in acute gastroenteritis outbreaks consistent with norovirus were observed in the United States. Between October and December 2006, several states reported a large increase over the previous year in the number of norovirus outbreaks [7]. Such increases occur periodically in the United States and worldwide and have been associated with the emergence of new norovirus strains within the GII.4 genotype [7–Reference Widdowson, Monroe and Glass9].
In Florida, individual cases of norovirus infection are not reportable, however, under state administrative code outbreaks of any disease in a community, hospital or other institution, or foodborne and waterborne outbreaks are reportable to public health authorities [10]. Reports of outbreaks are usually directed to the local health department for the county in which they occur, but currently, no central surveillance information system is used in Florida on an ongoing basis, to maintain data on all such outbreaks. To characterize norovirus outbreaks in Florida, we conducted a survey of county health departments. Among the objectives of the survey were to characterize outbreaks by place, time, size, setting, duration, and mode of transmission. The survey results provide statewide population-based data on norovirus outbreaks during a 12-month period and can be used to compare noroviral activity in Florida with similar population-based surveillance data from other regions of the country.
METHODS
Florida is composed of 67 counties; each with a county health department (CHD) with epidemiology staff. Following an observed increase in laboratory-confirmed noroviral activity in Florida during early 2007, CHD epidemiology staff were encouraged to maintain a line list of outbreaks of acute gastrointestinal illness reported to them. In July 2007, a survey questionnaire was distributed to all CHDs and epidemiology staff were asked to complete one questionnaire for each outbreak meeting the following definition: acute onset of vomiting or non-bloody diarrhoea in two or more individuals, within 72 h of, and epidemiologically linked to, one another. Epidemiologically linked was defined as individuals who share the same household; live, work, or are schooled in the same facility; or attended the same event in the week before onset of symptoms. CHD staff were asked to report all outbreaks meeting this definition, that were laboratory confirmed for norovirus, or that they suspected of norovirus without another cause identified, for which the initial onset of symptoms occurred between 1 July 2006 and 30 June 2007. CHDs that did not respond to the initial data request were contacted until a response was obtained from all counties.
The questionnaire contained about 30 questions regarding each outbreak. Data were collected on the outbreak setting, and setting categories included a general grouping of LTC facilities consisting of nursing homes and assisted-living facilities; a separate category was used for independent-living facilities. Group events were defined as events occurring outside of a restaurant setting – such as a wedding or birthday party – that involved a defined group of people. A separate category was used for restaurant settings. Further data were collected for each outbreak on the estimated number of people ill and the number at risk for becoming ill, the number of ill persons employed as facility staff, recent cruise travel among the ill, evidence for foodborne transmission, laboratory test results, outbreak onset date, report date, and how the CHD first became aware of the outbreak. Outbreak duration was estimated by the interval between onset of symptoms for the first and last chronological case. A detection interval was computed in days from the date of onset of the first identified case to the date the CHD learned of the outbreak. The proportion of ill persons who were staff members was computed for each outbreak by dividing the number of ill staff members by the total number of persons ill.
To calculate attack rates, CHD staff were asked to estimate the number of people ill and the number at risk for becoming ill, for each outbreak. Estimating the number at risk for facility-based outbreaks generally relied on a list of residents and staff for the portion of the facility affected. For restaurant-based outbreaks, estimating the number at risk was generally more challenging, particularly if a food vehicle was not identified, and may have included only people in the dining party of those who reported illness. An attack rate was computed for each outbreak by dividing the estimated number of people ill by the estimated number of people at risk for becoming ill.
Diagnostic specimens submitted for norovirus testing to the Florida Department of Health, Bureau of Laboratories were tested for norovirus nucleic acid by real-time reverse transcriptase–polymerase chain reaction (RT–PCR) using primer sets broadly reactive in the ORF1–ORF2 region of norovirus GI and GII genogroups [Reference Kageyama11]. Positive results were classified by genogroup and reported back to the CHD. Relevant results for each outbreak were included in the questionnaire data reported by CHDs.
Survey data provided by counties were cross-referenced to data on confirmed and suspected norovirus outbreaks reported to the statewide food- and waterborne disease programme. For identified foodborne outbreaks not reported in the CHD survey, data were abstracted from outbreak reports to the survey questionnaire and were added to the dataset. Data on the number of skilled nursing and assisted-living facilities licensed in each county were obtained from the Florida Agency for Healthcare Administration [12].
Study data were compiled in a database and analysed using SAS JMP software (version 6, SAS Institute, Cary, NC, USA). Tests of significance for continuous variables were performed using the non-parametric Wilcoxon's rank sum test. We used SaTScan software (version 7, www.satscan.org) using the retrospective space–time permutation model to identify spatial–temporal clustering of outbreaks [Reference Kulldorff13, Reference Kulldorff14]. For cluster analyses, the latitude and longitude coordinates of the county centroid were used to geo-reference all outbreaks occurring in a particular county and the outbreak onset date was used for temporal reference. Because the spatial resolution of outbreaks was limited to the county in which they occurred, the spatial cluster size parameter was set to 1 km radius, sufficient to detect only those outbreaks assigned to a county centroid. The temporal parameter for cluster size was set to 14 days. To test the null hypothesis that space–time clusters identified were random, P values were obtained by comparing the scan statistic for observed clusters with those obtained through Monte Carlo simulation of 999 random replications of the data. Statistical tests with P values <0·05 were considered significant. ArcGIS software (version 9, ESRI, Redlands, CA, USA) was used for spatial presentation of data.
RESULTS
During the 1-year study period from July 2006 to June 2007, 257 outbreaks were reported from 39 of Florida's 67 counties (Fig. 1). Of these, 245 outbreaks were reported in the county survey, and 12 were identified from the statewide food- and waterborne disease outbreak reporting system. Outbreaks occurred throughout the study period with onset observed in 47 of the 52 weeks (Fig. 2). Outbreak activity reached a peak in late February and early March with a statewide maximum of 25 outbreaks beginning in a single week. Of 257 outbreaks, 113 (44%) were laboratory confirmed as norovirus and the proportion of outbreaks that were laboratory confirmed remained relatively consistent throughout the study period (Fig. 2). For many unconfirmed outbreaks, appropriate diagnostic specimens for bacterial and viral testing were not available and only one suspected outbreak reported negative laboratory findings for norovirus testing.
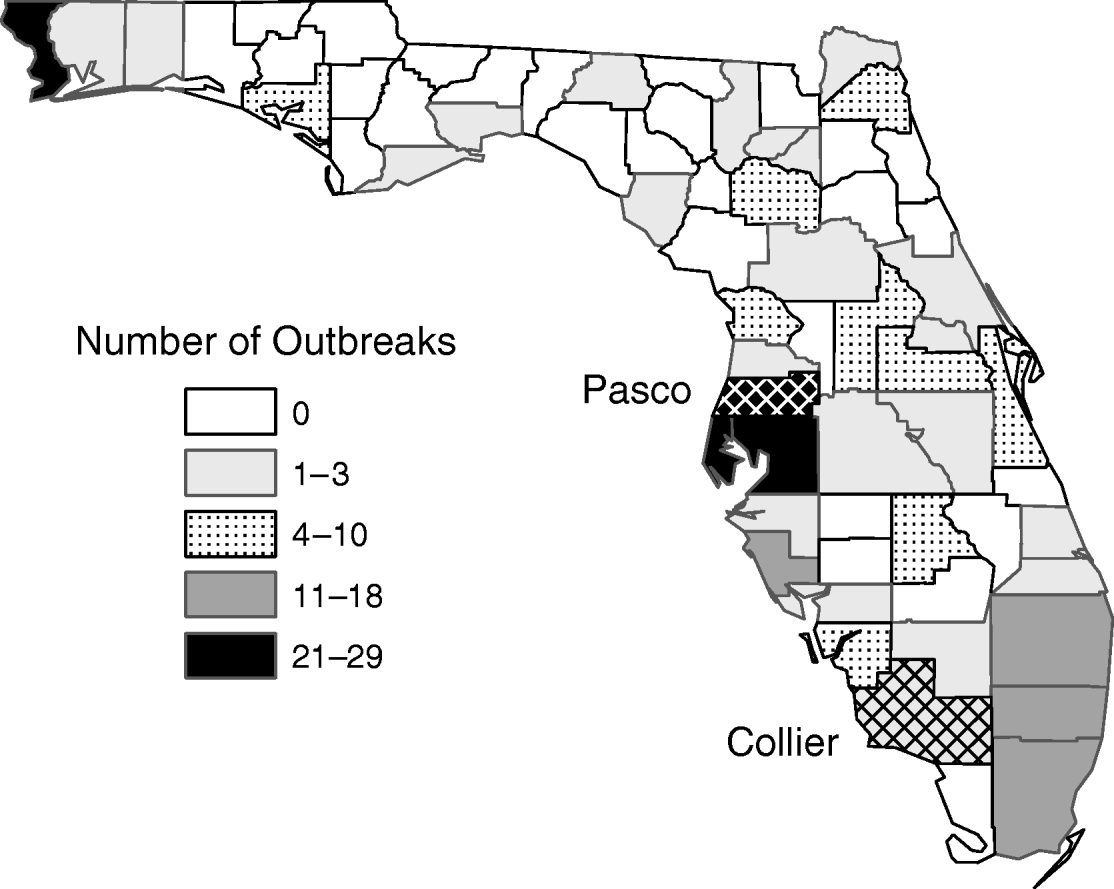
Fig. 1. Number of norovirus outbreaks by county, July 2006–June 2007. Cross-hatching (Pasco and Collier counties) indicates space–time clustering.
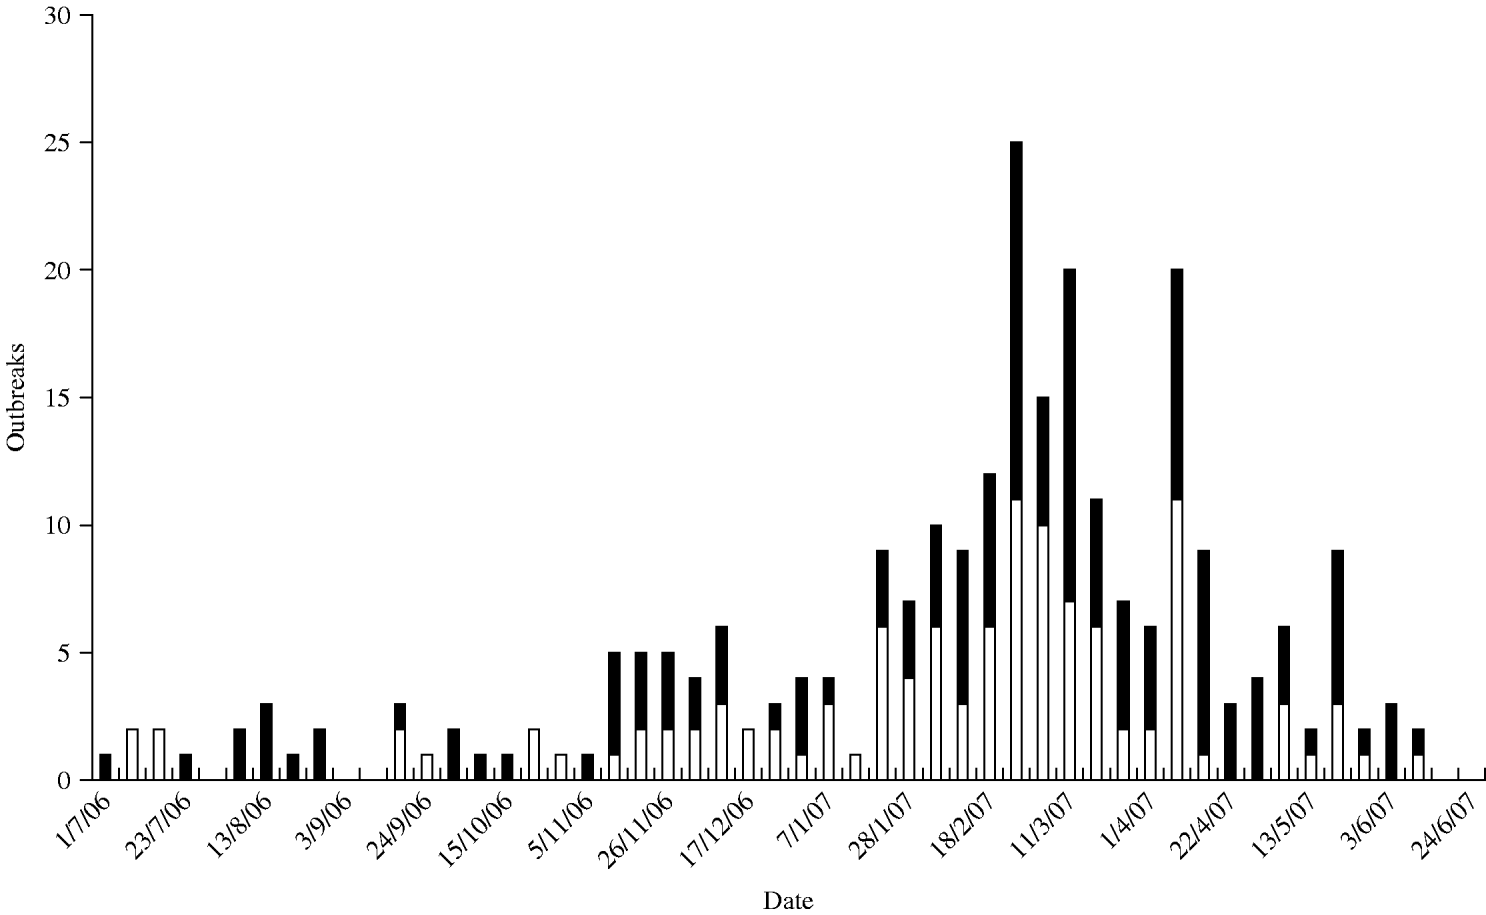
Fig. 2. Epidemiological curve of confirmed (□) and suspected (■) norovirus outbreaks by week.
Clustering analysis identified eight space–time clusters where the observed number of outbreaks exceeded the number expected; the space–time scan statistic was statistically significant for two of these clusters (Table 1). In Pasco County, a cluster of 16 outbreaks occurred within 12 days; in Collier County, a cluster of three outbreaks occurred within 4 days (Fig. 1). Analysis using different parameters for maximum temporal and spatial cluster size did not change these results appreciably.
Table 1. Space–time clusters of norovirus outbreaks within a county, July 2006–June 2007

Norovirus outbreaks were observed in a variety of settings with nearly two-thirds in LTC facilities (Table 2). There are about 3162 skilled nursing and assisted-living facilities licensed in Florida. Thus the 162 outbreaks reported statewide in these facilities represent about 5·1 outbreaks/100 facilities per year, with differences noted by county (Fig. 3). Outbreaks were also reported in childcare centres, schools, hospitals, correctional facilities, independent-living facilities, among restaurant patrons, and in group events outside a restaurant setting. Correctional facilities and hospitals had the highest proportion of outbreaks that were laboratory confirmed, whereas schools, childcare centres, and independent-living facilities had a lower proportion confirmed.
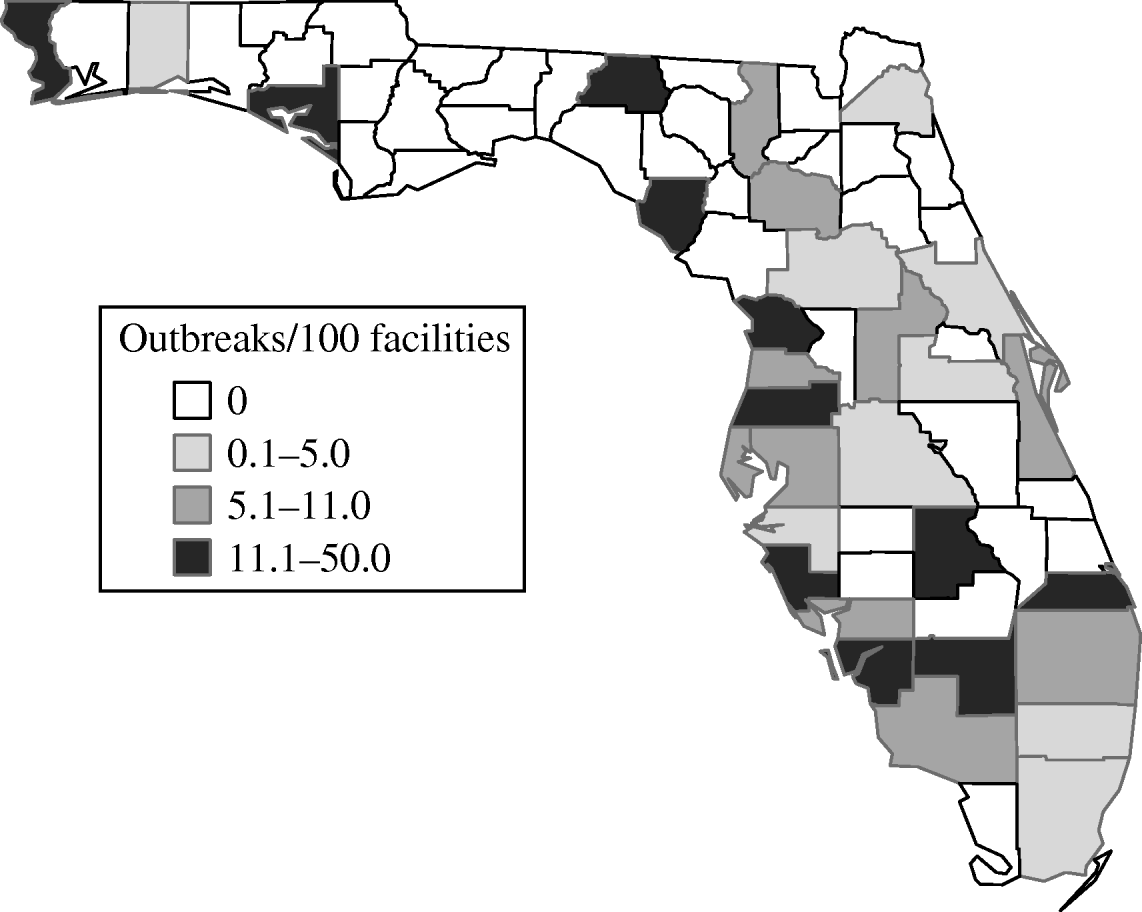
Fig. 3. Norovirus outbreaks in long-term care facilities, adjusted for number of facilities per county.
Table 2. Outbreak characteristics by setting and duration
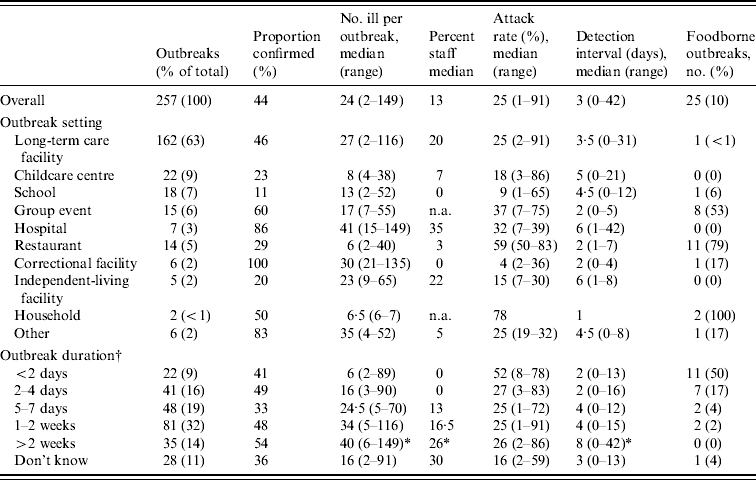
* Wilcoxon rank sum test P<0·01 for outbreaks >2 weeks' duration compared to outbreaks of ⩽2 weeks' duration.
† Number of total and foodborne outbreaks may not add to 257 and 25, respectively, due to missing data.
n.a., Not applicable.
The median number of ill persons per outbreak was 24, with the largest outbreak resulting in 149 ill persons. Overall, an estimated 7880 people were ill in the 257 outbreaks statewide; 301 persons were hospitalized (after excluding 102 persons already hospitalized in hospital-based outbreaks) and 14 persons died. The 14 deaths occurred in 11 hospitals or LTC facilities experiencing norovirus outbreaks; five of the 11 outbreaks were laboratory confirmed for norovirus. Review of death certificates for four people from two confirmed outbreaks revealed that norovirus was not listed on the death certificate and that underlying medical conditions were the primary cause of death.
Many outbreaks involved ill staff members working at the affected facility and the median proportion of ill persons who were staff members was 13% (Table 2). Overall the median attack rate for all outbreaks was 25%, similar to the rate observed in LTC settings. The median time-interval between the initial onset of case symptoms and the date the CHD became aware of the outbreak was 3 days and ranged from 0 to 42 days. The median detection interval was shortest for outbreaks in households, restaurants, group settings, and correctional facilities, and longest for those occurring in hospitals and independent-living facilities. The duration of outbreaks ranged from <2 days to >2 weeks. The 35 outbreaks of >2 weeks' duration were compared to outbreaks lasting ⩽2 weeks. Outbreaks lasting >2 weeks had a significantly greater number of ill persons per outbreak, a significantly greater proportion of facility staff among the ill, and a significantly longer interval between outbreak onset and detection.
Among facility-based outbreaks, CHD staff most commonly learned of the outbreak from the facility itself with more than 75% first reported by the facility. Among outbreaks occurring in restaurants, group events, or households, sick individuals or family members were the most common source to notify CHD staff regarding the outbreak. About 20% of reported norovirus outbreaks occurred in six counties that conduct ongoing, emergency department (ED)-based syndromic surveillance to identify clusters of illness, including acute gastrointestinal illness. Despite the presence of these systems, none of the counties reported first learning of a confirmed or suspected norovirus outbreak through syndromic surveillance.
Twenty-five (10%) of the 257 outbreaks demonstrated some evidence of foodborne transmission. In eight outbreaks, a statistically significant association with a particular food item was identified (Table 3). Foodborne transmission was considered possible in another 16 outbreaks based on the majority of sick individuals consuming the same food item, or evidence from an environmental inspection that supported foodborne transmission. Eleven (79%) of 14 restaurant outbreaks were thought to be foodborne; in two instances a probable food source could not be identified, and in another restaurant outbreak, an ill patron was believed to be the original source of infection. Foodborne transmission was more commonly observed among outbreaks of short duration (Table 2). The median number of ill persons per outbreak was significantly lower, but the attack rate significantly higher for foodborne than for non-foodborne outbreaks (Table 3). The median detection interval was significantly shorter for foodborne outbreaks. Among foodborne outbreaks, the estimated incubation period was most commonly 24–48 h, consistent with previous reports of foodborne transmission of norovirus [Reference Widdowson15].
Table 3. Comparison of foodborne and non-foodborne norovirus outbreaks

* Wilcoxon rank-sum test, P<0·05.
† Percentages may not add to 100 due to missing data.
‡ Numbers do not add to 25 due to missing data.
n.a., Not applicable.
The median number of ill persons per outbreak was greater among confirmed outbreaks compared with suspected outbreaks (Table 4), perhaps due to a greater availability of adequate specimens for testing or greater investigative resources devoted to larger outbreaks. For both confirmed and suspected outbreaks, the proportion of sick individuals with diarrhoea and vomiting was not significantly different, suggesting that unconfirmed outbreaks were clinically similar to confirmed outbreaks. Among the 101 confirmed outbreaks for which laboratory data were available on norovirus genogroup, 93 outbreaks were exclusively associated with the GII genogroup, seven outbreaks were exclusively associated with the GI genogroup, and one outbreak showed laboratory evidence of both GI and GII genogroup infections.
Table 4. Characteristics of laboratory-confirmed and suspected outbreaks
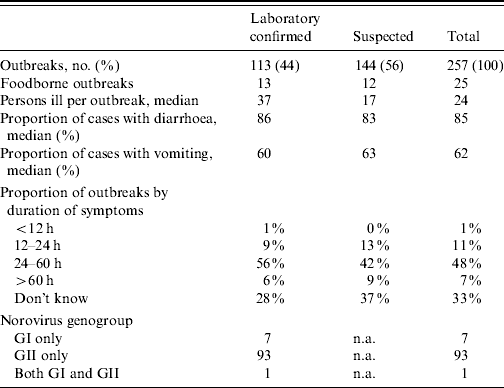
n.a., Not applicable.
DISCUSSION
We report 257 outbreaks of noroviral gastroenteritis occurring in Florida during the 1-year study period; the seasonality observed corresponds roughly to a cold weather peak noted elsewhere [Reference Mounts16]. More than 60% of the outbreaks occurred in LTC facilities, about 10% were considered foodborne, and 44% were laboratory confirmed for norovirus. We noted significant space–time clustering of outbreaks in two counties, the most notable of which consisted of 16 outbreaks with onset over a 12-day period. Investigation of this cluster of outbreaks revealed multiple ill nursing-home staff employed at more than one facility, who routinely worked at different facilities during the same week. Therefore, it is hypothesized that staff movements between facilities may have contributed to the spread of norovirus infection from one facility to another.
Adjusting for population size, the 7880 individual norovirus infections estimated in the survey, among Florida's 2006 estimated population of more than 18 million residents, represents an annual incidence of about 43 cases/100 000 people. This should be regarded as a minimum incidence as the true population incidence of norovirus infection is likely far higher [Reference Widdowson15]. Sporadic cases of norovirus were not reported in our survey and small outbreaks outside of facilities may have gone undetected by the CHD. The 257 outbreaks represent 1·4 outbreaks/100 000 Florida residents and the 162 LTC facility outbreaks represent about 5% of licensed facilities per year.
Norovirus outbreaks occurring on cruise ships with a foreign itinerary were not included in our survey, since they fall under federal regulations and are investigated by federal public health authorities. Nevertheless, between December 2006 and May 2007, at least five cruise ships arriving at a Florida port had confirmed norovirus outbreaks [17]. However, we found no evidence in our survey to support ship-to-shore transmission of norovirus related to these cruise ship outbreaks [Reference Isakbaeva3, Reference Widdowson18]. Only 2/257 outbreaks reportedly involved a person with cruise travel within 1 week of their illness, and neither individual was considered the index case for the outbreak in which they were involved.
Most facility-based outbreaks were reported by the facilities themselves and most foodborne outbreaks were reported by ill persons or their families, highlighting the important role of facility and community participation in effective public health surveillance. Most outbreaks in our survey were reported in ⩽3 days, and contained within 2 weeks. However, 14% of outbreaks lasted >2 weeks. Outbreaks of longer duration had significantly longer reporting delays, suggesting that reporting delays can adversely affect outbreak control efforts. ED-based syndromic surveillance of GI illness symptoms did not contribute to detecting outbreaks and no counties reported first learning of a norovirus outbreak through the use of these systems. This observation is not surprising, given the relative infrequency of hospitalization or ED visits for norovirus gastroenteritis, which is often self-limiting and of short duration.
While noroviral gastroenteritis is usually of limited severity for those in good health, for the frail elderly near the end of their lives, dehydration resulting from diarrhoea and vomiting can hasten their demise. In this respect, norovirus outbreaks may contribute to an increase in all-cause mortality in facilities that care for the elderly, as has been previously reported [Reference Wu19]. Our data indicated that 14 deaths occurred in 11 facilities experiencing norovirus outbreaks. However, norovirus was not identified as the primary cause of death in any cases and, in several instances, underlying medical conditions were the most likely explanation.
There are often substantial costs related to investigating and controlling norovirus outbreaks in facilities. Johnston et al. estimated the cost of a large outbreak in a single hospital at greater than $657 000, which included lost revenue, sick leave, overtime, supplies, and cleaning expenses [Reference Johnston20]. In addition to the cost to facilities themselves, several CHDs reported spending considerable staff time on investigation and control of outbreaks in their county. An informal query of CHD staff suggested that, on average, one staff-day is spent on smaller outbreaks and 4–5 staff days may be spent on larger outbreaks. Using a conservative estimate of two staff-days for each outbreak, the norovirus outbreaks occurring in Florida during the study period required more than 500 staff-days of effort statewide for investigation and control.
Our finding that nearly two-thirds of outbreaks occurred in LTC facilities is consistent with recent findings from other states [7]. Our results showed only 10% of the reported outbreaks statewide were believed to be due to foodborne transmission, which is lower than some previous US reports [Reference Blanton4–Reference Fankhauser6]. However, the results from these previous studies may be somewhat biased by the fact that only food- and waterborne norovirus outbreaks are routinely reported to CDC. Foodborne outbreaks in our survey occurred primarily among restaurant patrons and in catered group events. It should not be assumed, however, that all outbreaks linked to a restaurant are foodborne. One implicated restaurant contained many games and entertainment activities for children and in such a setting, indirect person-to-person transmission via surface contamination could not be ruled out. In another outbreak, transmission may have occurred as a result of viral aerosolization or surface contamination following a vomiting episode by a restaurant patron. Such transmission has been previously described [Reference Marks21].
The attack rates noted in our survey are somewhat lower than have been reported elsewhere [Reference Wu19]. However, the attack rates reported in our survey should be interpreted with caution, as the estimated number of persons at risk used in the denominator was frequently not collected at the time of the outbreak, and was only estimated retrospectively at the time of the survey. Therefore, attack rates in our survey may be more informative when comparing one setting relative to another, rather than as absolute rates. The retrospective nature of the survey is one limitation of our study. This required, in some cases, CHD staff to report details of an outbreak several weeks after the outbreak had occurred. It may also have contributed to underreporting of outbreaks by CHD staff, particularly for smaller, less documented outbreaks occurring near the beginning of the study period. Moreover, variability in surveillance and investigation techniques between CHDs may have resulted in imprecise statewide estimates. Another limitation of the study was the limited spatial resolution of outbreak location collected in the survey, which did not permit more granular analysis of spatial clustering below the county level. In addition, laboratory viral characterization below the genogroup level was not performed. Therefore, we were not able to draw specific links between outbreaks based on norovirus genotype data. Finally, some unconfirmed outbreaks may have been due to other enteric pathogens.
In conclusion, Florida experienced widespread norovirus activity throughout the 2006–2007 season, consistent with similar increases observed throughout the country. In addition to the individual suffering of infected individuals, such outbreaks can represent a significant burden to affected facilities and those responsible for investigating and controlling the outbreaks.
ACKNOWLEDGEMENTS
The authors thank the many people in Florida who made this study possible, including facility staff and affected individuals who reported outbreaks, county health department staff who compiled data on outbreaks in their county, the state regional environmental epidemiologists who assisted in foodborne outbreak investigations, and staff of the Bureau of Laboratories who performed diagnostic testing. This work was partially supported by a grant from the Centers for Disease Control and Prevention entitled ‘Epidemiology and Laboratory Capacity for Infectious Diseases’ (grant no. U50CI423781). The findings and conclusions in this report are those of the authors and do not necessarily represent the official position of the funding agencies.
DECLARATION OF INTEREST
None.


