INTRODUCTION
In 1985, Nanji & French reported a correlation between national pig-meat consumption and mortality from chronic liver disease (CLD) [Reference Nanji and French1], based on data from the mid-1960s and mid-1970s from 16 different developed countries and the 10 Provinces of Canada. These observations have never been replicated, or adequately explained.
The relationship between pig-meat consumption and mortality from CLD is currently of interest because of the increased recognition of autochthonous (locally acquired) hepatitis E infection in developed countries [Reference Dalton2]. Autochthonous hepatitis E is thought to be a zoonotic infection from pigs and has been documented in a number of developed countries including the USA, UK, France, Spain, The Netherlands, Australia and New Zealand [Reference Schlauder3–Reference Dalton10]. Autochthonous hepatitis E appears to be much more common than previously realized and has a predilection for elderly males, in whom it generally causes a self-limiting hepatitis [Reference Dalton4–Reference Mansuy6, Reference Dalton10]. Hepatitis E infection carries an adverse prognosis in patients with CLD in whom the mortality rate is up to 70% [Reference Dalton11–Reference Acharya15]. Hepatitis E virus (HEV) has also recently been shown to cause CLD in the immunosuppressed [Reference Kamar16, Reference Haagsma17].
The objective of the current study was to re-examine and extend Nanji & French's original observations by obtaining more recent data regarding mortality from CLD in a range of developed countries. We aimed to estimate the strength of association between pig-meat consumption and CLD mortality rates, accounting for confounders known to cause cirrhosis, including alcohol consumption and the seroprevalence of chronic hepatitis B virus (HBV) and hepatitis C virus (HCV).
METHODS
Eighteen developed countries were chosen for this study: USA, Canada, UK, Norway, Sweden, Finland, Denmark, Germany, Austria, Czech Republic, Poland, Greece, Italy, France, Spain, Portugal, Australia and New Zealand. The choice of these countries was determined by a number of factors including: the availability of a complete dataset (or as near to complete as possible: Switzerland and Belgium were excluded because of lack of data regarding pig-meat consumption and/or mortality from CLD); a representative sample of European countries (including those from around the Mediterranean basin, eastern, northern and western Europe); and countries where HEV is not endemic.
The study period included the years 2000, 1999, 1998, 1997, 1995, and 1990. This study period was chosen, as after 2000 World Health Organization (WHO) datasets on mortality from CLD are incomplete, precluding meaningful analysis. Prior to 1990 there are no specific data on pig-meat consumption in each country in the United Nations (UN) database.
Data regarding mortality rates from CLD (annual mortality/100 000 population) was obtained from the WHO mortality database, using the ICD-10 codes K70, K73, K74, K76 [18]. The mortality data for males and females was averaged [we could not include sex in the model, as there are no available data on pig-meat consumption in males and females]. Data regarding the per capita recorded adult (aged >15 years) consumption of alcohol (litres/year) was obtained from the WHO global alcohol database [19]. Pig-meat (annual consumption of pig meat 1000 tonnes/year) and beef (annual consumption bovine meat 1000 tonnes/year) consumption data from each country were obtained from the Food and Agriculture Organization of the United Nations (FAOSTAT) database [20]. Data regarding the populations of countries (required to calculate the per capita pig-meat and beef consumption) were obtained from the United Nations Statistics Division – Common Database [Populations total (UN Populations Division Annual estimates and projections) in millions] [21]. The estimated prevalence of chronic infection with HBV (2000) and HCV (1999) were obtained from the WHO [22, 23].
In the 18 countries studied, we estimated the association between alcohol and pig-meat consumption and mortality rates from CLD for each of the following years: 2000, 1999, 1998, 1997, 1995 and 1990. Associations between beef consumption and mortality rates from CLD were estimated for 2000, 1999, 1998 and 1997.
The above datasets were averaged and the mean value for all of the years of study for alcohol, beef and pig-meat consumption was correlated against the mean mortality from CLD. Finally, the estimated prevalence of HBV in 2000 and HCV in 1999 in each country were correlated against the mean mortality data from CLD from the whole dataset (1990–2000).
Univariate and multivariate linear regression analyses were performed separately for each year to determine which of the factors (alcohol consumption, pig-meat consumption, beef consumption, HBV and HCV prevalence) were independently associated with mortality from CLD in the 18 countries under study, using SPSS for Windows 15.0 (SPSS Inc., USA).
The relationship between mortality rates and consumption of pig meat was explored further by fitting multilevel linear regression models to the combined data from all years [Reference Gelman and Hill24]. Such models make it possible to separate between-year and between-country variation in mortality rates and to test stability of the effect of pork consumption on mortality over time. Correlations between country-specific mortality rates in different years were accounted for by fitting models with random intercepts. Random slopes were added to the models to test for country-specific differences in the effect of pork consumption on CLD mortality. All multilevel models were adjusted for alcohol consumption and year, and fitted using the statistical software R (R Foundation for Statistical Computing, Austria).
An assumption made in all analyses was that the mechanism for generating missing data (including exclusion of data for particular years or countries) was ‘missingness completely at random’ (MCaR) [Reference Gelman and Hill24]. This requires the probability of missingness to be the same for all units. Under this assumption, dropping cases with missing data does not introduce bias into model inferences. The parameter estimates are also valid under the more general conditions of ‘missingness at random’, provided the regression models control for all variables that influence the probability of missingness.
RESULTS
Table 1 shows details of the distributions of mortality from CLD and consumption of alcohol, pig meat and beef across the 18 countries for each of the years and on average for all the years studied. Mean mortality from CLD tended to decline over the period (F 1,5=5·56, P=0·032), but median mortality showed an upward trend. The apparent linear decline in alcohol consumption was not significant (F 1,5=1·26, P=0·28). Consumption of pig meat and beef remained relatively stable across the decade.
Table 1. Mortality from chronic liver disease (CLD) and alcohol, pig-meat and beef consumption in 18 developed countries 1990–2000: descriptive data
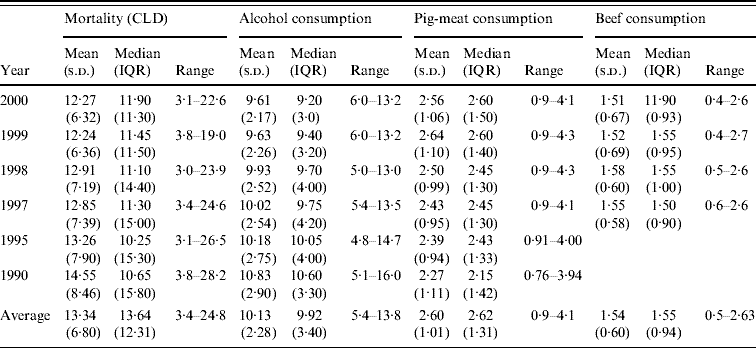
IQR, Interquartile range; s.d., standard deviation.
Data on beef consumption in 1995 and 1990 was not collected.
Table 2 shows results of the univariate regression of mortality rates on alcohol, pig-meat and beef consumption together with the results of multivariate regression for each of the years studied. Alcohol consumption was significantly associated with mortality from CLD in all years tested. The similar values for the slope of the regression line (b) in different years reflected the expected stable relationship between alcohol consumption and mortality from CLD. Although the coefficients were reduced when pig-meat and beef consumption were included in the regression, 1 litre per capita increase in alcohol consumption was always associated with an increase in mortality from CLD in excess of 1·6 deaths/100 000 population.
Table 2. Mortality from chronic liver disease (CLD) 1990–2000. Univariate and multivariate regression of CLD mortality rates with alcohol, pig-meat and beef consumption
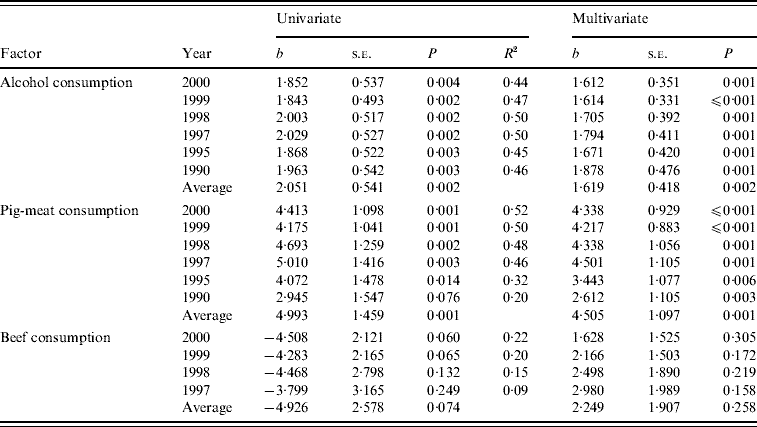
b, Unstandardized coefficient b.
With the exception of 1990, CLD mortality rates were also significantly associated with pig-meat consumption. The relationship between the mortality rates and the consumption of pig meat did not differ significantly between the years (F 5,97=0·426, P=0·830). A 10 kg higher national annual average per capita consumption of pig meat was associated with an increase in mortality from CLD of between 4 and 5 deaths/100 000 population. The association between mortality and consumption of pig meat remained statistically significant and similar in multivariate regression including alcohol and beef consumption (Table 2).
There was no significant association between mortality from CLD and beef consumption. The negative slope of the regression in the univariate regressions is consistent with a hypothesis that beef and pig meat act as substitute goods and beef consumption is not associated with mortality from CLD. The suggestion was further borne out by the significant negative correlation of beef and pig-meat consumption (R=−0·610, P<0·001).
Given the consistent pattern of associations described in Table 1, Figures 1–3 summarize the bivariate relationships combining all the years analysed and showing average CLD mortality rates by average consumption for each of the countries included in the study. A notable feature of Figures 1–3 is that Italy has a consistently higher mortality rate for CLD than would be predicted on the basis of any of the consumption rates studied.
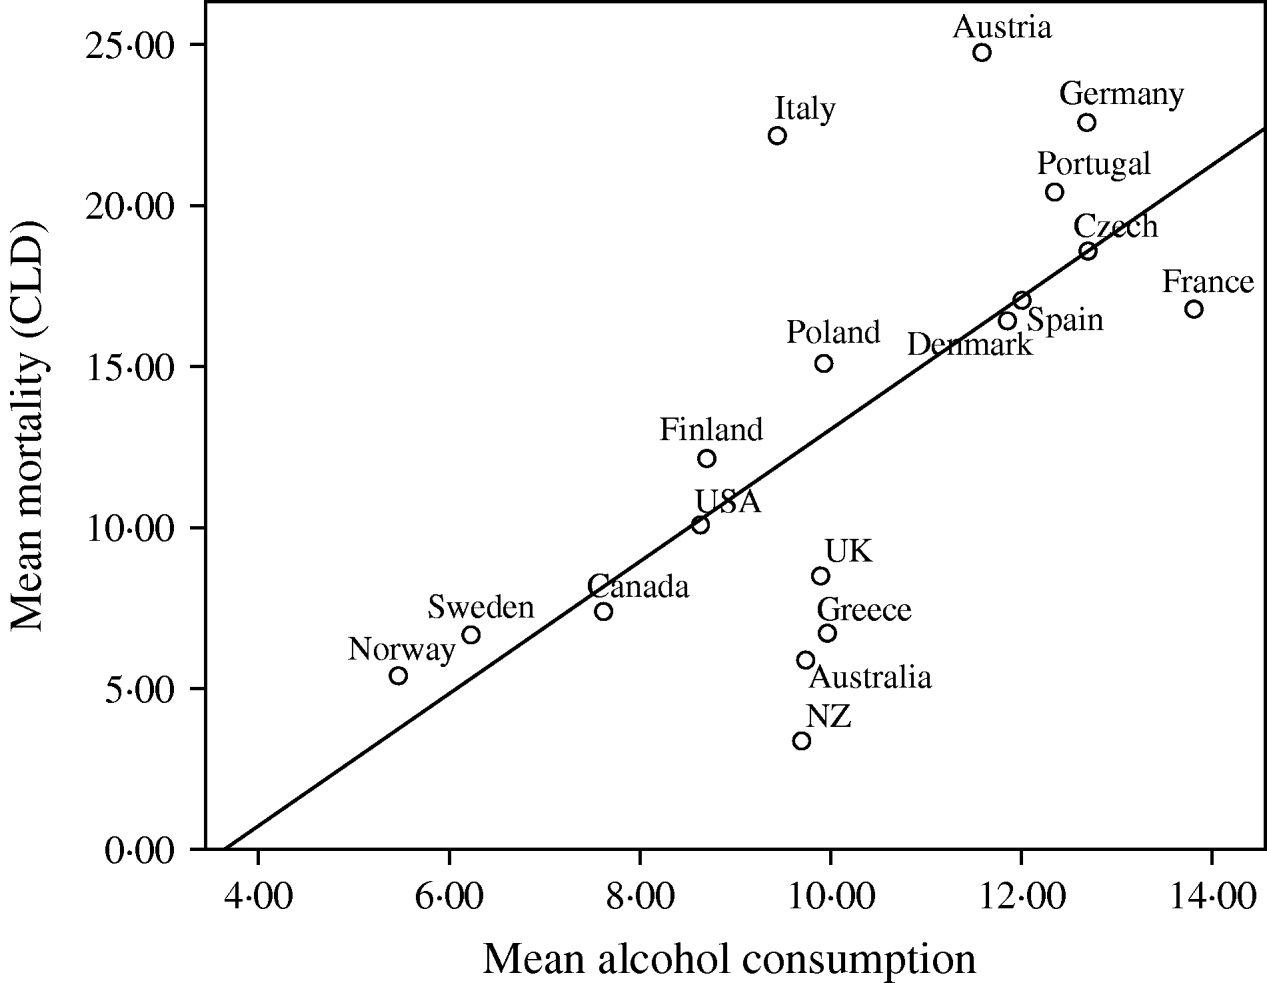
Fig. 1. Univariate regression analysis of the mean mortality from chronic liver disease (CLD)/100 000 population for the years 1990, 1995, 1997, 1998, 1999 and 2000, compared to the mean alcohol consumption (litres/head of population) in 18 developed countries. The values for different years have been averaged before fitting the regression models (R 2=0·473, b=2·051, t=3·792, P=0·002).
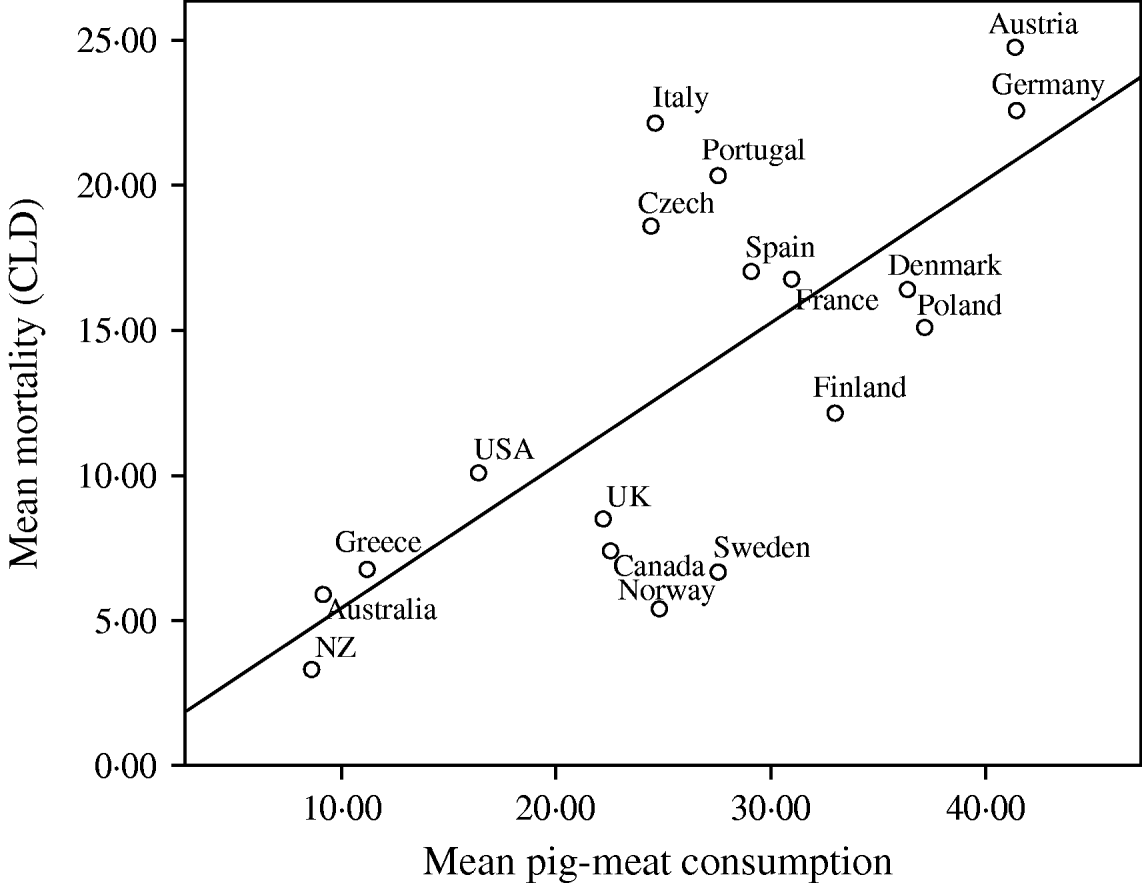
Fig. 2. Univariate regression analysis of the mean mortality from chronic liver disease (CLD)/100 000 population for the years 1990, 1995, 1997, 1998, 1999 and 2000, compared to the mean pig meat consumption (kg/head of population) in 18 developed countries. The values for different years have been averaged before fitting the regression models (R 2=0·531, b=4·933, t=4·255, P=0·001).
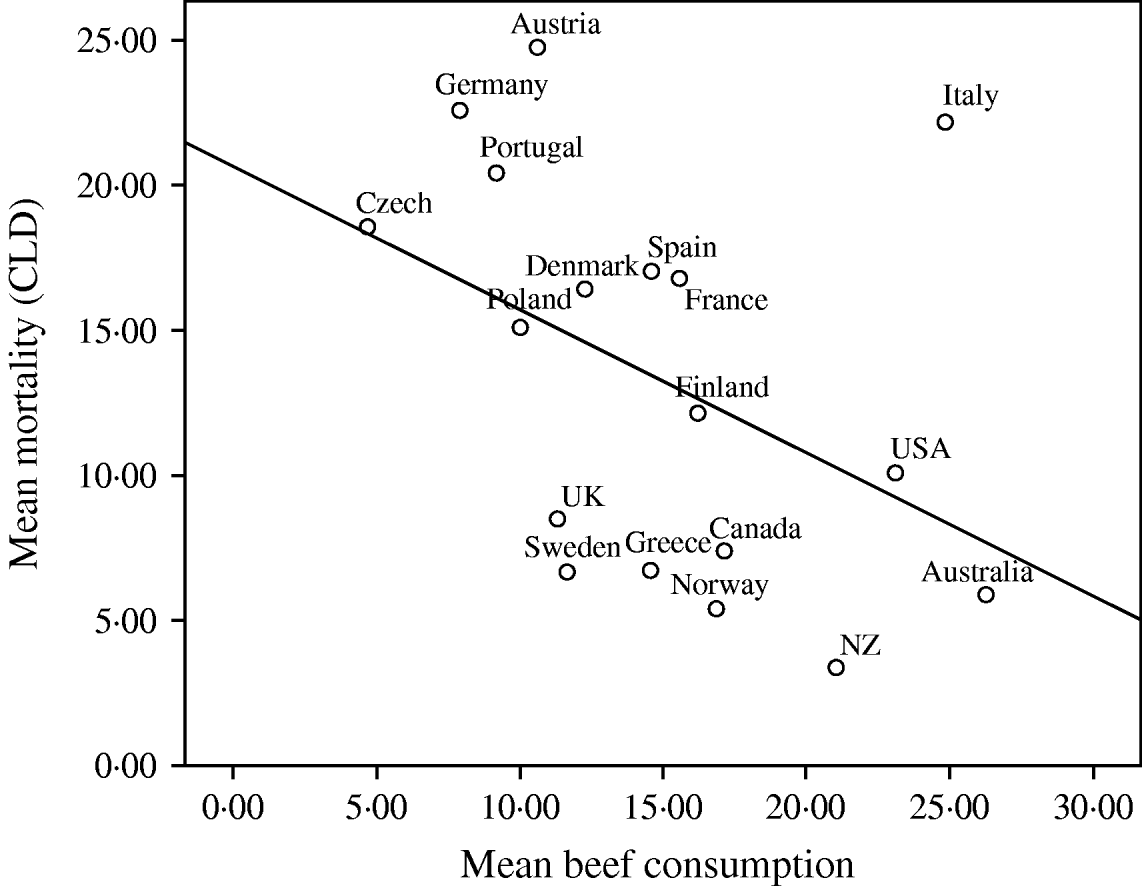
Fig. 3. Univariate regression analysis of the mean mortality from chronic liver disease(CLD)/100 000 population for the years 1997, 1998, 1999 and 2000, compared to the mean beef consumption (kg/head of population) in 18 developed countries. The values for different years have been averaged before fitting the regression models (R 2=0·186, b=−4·926, t=−1·911, P=0·074).
Further analysis was conducted for the years 2000/1999 when prevalence estimates for HBV and HCV were available. In univariate regression analysis neither the prevalence of HBV (t=1·029, P=0·319) nor the prevalence of HCV (t=−0·51, P=0·96) were associated with CLD mortality rates. However, multivariate regression analysis showed that alcohol consumption (t=3·403, P=0·005), pig-meat consumption (t=4·691, P=<0·001) and HBV seroprevalence (t=2·317, P=0·037) were all independently associated with mortality rates from CLD. The inclusion of HBV seroprevalence in the model explained significantly more of the variance than fitting the model with alcohol and pig-meat consumption alone (F change1,14=5·07, P=0·041).
Table 3 shows the multilevel regression model of CLD mortality rates fitted to the combined data for all years with (centred) alcohol and pig-meat consumption as level-1 explanatory variables. Overall differences in mortality rates by country were accounted for by the inclusion of random intercepts. Average pig-meat consumption for each country was included in the model to assess the proportion of country variation in CLD mortality (level-2 variance) explained by consumption of pig meat. The variation in CLD mortality rates between countries is reflected in the width of the estimated interval within which 95% of country-specific intercepts are expected to lie: 6·7–20·8 deaths/100 000 population. The intra-class correlation (ICC) of 91% indicates that almost all of the variation in mortality is related to country-specific factors rather than temporal effects. Inclusion of mean pig-meat consumption per country in this model explained 4% of the overall variation in mortality rates attributable to country (ICC reduced from 95% to 91%). A 10 kg higher national annual average per capita consumption of pig meat was associated with an increase in mortality from CLD of 3·7 deaths/100 000 population. However, after adjustment for a country's average annual pig-meat consumption, within-country increases in consumption of pork meat were associated with a reduction in mortality (P=0·004). Allowing the slope of the relationship between mortality and pig-meat consumption to vary by country led to a further improvement in the model fit (P<0·001; random intercepts variance, 13·0; random slopes variance, 19·1, residual variance, 0·9). The effect of pig-meat consumption did not vary by year (interaction between year and pig-meat consumption: P=0·97). Further details of the multilevel regression models are given in the Appendix.
Table 3. Mortality from chronic liver disease (CLD) 1990–2000: multilevel regression model of CLD mortality rates
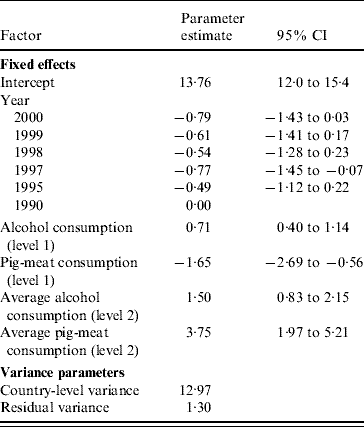
CI, Confidence interval.
DISCUSSION
The data presented in this paper confirm and extend Nanji & French's observations that there is a relationship between pig-meat consumption and mortality from CLD [Reference Nanji and French1]. Our data show that both national-level pig-meat consumption and alcohol consumption are independent predictors of national mortality rates from CLD. The observation that pig-meat consumption correlates with mortality from CLD could have a number of explanations.
The relationship between pig-meat consumption and mortality from CLD described in the current paper is not necessarily causal. Pig-meat consumption could be a surrogate marker for another unidentified factor that causes an increased mortality. However, the strength of correlation between pig-meat consumption and mortality from CLD, the durability of this relationship across culturally diverse communities in developed countries and over time all argue against an epiphenomenological explanation. It is noteworthy that the relationship between pig-meat consumption and mortality from CLD described in the current paper, based on data from 1990 to 2000, is very similar to that described by Nanji & French [Reference Nanji and French1], based on data from the 1960s and 1970s.
In order to improve the robustness of the model, we would have liked to have included an analysis of pig-meat and alcohol consumption and mortality from CLD within individual countries, in addition to the data reported between countries. Lack of data precluded such an analysis. However, Nanji & French found that the mortality from CLD varied considerably within Canada, and that the relationship between pig-meat consumption and mortality from CLD held true within the 10 Canadian provinces [Reference Nanji and French1]. We would also have liked to include in the model countries such as Israel and some Gulf states where, for religious or cultural reasons, pig-meat consumption is low or absent. Again, lack of data concerning pig-meat and/or alcohol consumption precluded such an analysis. However, mortality rates from CLD in such settings (where available) are uniformly low or very low (WHO data, not shown). It is impossible to draw any conclusions from such CLD mortality data as, although pig-meat consumption is likely to be low in such countries, so is alcohol consumption.
Another possible explanation for our findings is that one or more factors present in pig meat could cause an increased incidence of cirrhosis. Interest in this regard has centred on the fat content of the diet in general, and pig meat in particular [Reference Mezey25–Reference Lieber29].
Finally, one or more factors in pig meat could cause an increased mortality in patients with pre-existing cirrhosis from another cause. The most likely candidate is genotype-3 HEV, which is found in pig herds throughout the developed world [Reference Banks30–Reference Garkavenko32]. Viable and infectious genotype-3 HEV has been isolated from retail pig meat in the USA [Reference Feagins33], and can survive cooking temperatures up to 56°C [Reference Emerson, Arankalle and Purcell34]. Genotype-3 HEV has been shown to be the cause of autochthonous hepatitis E in a number of developed countries [Reference Schlauder3–Reference Dalton10] where it is considered an emerging infection [Reference Dalton2]. Locally acquired hepatitis E may be much more common in developed countries than previously realized [Reference Dalton2], as HEV IgG seroprevalence rates in blood donors of up to 21% have been reported in the USA [Reference Meng35, Reference Thomas36] and 16% in the UK [Reference Dalton37]. HEV IgG seroprevalence increases with age and is over 40% in males aged >80 years in southwest England [Reference Dalton37]. Autochthonous hepatitis E seems to have a predilection for middle-aged and elderly males in whom it generally causes a self-limiting hepatitis [Reference Schlauder3–Reference Dalton10]. However, recently it has been shown that the prognosis is poor in patients with existing CLD, with mortality rates of about 70% [Reference Dalton11–Reference Acharya15]. Thus, previously unrecognized infection with genotype-3 HEV could explain, at least in part, the relationship between pig-meat consumption and mortality from CLD.
Hepatitis E infection has hitherto been considered to only cause acute hepatitis, and chronic infection was thought not to occur. However, recent data have shown that autochthonous genotype 3 hepatitis E infection can cause CLD [Reference Kamar16, Reference Haagsma17]. Immunosuppressed transplant recipients in France and The Netherlands with hepatitis E infection have been shown to develop progressive CLD. It is not certain how frequently HEV can cause CLD in the immunocompromised, or in other groups with more subtle defects in humoral and cellular immunity. This area merits further study in light of the relationship that we have demonstrated in the current paper between pig-meat consumption and mortality from CLD, as autochthonous hepatitis E infection in developed countries is thought to be a porcine zoonosis and one possible method of infection is by eating HEV-contaminated pig meat [Reference Dalton2].
The influence of chronic hepatitis B and C infection on the alcohol/pig-meat model deserves some comment. It is not surprising, given the strength of the association between alcohol and pig-meat consumption and mortality from CLD described in the current paper, that on univariate regression analysis neither HBV nor HCV prevalence were associated with CLD mortality. It is likely that any relationship between HBV and HCV and mortality was simply masked by the strength of the relationship with alcohol and pig-meat consumption. However, on multivariate analysis HBV prevalence, in addition to alcohol and pig-meat consumption, was independently associated with an increased mortality from CLD. This finding gives the pig-meat consumption model some ‘face-validity’, as it indicates that this model fits within current pathophysiological concepts.
The reason why HCV prevalence was not associated with mortality from CLD on multivariate regression analysis remains uncertain. It could relate to the accuracy of the WHO HCV prevalence data which, by the WHO's admission, did ‘not necessarily represent the true prevalence’ in the countries reported in the current study [21]. Moreover, the influence of HCV on mortality from liver disease is possibly not as stable/long standing as the other factors – for example the UK HCV epidemic did not really take off until the late 1980s – and the lag period before impacting on mortality may not have been long enough to be detected.
The current study represents an ecological regression analysis and, in common with all such studies, has a number of inherent weaknesses. The most important weakness is that ecological regression analysis is prone to the ‘ecological fallacy’ phenomenon [Reference Wakefield38]. This occurs when aggregating individual data on national scales, which can sometimes introduce bias when associations are then examined via regression of the aggregated data. The data presented in the current paper should be interpreted with this in mind.
An important component of our analyses was the use of multilevel regression models to exploit the hierarchical nature of the yearly mortality data. This made it possible to account for clustering by country, and to examine both within-country and between-country effects of pig-meat consumption on mortality. The fitted multilevel models provided evidence for a strong positive association between average pig-meat consumption (per country) and mortality, but a negative within-country relationship. (We note that there was considerable heterogeneity in the random coefficients for the within-country effect of pig-meat consumption: 95% of countries are expected to have a random slope within the range −9·9 to 7·3.) This apparent difference between the effects of pig-meat consumption at the two different levels of the model, a finding not evident from the single-level regression analysis, has several potential explanations.
One possibility is that a lag between pig-meat consumption and its effects on liver mortality may distort the within-country association (estimated from concurrent consumption and mortality data). Alternatively, consistent with the ecological fallacy, our findings could be influenced by country-level confounding, with unmeasured country-level covariates responsible for introducing bias into the estimates of between-country relationships. Sensitivity of the chosen model to measurement error in the consumption data, choice of geographical areas and sources of missing data could also play a contributory role in obscuring causal effects.
Another possible confounding factor in the current study is the reliability of the death certificate records. Mortality statistics derived from death certificates are notoriously incomplete and frequently inaccurate, and their reliability may significantly differ between countries. The data presented in the current study need to be considered with this in mind. However, the very clear and expected relationship that we have shown between alcohol consumption and death from CLD in the countries under study would argue against the pig-meat consumption model being simply a statistical ‘quirk’ due to inaccurate death certification.
In conclusion, we have shown that alcohol and pig-meat consumption are independently associated with mortality rates from CLD in 18 developed countries over the period 1990–2000. The reason for this association is uncertain. Whilst this association does not necessarily imply causation, it is plausible that acute or chronic infection with HEV might explain some of this relationship, since it is related both to pig-meat consumption and death from liver disease. Individual-level data is needed to confirm this relationship.
APPENDIX
Multilevel regression models of CLD mortality rates
Random intercepts model
The fitted random intercepts model can be expressed using a two-stage formulation as follows:
where countries (level-2 units) are indexed by j=1, …, 18, years (level-1 units) are indexed by i=1, …, 6 (corresponding to 1990, 1995, 1997, 1998, 1999 and 2000 respectively), y ij is the liver disease mortality rate for country j in year i, η0j are country-specific intercepts, x 1i, …, x 5i are binary indicators for year (with x ki=1 if i=k+1 and 0 otherwise, for k=1, …, 5), x 6ij is the alcohol consumption for country j in year i, x 7ij is the pig-meat consumption for country j in year i, ![]() 6•j and
6•j and ![]() 7•j are country j means of x 6ij and x 7ij respectively, and εij are level-1 residual terms.
7•j are country j means of x 6ij and x 7ij respectively, and εij are level-1 residual terms.
The fitted level-2 model for between-country variability in the intercept was given by:
where ![]() 6•• and
6•• and ![]() 7•• are the overall mean alcohol consumption and mean pig-meat consumption respectively, and ς0j are country-specific residuals. The variance parameters were estimated as var(ς0j)=12·97 and var(εij)=1·30.
7•• are the overall mean alcohol consumption and mean pig-meat consumption respectively, and ς0j are country-specific residuals. The variance parameters were estimated as var(ς0j)=12·97 and var(εij)=1·30.
The model was formulated to separate out between- and within-country effects of pig-meat consumption by including the mean pig-meat consumption for each country (![]() 7•j) as a covariate (between-country effect), in addition to the (country mean) centred covariate for pig-meat consumption in each year (x 7ij−
7•j) as a covariate (between-country effect), in addition to the (country mean) centred covariate for pig-meat consumption in each year (x 7ij−![]() 7•j) (within-country effect). A similar approach was adopted to model the effects of alcohol consumption. Equality of within- and between-country effects of the covariates was tested by including country-level means for pig-meat and alcohol consumption in a model with the uncentred level-1 covariates [Reference Skrondal and Rabe-Hesketh39]. The within- and between-country effects were significantly different at the 5% level for pig-meat consumption but not alcohol consumption (Wald test P<0·001 and P=0·08 respectively).
7•j) (within-country effect). A similar approach was adopted to model the effects of alcohol consumption. Equality of within- and between-country effects of the covariates was tested by including country-level means for pig-meat and alcohol consumption in a model with the uncentred level-1 covariates [Reference Skrondal and Rabe-Hesketh39]. The within- and between-country effects were significantly different at the 5% level for pig-meat consumption but not alcohol consumption (Wald test P<0·001 and P=0·08 respectively).
The random intercepts model was extended by including the available prevalence estimates for HBV and HCV (from the years 2000/1999) as country-level covariates (at level 2). The prevalence of HBV (P=0·03) was associated with CLD mortality rates, but no association was found with prevalence of HCV (P=0·4). In addition, neither between- nor within-country effects of beef consumption were statistically significant when added to the model (P=0·1 and 0·2, respectively). The estimated effect of pig-meat consumption on liver mortality remained statistically significant when these level-1 and level-2 covariates were included in the model.
Random coefficient model
The assumption of parallel country-specific regression lines for the effect of pig-meat consumption on liver mortality was relaxed by introducing random country-specific slopes. The fitted random coefficient model can be expressed using a two-stage formulation as follows:
where the η1j are country-specific slopes and all other variables are as defined above.
The fitted level-2 models have η0j and η1j as responses:
where ς0j and ς1j are country-specific residuals. The variance parameters were estimated as var(ς0j)=12·95, var(ς1j)=19·14, corr(ζ0j, ζ1j)=–0·65 and var(εij)=0·87.
ACKNOWLEDGEMENTS
We thank Professor Mary Ramsay, Health Protection Agency, London, UK, for her helpful comments; Jeff Fellows for providing thoughtful discussion; and Sharon Northey for help with the statistics. H.R.D. is in receipt of a project grant from the Duchy Healthcare Charity, Truro, Cornwall, UK.
DECLARATION OF INTEREST
None.


