INTRODUCTION
In early April 2009, a new pandemic influenza A(H1N1) virus (hereafter called pandemic H1N1) emerged unexpectedly in the USA and Mexico and rapidly swept through other countries around the world [1–Reference Lau5]. On 11 June, the WHO raised the pandemic alert to the highest phase of six [6], indicating that human-to-human transmission of the virus had been confirmed in at least three countries in two of six WHO regions. The first reported case of pandemic H1N1 in China was a student returning from the USA [Reference Bin7] which was confirmed on 10 May, followed by a large number of imported cases who had travelled to countries where infection had been reported. Since the appearance of pandemic H1N1 virus, influenza surveillance around the world has been intensified to provide updates on the pandemic situation and facilitate informed decision-making regarding control measures.
It is well-known that influenza circulation is associated with variation of temperature or weather. In temperate climates, clear seasonality of influenza activity is documented with typical winter peaks [Reference Serfling8–Reference Simonsen10]. However, in subtropical or tropical regions, the seasonal variation of influenza is not well-defined and non-stationary, with relatively high prevalence throughout the year with unpredictable peaks [Reference Viboud, Alonso and Simonsen11, Reference Shek and Lee12]. A study in Hong Kong [Reference Yang13] examined the seasonality of influenza and found that annual cycles and semi-annual cycles occurred at irregular intervals. Moreover, there appears to be a difference in epidemiology between seasonal and pandemic influenza [Reference Mathews14]. In contrast to seasonal influenza, pandemic influenza was characterized by out-of-season onset, multiple waves, and high attack and mortality rates, mostly due to the introduction of novel influenza virus. Even less is known about what impact the novel influenza virus will have on current seasonal influenza activity, and how seasonal influenza and pandemic influenza might co-circulate. The influenza surveillance system is capable of providing an insight into these questions by monitoring influenza activity continually.
Shenzhen is situated in southern China at 22° 27′–22° 52′ N and 113° 46′–114° 37′ E, immediately north of Hong Kong, and has a typical subtropical climate. In 2007 Shenzhen's estimated overall population exceeded 14 million people. Shenzhen has a total area of 1952·84 km2 and is a relatively new city which developed rapidly after becoming China's first Special Economic Zone in 1980. Since then, a great influx of workers and migrants from all over China has made Shenzhen the largest migratory metropolitan city of China with a large floating population. A comprehensive influenza surveillance has been in place for several years, and results show that influenza activity locally often demonstrates annual cycles with clear summer peaks [Reference Lu15]. Generally, influenza activity begins in the spring, reaches its peak in summer, and falls to baseline levels at the beginning of autumn. Although the peak in influenza activity seemed to be slightly delayed compared to previous years, seasonality was still evident. The first two cases of pandemic H1N1 in Shenzhen were identified on 28 May by the screening system at ports of entry in travellers returning from the USA. Intensive containment measures were implemented to prevent community transmission of the new virus. At the same time, enhanced influenza surveillance was implemented to detect community transmission by the increased testing of patients with influenza-like illness (ILI) seeking medical treatment. On 7 August the first community-acquired case of pandemic H1N1 was identified in a local hospital through influenza surveillance. In this paper, we report the results of influenza surveillance in Shenzhen in 2009 and use these results to determine whether winter peaks of influenza might appear as a result of pandemic H1N1 influenza, and whether its mode of circulation is significantly altered by pandemic H1N1 influenza.
METHODS
In late l980s, a sentinel surveillance programme for influenza was launched by Shenzhen Center for Disease Control and Prevention (Shenzhen CDC). Initially, this involved two hospitals. In the mid-1990s, Shenzhen joined the global influenza surveillance network as the only collaborative laboratory besides the Chinese Center for Disease Control and Prevention (Chinese CDC) in China. In 2005, Shenzhen's influenza surveillance network was established by Shenzhen CDC and coordinated by Shenzhen's Ministry of Health. With an increasing number of members over the years, Shenzhen's influenza surveillance network now includes eight laboratories, nine hospitals, seven community health centres, three schools and four poultry farms.
Shenzhen's influenza surveillance system consists of ILI surveillance, laboratory surveillance and outbreak surveillance. ILI surveillance is conducted in outpatient and emergency departments of internal medicine and paediatric wards of nine hospitals and in seven health centres. ILI is defined as symptoms of fever ⩾38°C, either a cough or sore throat, and no other laboratory-confirmed diagnosis. This is similar to the definition adopted by CDC USA [16]. Using this definition, physicians in outpatient and emergency departments are required to diagnose ILI cases and categorize them by age group (0–4, 5–14, 15–24, 25–59, ⩾60 years). The number of ILI cases by age group and total number of consultations in the above departments are recorded and collected daily by designated hospital staff. The ILI rate is defined as the number of ILI cases out of the total number of consultations, expressed as a percentage. A report on the number of ILI cases and total number of consultations is sent to Shenzhen CDC on a weekly basis.
Laboratory surveillance is performed at the same time. Respiratory specimens including nasal and throat swabs are taken from patients consulting with ILI within 3 days of onset of clinical symptoms by the attending physician or nurse. Patients who have received antiviral drugs prior to consultation are not sampled. Demographic information is collected using a simple questionnaire during the consultation. The specimens and completed questionnaires are collected from nine hospitals by district CDC staff each week. Specimens are transported to the corresponding laboratory in a suitable transport medium at ⩽4°C within 48 h of collection. Influenza virus isolation in both cell culture and embryonated chicken eggs and subsequent identification are performed in eight collaborating CDC laboratories. The number of specimens tested and percent positive for each subtype are reported to Shenzhen CDC each week.
In order to monitor the influenza epidemic, an outbreak reporting system was established. Physicians from schools and hospitals are responsible for informing district CDCs of any unusual clustering of ILI cases. Upon notification, district CDC staff immediately visit the affected location, verify the diagnostic information and collected samples if available. As per guidelines from the Chinese CDC, an influenza outbreak is defined as ⩾5 ILI cases in one grade or class within a period of a week. ILI case numbers and incidence rates for each outbreak, together with reverse transcriptase–polymerase chain reaction (RT–PCR) test results, are notified to Shenzhen CDC each week.
When addressing the age distribution of ILI counts, we compared the age-specific ILI counts before the pandemic with those following the pandemic. The start of the pandemic was defined as 7 August 2009, when the first community transmission was confirmed.
RESULTS
ILI Surveillance
In 2009 the Shenzhen influenza surveillance system reported 221 552 cases of ILI in 3 137 273 consultations, representing an average ILI rate of 71 cases/1000 consultations. As Table 1 shows, the ILI rate in 2009 was greater than in the past 3 years (the rates were 63, 67 and 59 cases/1000 consultations for 2006, 2007 and 2008, respectively). The highest weekly ILI rate during 2009 was 113·8 cases/1000 consultations in week 47 (Fig. 1), and the ILI count peaked (10 785 cases) in the same week. The highest weekly ILI rate and count were 1·6× and 2·5× higher than the average ILI rate (71/1000) and count (4261 cases) per week, respectively.
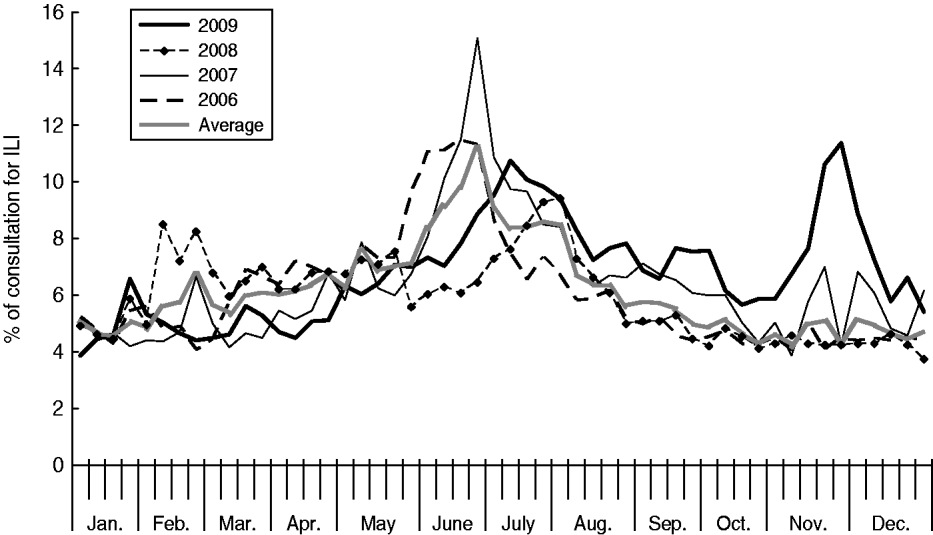
Fig. 1. Percentage of weekly consultations for influenza-like illness (ILI) in Shenzhen, 2006–2009.
Table 1. Comparison of influenza-like illness (ILI), laboratory and outbreak surveillance data, 2006–2009

Until June, the ILI rate increased slowly and remained slightly below the average level of the previous 3 years. At the beginning of July, the ILI rate increased rapidly, peaking at 107·6 cases/1000 consultations. For the following 3 months, the ILI rate decreased slowly, but remained above the average level of the previous 3 years. In November the ILI rate rose sharply again, peaking at 113·8 cases/1000 consultations by the end of November. In mid-December, the ILI rate decreased to around 50 cases/1000 consultations.
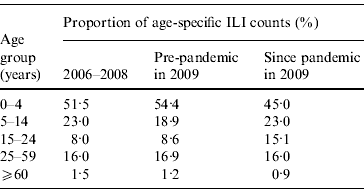
As Figures 2 and 3 show, when broken down by age group, the weekly variation in ILI counts for most groups appeared to follow a similar pattern as for ILI rates, exhibiting semi-annual peaks in July and November. The weekly ILI counts for the 0–4 years age group showed clear semi-annual peaks, and the highest weekly ILI count during the November peak was slightly higher than that during the July peak. For the 5–14 and 15–24 years age groups, the highest weekly ILI count during the November peak was much higher than that during the July peak. Conversely, for the 25–59 and ⩾60 years age groups, the highest weekly ILI count during the November peak was lower than that during the July peak. Table 2 shows that the proportion of the age-specific ILI counts varied greatly in three out of five age groups when the pandemic arrived. The proportion of the ILI counts for the 0–4 years age group was 45·0% post-pandemic, compared to 54·4% pre-pandemic in 2009 and 51·5% in 2006–2008. The proportion of the ILI counts for the 5–14 years age group was 23·0% post-pandemic, compared to 18·9% pre-pandemic in 2009. The proportion of the ILI counts for the 15–24 years age group rose to 15·1% following the pandemic, up from 8·6% prior to the pandemic in 2009 and 8·0% in 2006–2008. The proportion of ILI counts for the 25–59 and ⩾60 years age groups remained almost unchanged.
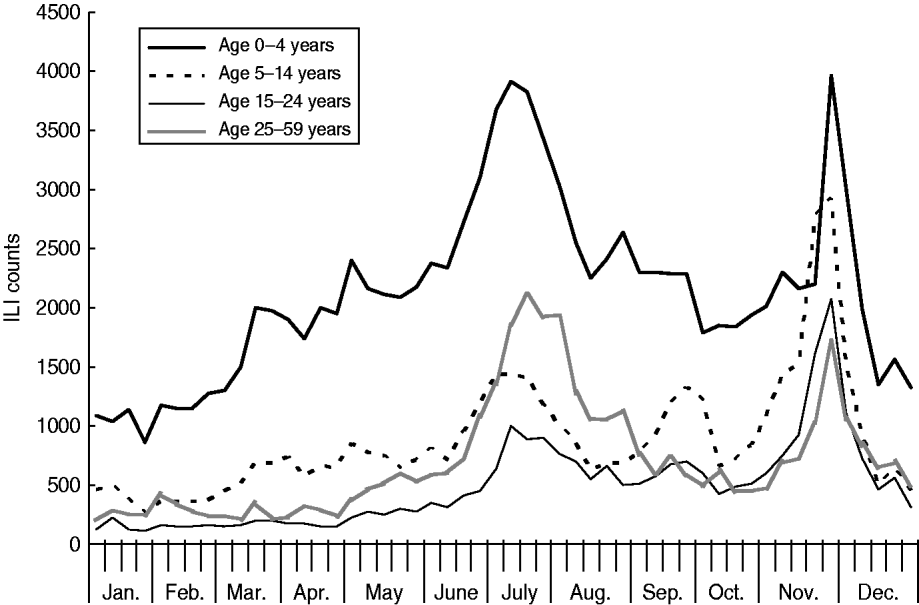
Fig. 2. Weekly influenza-like illness (ILI) counts for age groups aged <60 years, 2009.
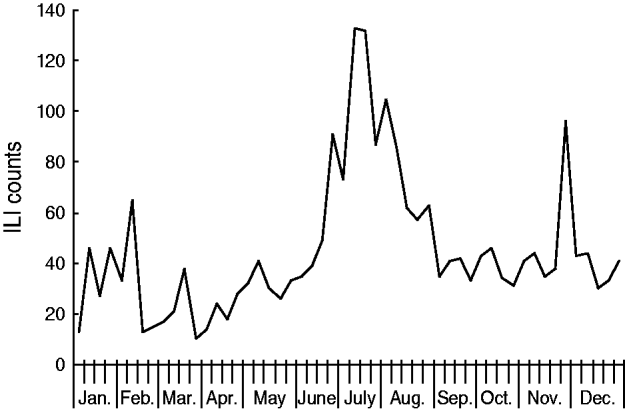
Fig. 3. Weekly influenza-like illness (ILI) counts for age group aged ⩾60 years, 2009.
Table 2. Age-specific influenza-like illness (ILI) counts since pandemic, compared to pre-pandemic in 2009 and 2006–2008, in Shenzhen
Laboratory surveillance
Pharyngeal swab samples were collected from 5144 patients with ILI in 2009. In total, 1306 ILI case-patients tested positive for influenza (122 seasonal H1N1 subtype, 479 seasonal H3N2 subtype, 450 pandemic H1N1 subtype, 252 type B Victoria-lineage, three type B Yamagata lineage). The average percent testing positive in 2009 was much greater than in the previous 3 years (25·4% for 2009 vs. 5·4% for 2006, 11·6% for 2007 and 12·2% for 2008; see Table 1). Figure 4 shows that influenza B Victoria lineage and the seasonal H1N1 subtype were the dominant strains in the first 5 months of the year. In the following 3 months, the rate of positive isolates increased rapidly and the seasonal H3N2 subtype dominated. Pandemic H1N1 subtype influenza was first isolated in July, and became dominant from September onwards.

Fig. 4. Number of influenza viruses by subtype and percentage positive from laboratory surveillance, 2006–2009.
Outbreak surveillance
A total of 414 ILI outbreaks were reported in 2009, representing an increase over the previous 3 years (113, 50 and 73 ILI outbreaks were reported for 2006, 2007 and 2008, respectively; see Table 1). The outbreaks involved 2634 patients with ILI. The 2009 influenza season underwent three waves of epidemics (see Fig. 5). The first wave occurred in March and April, and was caused mainly by influenza B Victoria lineage. The second wave came in June and July, and was attributable to seasonal subtype H3N2. The third wave was caused by pandemic H1N1, and occurred between September and November 2009. The highest number of weekly ILI cases from outbreaks was 237, recorded at the end of June. The highest number of weekly ILI outbreaks was 38, recorded in September. The highest number of monthly ILI outbreaks was 122 occurring in September, followed by 93 ILI outbreaks in November. Overall, 345 (83·3%) outbreaks occurred in schools, with 36 (8·7%) in nursery schools and 33 (8·0%) in factories. No outbreaks were reported in hospitals.
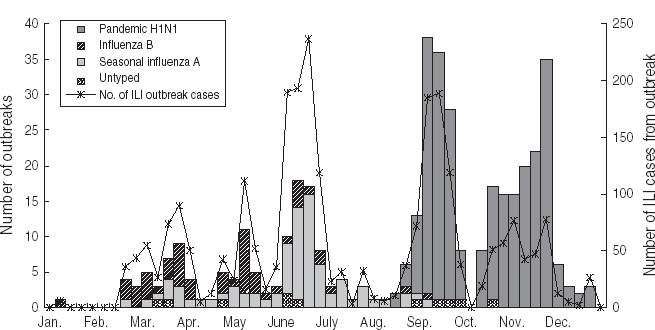
Fig. 5. Influenza-like illness (ILI) outbreak monitoring in Shenzhen, 2009.
DISCUSSION
In 2009, a high prevalence of influenza infection was observed in Shenzhen by clinical, laboratory and outbreak surveillance systems. Seasonal and pandemic influenza were prevalent over different times of the year: seasonal influenza H3N2 dominated during the summer influenza season, while pandemic H1N1 dominated for the rest of the year. The average consultation rate for ILI, the percent positive for influenza virus isolation and the number of ILI outbreaks were the highest recorded for November since influenza surveillance was established although the peak was similar in magnitude to seasonal influenza peaks in previous summers.
Although the underlying determinants of seasonality of influenza circulation remain unknown [Reference Nelson and Holmes17], common patterns have been observed. In temperate and some subtropical regions, influenza epidemics occur and peak in the same months each year before gradually disappearing for the rest of the year. In Shenzhen, with epidemic onset varying by a few weeks over the past 3 years, influenza circulation demonstrated consistent annual cycles. However, the 2009 pandemic increased the ILI rate, leading to unexpectedly high off-season rates. Similar increases in ILI rates in the non-epidemic season were also noted by influenza surveillance systems in other subtropical and temperate regions including Hong Kong [18], USA [19] and New Zealand [20]. In the USA, compared to the regular winter peak of influenza infection, ILI peak started much earlier in 2009, with ILI rates increasing sharply in August and the highest rate of 7·7% being recorded at the end of October. It is likely, therefore, that this earlier peak for influenza activity emerged as a result of pandemic H1N1. In the southern hemisphere, New Zealand's ILI surveillance reported a regular winter peak which started in June and ended in September. However, the peak ILI rate was three times higher than in previous years. In Hong Kong, which borders Shenzhen, ILI rates showed a marked increase in September. The ILI peak was delayed by 2 months compared to the previous year, and the highest ILI rate was almost double that of 2008. With the appearance of pandemic H1N1, ILI surveillance around the world recorded much higher influenza activity compared to previous years, and these trends were confirmed by laboratory surveillance. The much higher ILI rates recorded, the broader ILI peak and the additional out-of-season ILI peaks can all be attributed to pandemic H1N1. Pandemic H1N1 virus is a novel multiple-reassortant influenza virus that has a gene originating from the 1918 swine influenza virus and other genes from human, avian and Eurasian swine influenza viruses [Reference Chang21, Reference Dawood22]. As there was little and heterogeneous immunity to this novel virus in the general population, there was rapid spread in susceptible individuals [Reference Stephenson and Zambon23]. A recent study [Reference Hancock24] supported this assumption by measuring the cross-reactive antibody responses arising from previous infection or vaccination. These authors found that vaccination with recent seasonal influenza vaccines induced little or no immunity to pandemic H1N1, and persons aged <30 years had little evidence of pre-existing immunity to pandemic H1N1. Similarly, a cross-sectional serological study [Reference Miller25] from the UK observed that in serum samples taken in 2008, 2·8% of children aged <15 years and 23·3% of adults aged ⩾65 years had protective immunity to pandemic H1N1. Therefore, the little and heterogeneous pre-existing immunity to pandemic H1N1 may account for the much higher ILI rates and off-season peaks.
With regard to the age distribution of pandemic H1N1 morbidity, our study offers important findings. There were more cases of ILI aged between 5 and 24 years during this pandemic than during previous seasonal influenza epidemics. On the other hand, for persons aged >25 years, most cases of ILI occurred during the seasonal influenza epidemic. This suggests that younger persons were more susceptible to pandemic H1N1 than older persons, although our ILI surveillance recorded fewer older patients with ILI and the ILI rate by age group was not available due to lack of total numbers of patient visits by age group. This finding is consistent with other studies. For example, two studies [Reference Hancock24, Reference Miller25] found that older adults had pre-existing cross-reactive antibodies against pandemic H1N1. A Mexican study [Reference Chowell26] reported that during the early phase of the pandemic H1N1 outbreak, 71% of cases of severe pneumonia fell into the 5–59 years age group compared to average rates of 32% in that age group during previous influenza seasons. Another epidemiological study from Canada [Reference Fisman27] observed that persons aged >52 years had a significantly reduced risk of infection with pandemic H1N1. Prior pandemics exhibited similar phenomena: for example during the 1918 pandemic [Reference Taubenberger and Morens28], the influenza incidence for persons aged <35 years was disproportionately high. Most evidence seems to suggest that young persons suffer most during pandemics, the explanation being that older persons might be protected by cross-reactive immunity from infections in early life. Our study would benefit from incidence rates by more specific age groups.
Of note, seasonal influenza also played an important role in the overall influenza circulation in 2009. In addition to pandemic H1N1, the high prevalence of seasonal influenza in the first half of the year contributed to the high ILI rates. In the past 3 years the pattern of influenza circulation in Shenzhen was characterized by frequent transitions of the predominant strains. Although the annual cycles of influenza circulation were evident, the predominant strain changed with climate transition from spring to summer. In 2007, seasonal H3N2 and influenza B type Yamagata lineage were the predominant strains for spring and summer, respectively. In 2008, influenza B type Victoria lineage and seasonal H1N1 were responsible for influenza activity in spring and summer, respectively. However, multiple subtypes were active in 2009, with winter circulation beginning to appear due to pandemic H1N1. In comparison, the ILI surveillance from the nearest city (Hong Kong) reported seasonal influenza A type as the dominant strain with alternate subtypes throughout the influenza season over the past few years. The transition of dominant strains is generally associated with low serological responses to new variants. The influenza virus undergoes constant antigenic drift and subsequently forms new variants; therefore, it can cause yearly epidemics. In Shenzhen little immunity to new variants in susceptible populations may be attributed to a large influx of migrant workers from rural areas. Shenzhen is a large metropolitan city in southern China, attracting millions of migrant workers from other provinces around the country. The local government estimated that in 2007 about 60% of the total population were migrant workers from inland provinces. As most migrant workers come from rural areas where immunity against influenza is low, this population may be more susceptible to influenza than the local resident population. With a continuous inflow of susceptible individuals, new variants of influenza may be able to spread faster and facilitate the development of an influenza epidemic. However, since we do not have seroprevalence data to show the difference in immunity between migrant workers and local permanent residents, this theory is difficult to prove. Differences in attack rates of influenza between urbanized populations [Reference Davis29] and isolated islanders [Reference Mantle and Tyrrell30] in the 1968 H3N2 pandemic were reported, with attack rates of 30–40% in US households vs. 96% on the island of Tristan da Cunha. The impact of migration of rural populations into urban areas on influenza activity requires further investigation.
Despite much research in recent years, uncertainty regarding the seasonality of influenza in tropical regions remains. Seasonality of influenza is associated with many factors including pathogen characteristics, environmental changes and human behaviour. Influenza virus is more stable and spreads more rapidly in cool, dry conditions [Reference Hemmes, Winkler and Kool31], and people tend to spend more time indoors in winter; these factors are conducive to clear, recurrent cycles in temperate regions. Moreover, low levels of ultraviolet radiation and vitamin D deficiency [Reference Cannell32] in the population in winter may help viruses to survive. In comparison, epidemic cycles are less apparent in the tropics, where influenza epidemics occur throughout the year [Reference Nelson and Holmes17]. A study from Singapore [Reference Chew33] found that influenza activity peaked during June–July and November–January, and a semi-annual cycle for influenza B infection was associated with rainfall. Some studies [Reference Russell34] suggested that tropical regions may act as reservoirs for influenza infection and account for recurrent epidemics in temperate climates. Therefore, seasonality of influenza in tropical climates warrants further study.
Our influenza surveillance system is a comprehensive and well-organized network, covering most features of influenza activity including laboratory, clinical and outbreak monitoring. The system operates under unified guidelines and standards formulated by Shenzhen CDC for all participating units. All participating staff of laboratories and hospitals were trained and assessed on a regular basis to maintain good consistency and quality. In addition, a strength of our surveillance is that the eight laboratories and nine hospitals are geographically distributed across Shenzhen's seven districts, with at least one laboratory and one hospital in each district, rendering the surveillance results representative of the general population. To add to this point, influenza testing was offered free-of-charge to all the sampled ILI patients, thereby eliminating bias towards financially capable individuals.
Some limitations of our study should be addressed. First, ILI surveillance was not able to identify patients with ILI not seeking medical care. These patients may have bought antiviral medication over the counter or, in mild cases, recovered without any medication. Second, as influenza has no specific symptoms, the case definition for ILI does not exclude other respiratory viruses such as respiratory syncytial virus (RSV) [Reference Zambon35], a major cause of the common cold. The ILI surveillance system therefore may have excluded some true cases of influenza while including some false cases caused by other respiratory diseases. A combination with laboratory surveillance could provide more accurate information. Finally, a ‘holiday effect’ should be considered when reviewing the surveillance results, the unusual and sudden rise in ILI rates at the end of January could be explained by the sharp fall in overall consultation visits during Chinese New Year, the main national holiday in China. Similarly, since students take days off during holidays such as National Day at the beginning of October, few outbreaks were reported in schools during that time.
In conclusion, this study used multiple surveillance methods to thoroughly assess the intensity of influenza epidemics in 2009. We found that the introduction of the novel influenza strain was associated with a high prevalence of influenza regardless of season, for low immunity in the susceptible population.
ACKNOWLEDGEMENTS
The authors are grateful to all workers in each sentinel of Shenzhen influenza surveillance, to Shenzhen Health Bureau for providing a special fund, and to Dr Jin Mou, Dr Gracia Fellmeth and Dr Ben Cowling for comments and help on early versions of this manuscript.
DECLARATION OF INTEREST
The authors of this study are staff of Shenzhen Center for Disease Control and Prevention.


