INTRODUCTION
A pandemic influenza A (H1N1) virus emerged in Mexico in March 2009 and has subsequently spread rapidly around the world [Reference Chowell1]. The World Health Organization affirmed the existence of the first influenza pandemic of the 21st century on 11 June 2009. As with earlier pandemic influenza strains in 1918, 1957 and 1968 [Reference Henderson2–Reference Miller6], and as with the ‘Russian flu’ H1N1 outbreak in the late 1970s [Reference Gregg, Hinman and Craven7], the 2009 pandemic H1N1 influenza A virus has been associated with higher attack rates in younger individuals [Reference Ahmed, Oldstone and Palese8, Reference Miller9], and most early fatalities appear to have occurred in individuals aged <50 years [Reference Chowell1] (Fig. 1). This stands in marked contrast to mortality patterns observed during seasonal influenza epidemics, where mortality is seen predominantly in those at the extremes of age [Reference Dushoff10].
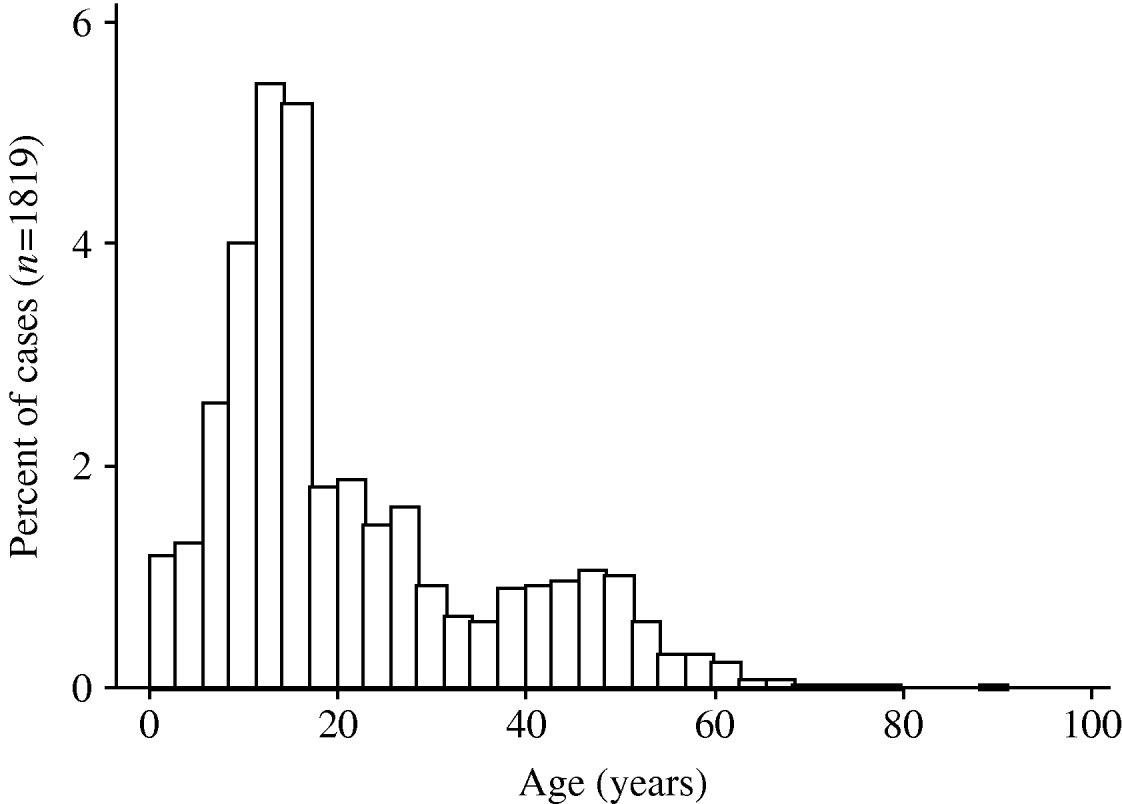
Fig. 1. Age distribution of pandemic influenza A (H1N1) virus cases in Ontario, Canada. The histograms show the proportion of cases, by age, in individuals testing positive for pandemic influenza A (H1N1) virus in the Ontario Public Health Laboratory system. Risk of infection decreases with age, and is rare in individuals born prior to 1957.
This unique pattern means that optimal pandemic response strategies will differ from the well-tested strategies used for seasonal influenza and therefore, it is critical that we consider the following questions: What are the implications of differential age-related susceptibility for the dynamics of influenza epidemics associated with newly emerged strains? Why do pandemics cause a ‘W-shaped’ pattern of excess relative or absolute mortality? How can these dynamics help explain the geographic variability in the apparent severity of influenza pandemics? How do these dynamics influence the choice of disease mitigation and control strategies? In the following sections we will address each of these questions in the context of pandemic H1N1 influenza A (H1N1) virus (pH1N1).
Disease dynamics and W-shaped mortality curves
The basic reproductive number of an infectious disease (R 0) can be described as the number of new cases created by a single infected individual in a fully susceptible population. As an example, when R 0=3, each infected individual typically generates three secondary cases before they recover and each of these secondary cases go on to create three additional cases. When R 0 is >1, the disease can spread easily throughout the population, causing an epidemic [Reference Fisman11]. However, R 0 is an idealized quantity, and represents the reproductive number of an infectious disease introduced into a completely susceptible population in the absence of intervention (e.g. no attempt to keep infectious individuals from interacting with susceptible individuals via isolation). When these conditions do not apply, the reproductive number is often denoted ‘effective R’, or R e. As more individuals begin to acquire immunity (as a result of previous infection), the reproductive number changes from R 0 to a smaller R e because each new case can no longer generate three new secondary cases due to immunity in the population. The relationship between R 0 and R e in a homogeneously mixed population is simply:
where S is the fraction of the population susceptible to the infectious disease in question.
The distinction between R 0 and R e makes it possible to reconcile the varying estimates of R that have been derived for pH1N1. For example, Paterson and colleagues investigated an outbreak of pH1N1 at the St Francis Preparatory School in New York early in the 2009 pandemic. Their analysis of the outbreak yielded a reproductive number of 2·7 in that particular school setting [Reference Paterson, Durrheim and Tuyl12]. They noted that another recent estimate of the reproductive number in the community setting, based on events in Mexico in April 2009, was lower (~1·5) [Reference Fraser13]; we have recently published similar estimates of community-based reproductive numbers for pH1N1 in the Canadian province of Ontario [Reference Tuite14].
Elevated reproductive numbers in school settings could be related to crowding or behavioural factors. However, if notwithstanding the novel nature of pH1N1, older individuals in the population are partially protected against infection by prior exposure to antigenically similar viruses, then the reproductive number estimated in a young population (i.e. in a school outbreak) should approximate R 0 (the reproductive number in an entirely susceptible population) whereas the R estimated by Fraser and colleagues would simply be R e in a partially susceptible population. Protection in older individuals is consistent with the young age of cases reported in Mexico, USA, Canada, and Japan [15, Reference Normile16]. Younger age distributions of cases were also noted in the 1918, 1957 and 1968 influenza pandemics [Reference Henderson2, Reference Stuart-Harris5, Reference Ahmed, Oldstone and Palese8, Reference Miller9], and have been attributed to early-life exposure to related influenza strains in older individuals [Reference Ahmed, Oldstone and Palese8].
Returning to R 0 and R e in a well-mixed population, we can use simple algebra to show that
If R 0=2·7, and R e=1·5, then R e/R 0 in this case would be ~0·55. It is interesting to note that ~55% of the USA population is aged <40 years [17]. We recently demonstrated that individuals aged >40 years appear protected against infection with pH1N1 [Reference Fisman18]. Older individuals may have prior exposure to H1N1 influenza strains that circulated each year prior to the 1957 pandemic. Both epidemiological and serological data derived from the current pandemic suggest that individuals born prior to 1957 have a high degree of protection against infection with pH1N1, and those born between 1957 and 1976 appear to have a degree of protection as well [Reference Fisman18, Reference Hancock19].
Extending this concept provides an obvious hypothesis regarding the non-emergence of a H1N1 pandemic in 1976–1977. As a disease with an initial R e<1 cannot cause an epidemic following introduction, increasing the proportion of individuals in a given population who have pre-existing age-related immunity to a novel influenza strain decreases the likelihood of pandemic occurrence. The failure of the Russian flu H1N1 influenza strain that emerged in 1977 to cause a pandemic may have, again, reflected population exposure to similar H1N1 strains that were circulating prior to 1957 [Reference Gregg, Hinman and Craven7]. However, in this situation, a much higher proportion of the population (all individuals aged >20 years) would have had extensive prior exposure to H1N1, driving down S. During the Russian flu episode, attack rates >70% were observed in many high schools and military bases within the USA, but very few cases were observed in teachers, faculty members or staff making ‘Russian flu’ an epidemic only in the young, and not a true pandemic [Reference Gregg, Hinman and Craven7].
The atypical pattern of mortality associated with some pandemics, with elevated relative or absolute risk in individuals in the middle years of life, has been described as ‘W-shaped’, to denote the appearance of histograms of fatalities by age [Reference Olson4]. Such a pattern emerged in the 2009 pandemic [Reference Chowell1, Reference Donaldson20] and was famously associated with the 1918 influenza pandemic [Reference Olson4]. However, such a pattern was also present in the 1957 pandemic when relative, rather than absolute, risk of mortality is considered (i.e. the increase in pneumonia and influenza-related mortality in younger individuals relative to that seen in the preceding influenza season was far greater than that seen in older individuals [Reference Serfling, Sherman and Houseworth3]). Limited data suggest that W-shaped relative mortality patterns may have existed during the presumed 1837 influenza pandemic as well [Reference Streeten and Thompson21].
The signature W-shaped mortality identified in influenza pandemics may be seen entirely as a result of differences in age-related risk of infection, without the need to invoke differences in age-specific risk of poor outcome between seasonal and pandemic strains. In other words, it is not necessary to invoke the presence of a superantigen response in a subset of otherwise healthy young adults [Reference Kash22] in order to make sense of W-shaped mortality. This concept is illustrated graphically in the schematic diagram presented as Figure 2. It can be seen that when a disease process that is associated with U-shaped case-fatality, such as seasonal influenza (which has highest case-fatality rates in the youngest and oldest individuals) occurs with attack rates that diminish with age (as is characteristic of pandemic influenza), the result is a W-shaped distribution of mortality by age.
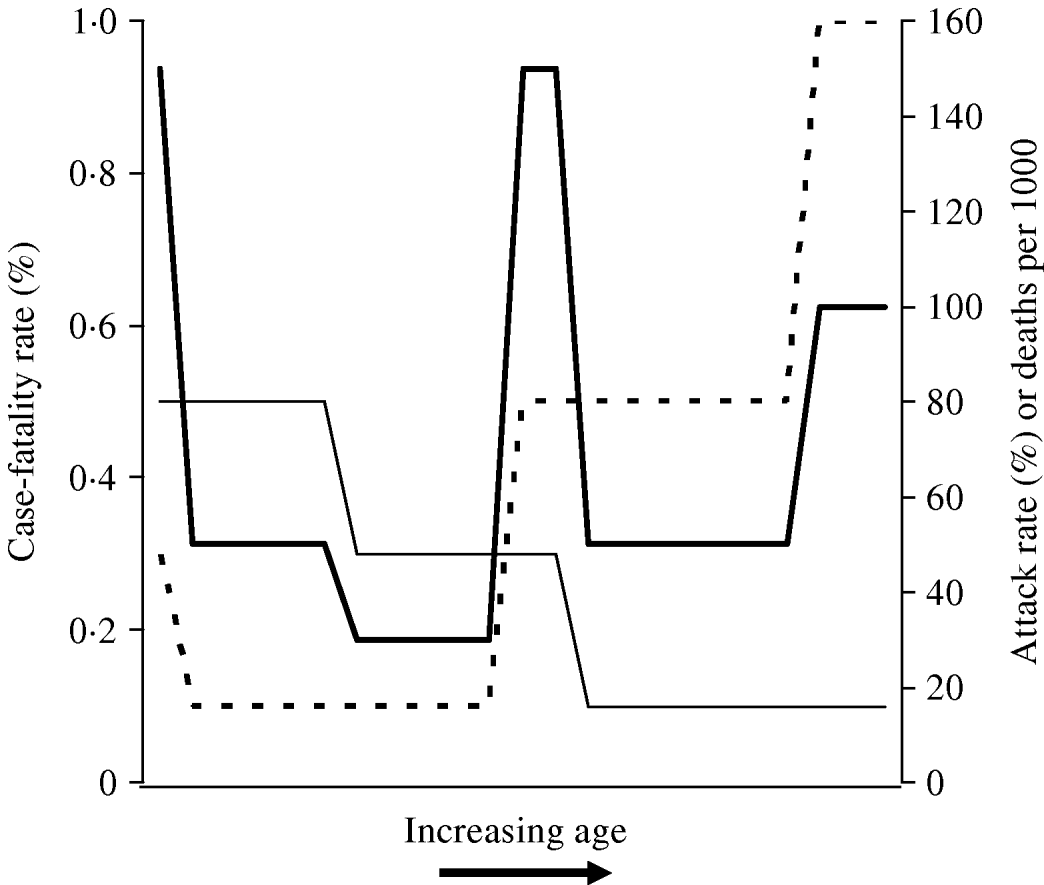
Fig. 2. Schematic diagram of derivation of W-shaped mortality patterns. Attack rate (–––) diminishes with age, while case-fatality rate (- - -) exhibits a U shape (highest at extremes of age). The resultant distribution of deaths (![]() ) has a W shape, characteristic of influenza pandemics.
) has a W shape, characteristic of influenza pandemics.
It may be surprising that a temporally distant influenza virus exposure would confer protection, when little durable immunity is conferred by seasonal exposure to closely related influenza strains as a result of antigenic drift [Reference Dushoff23]. However, this effect may be consistent with the immunological model of ‘original antigenic sin’ [Reference Francis24–Reference Taber26], which suggests that the first exposure to an antigen provokes a strong humoral immune response; as influenza antigens drift over time, neutralizing antibodies become less effective, but re-challenge provokes expansion of the original B-memory response. A recent study evaluating banked sera from prior to the onset of the current pandemic has identified a high prevalence of cross-reactive neutralizing antibody to pH1N1 in older individuals, particularly those aged >60 years [Reference Hancock19].
In this instance, it might be expected that pandemic H1N1 haemagglutinin (HA1) genes would bear similarity to those of influenza A strains circulating prior to 1957. Preliminary evaluations of archived HA1 sequences in Genbank [27] do not suggest a close relationship between pH1N1 and pre-1957 H1N1 strains, but the complexity of such comparisons and gaps in knowledge of pre-1957 viral sequences suggest that this hypothesis warrants further investigation.
Implications for populations with low mean age
Increased susceptibility to pH1N1 infection in younger individuals, relative to older adults, would have several important epidemiological implications: it suggest that schools, universities, military bases, and other areas with large concentrations of younger individuals will be major foci for pandemic influenza outbreaks. Similarly, it means that optimal vaccination strategies target younger adults than are usually targeted in seasonal influenza vaccination campaigns [Reference Miller9]; and it means that low-income countries or specific segments of the population, which have ‘triangular’ population distributions (younger individuals greatly in excess of older individuals) will have attack rates higher than seen in countries with larger proportions of older individuals.
In Canada, Indigenous populations have been severely impacted by the introduction and spread of pH1N1 in isolated communities [Reference Kumar28, Reference La Ruche29]. Although this severity has been attributed to crowding and high rates of underlying illness in Indigenous communities [Reference Kumar28–30], and could also reflect differential functioning of surveillance systems in different communities, a striking feature of these communities is that the age distribution of community members tends to be younger than the general Canadian population. In contrast to the general Canadian population where ~43% of the population are aged <34 years and 26% are aged >52 years, 60% of Indigenous communities are aged <34 years and only ~14% are aged >52 years [31]. We recently published data from Ontario demonstrating that the relative risk of infection with pH1N1 is ~0·42 in individuals aged 33–52 years (i.e. those born between the 1957 and 1968 pandemics), and 0·15 in individuals aged ⩾53 years (i.e. those born prior to the 1957 pandemic) [Reference Fisman18].
If we assume that the risk of exposure sufficient to transmit infection (P exp) does not vary across age groups then we can estimate a crude relative risk for Canadian Indigenous communities, relative to the Canadian population as a whole as follows, using the age distributions and relative risks described above:
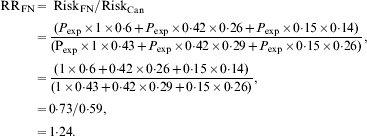
In other words, although poverty and associated crowding could result in higher attack rates in Indigenous populations in Canada, we would expect the risk of infection to be 24% higher in Indigenous Canadians than in other Canadians on the basis of age distribution alone, with the attributable risk percent for infection in Indigenous Canadians being equal to 19%. However, the relative risk of infection in some Indigenous communities during the first wave of the 2009 influenza pandemic appeared many times higher than that seen in the general Canadian population [Reference La Ruche29]. How can these differences be reconciled?
To understand that these observations are not inconsistent, it is important to recall that epidemics are dynamic, time-dependent processes, with risk of infection for individuals evolving over the course of an epidemic. We can capture the dynamic character of an epidemic by representing it in terms of reproductive numbers. Assume there is universal susceptibility to novel pH1N1 in young individuals, and universal exposure to pH1N1. In that case, the proportion of the population susceptible (S) to infection in Canada's Indigenous peoples would be RiskFN of 0·73. Assuming that the R 0 is truly 2·7, and using equation (1), we can estimate that R e in this population would be 0·73×2·7, or 2·0; the corresponding value for R e in the general Canadian population would be 1·6.
Figure 3 shows simulated epidemic curves and cumulative attack rates associated with infections with R=2·0 and R=1·6, respectively. It can be seen that the simulated epidemic curve for the Indigenous population peaks earlier and has a narrower base than that for the general Canadian population. The ratio of cumulative attack rates (i.e. cumulative attack rate in the Indigenous community divided by the cumulative attack rate in the general population) at any point in time will be the estimated relative risk of infection available to public health practitioners at that point in time. In Figure 4, these ratios are plotted (on a log scale) over time; because of the earlier peak of the epidemic in the younger (Indigenous) population the relative risk in this population is extremely high (~40); as the epidemic wanes in this population, and takes off in the general population, the relative risk declines. The relative risk of infection at the end of the epidemic is simply the ratio of final epidemic sizes derived using the Kermack–McKendrick ‘final size formula’ [Reference Pascual32], which in this case is 0·79/0·64, or 1·23, almost identical to the relative risk estimated using age-weighted estimates of risk and much smaller than the relative risk estimates derived by taking ratios of attack rates early on.
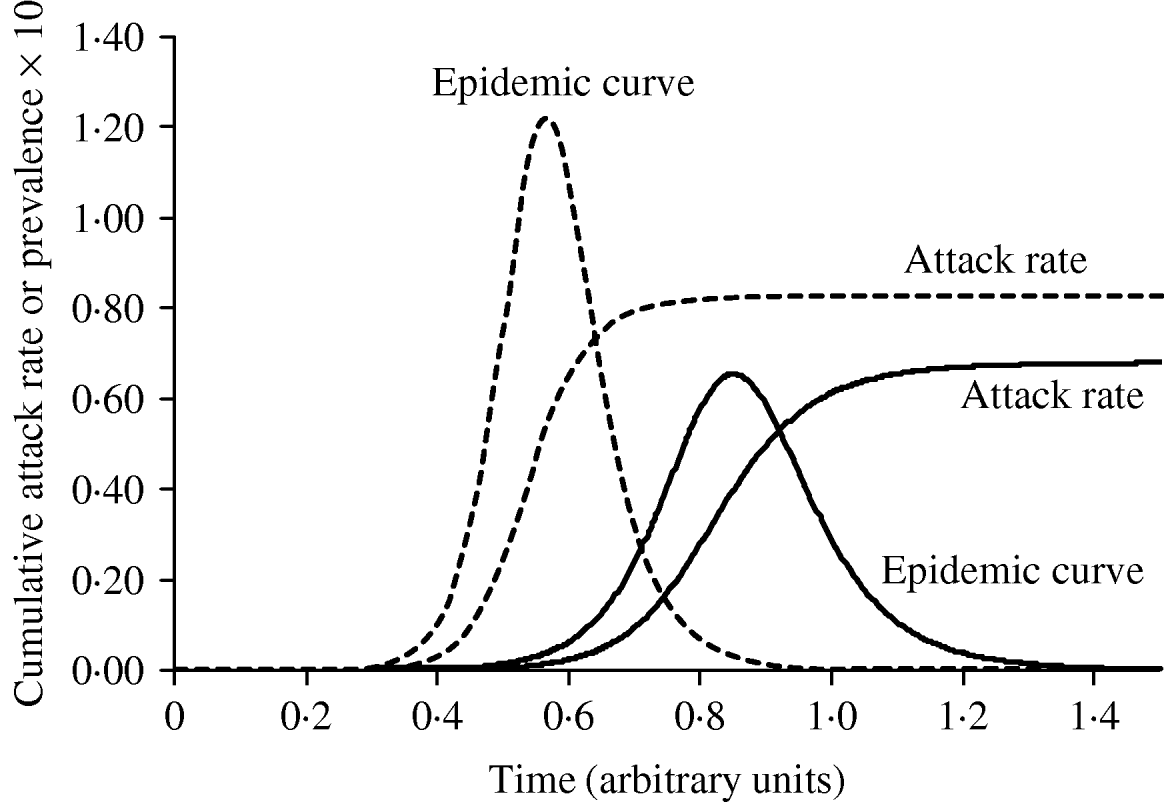
Fig. 3. The impact of reproductive number on the shape and timing of the epidemic curve, and final epidemic size. With a slightly higher R (1·9, - - -), the epidemic grows more quickly, peaks earlier, and ends earlier, with a higher cumulative attack rate. An epidemic with R=1·5 (–––) is shown for comparison.
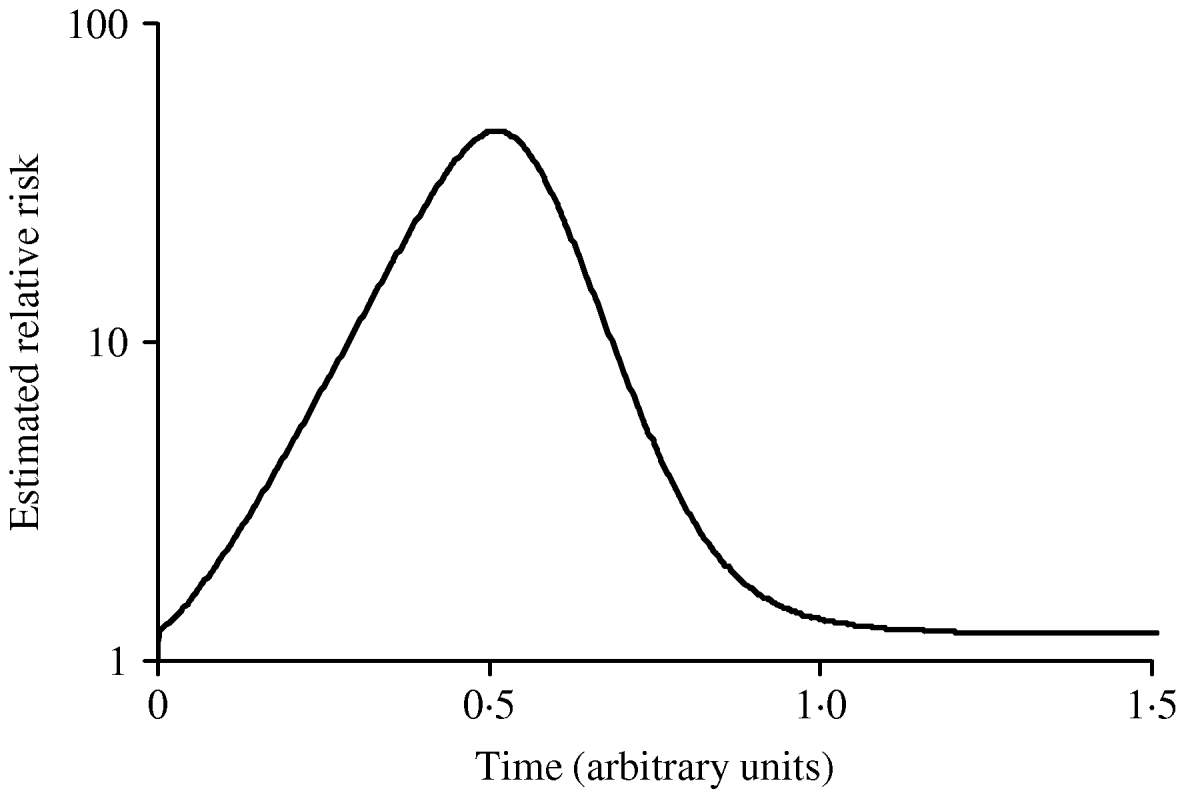
Fig. 4. Changing estimates of relative risk of infection in younger population in an epidemic. The curve represents the ratio of the cumulative attack rates over time presented in Figure 2. The earlier epidemic peak in the younger population results in an extremely high relative risk of infection early in the epidemic. The relative risk of infection when the epidemic ends is the ratio of the final epidemic sizes in the two populations (relative risk ~1·25).
The key, however, is that in younger populations, the epidemic takes a more rapid course with an earlier peak, which may have the practical effects of overwhelming public health and hospital resources, causing concern or panic in the population, and/or occurring entirely before implementation of programmes aimed at mitigation of the epidemic (e.g. vaccine programmes) can be put into place. This phenomenon will apply in any population with the ‘triangular’ age distribution characteristic of lower-income regions and countries, and may help explain some of the apparent geographic variation in severity characteristic of influenza pandemics [Reference Miller6].
Optimal disease mitigation and control
Seasonal influenza vaccination campaigns typically target the elderly and those of any age with one or more chronic medical conditions, to protect those most at risk of complications from infection. The different relationship between age and disease risk in seasonal influenza epidemics [Reference Louie33, Reference Simonsen34] compared to influenza pandemics [Reference Ahmed, Oldstone and Palese8, Reference Miller9, Reference Luk, Gross and Thompson35] means that seasonal vaccination frameworks are not likely to be applicable in a pandemic situation. Miller and colleagues have pointed out that if the goal of vaccination in a pandemic is to minimize life-years lost, strategies need to be ‘pandemic-specific’, and reflect the age distribution of cases [Reference Miller9]. (Of note, Galvani and colleagues have also pointed out that because of their relative mobility and high rates of contact with others, vaccine strategies targeting younger individuals at diminished risk of poor outcomes may actually be optimal in seasonal influenza as well [Reference Galvani, Reluga and Chapman36].)
In the face of a higher force of infection in younger persons with the currently circulating pandemic strain, the apparent protection against infection in older adults, and the expectation that initial vaccine supplies were expected to be insufficient to vaccinate the entire population, many jurisdictions have implemented alternate vaccination strategies that reflected age-related changes in susceptibility to infection [37, 38]. The WHO pH1N1 vaccine allocation guidelines also reflected the observed pH1N1 age-infection risk distribution, with younger adults recommended for prioritization for vaccine receipt over older adults [39]. Focusing initial vaccination efforts on children and younger adults was adopted as a means of effectively targeting the groups with the highest expected disease burden, as well as those most responsible for disease transmission [Reference Smith40]. The effectiveness of these alternative vaccination schemes in reducing the population-level impact of pH1N1 remains to be determined, although the delayed availability of vaccine in the northern hemisphere, relative to the peak of pH1N1 activity probably reduced the utility of vaccination in general as a disease mitigation tool [Reference Tuite41].
In the absence of vaccine or other pharmaceutical interventions (i.e. antiviral treatment or prophylaxis), social distancing measures, including school closures and cancellation of large public gatherings, are an effective strategy for controlling influenza transmission [Reference Bootsma and Ferguson42, Reference Hatchett, Mecher and Lipsitch43]. Models suggest that school closures would act synergistically with other control interventions [Reference Gojovic44]. Closures were implemented in Mexico and other jurisdictions early in the pandemic [45, Reference Shetty46], but school closures were not widely adopted due to their high economic costs and disruptive nature.
Finally, as might be expected given pH1N1's propensity to spread in susceptible populations, summer camps, which have large groups of children and young adults in close contact, were also observed to be hotspots for pH1N1 [Reference Lewin47]. In the northern hemisphere, continued spread of pH1N1 during the summer months, when influenza activity generally declines, was a surprising phenomenon. Seasonal oscillation has resulted in an apparent increase in R 0 for pH1N1 in North America in autumn 2009 [Reference Dushoff23], a phenomenon that could be related to either environmental or social phenomena (e.g. reopening of schools and universities closed during the summer).
CONCLUSION
As with previous pandemics, the 2009 emergence of pH1N1 strain has been associated with age-related risks of infection that are distinct from those seen during seasonal influenza epidemics. The dynamics of disease transmission and corresponding public-health planning priorities and intervention strategies will differ depending on the age distribution of cases. As such, we echo the recommendations of Miller and colleagues, who note that rapid assessment of the relationship between age and infection risk needs to be a high priority for research with the emergence of an influenza strain with pandemic potential [Reference Miller9]. More broadly, however, the contrast between age effects in influenza pandemics relative to those seen in seasonal epidemics, may be an important clue into the evolution, dynamics, emergence, and apparent disappearance of influenza strains over time.
DECLARATION OF INTEREST
Dr Fisman has previously received unrestricted research funds from Sanofi-Pasteur Canada, which manufactures influenza vaccines.


