


1. Introduction
Cost-effective environmental regulation is relevant for developing countries, where budgets for environmental protection are typically small. One particular concern is monitoring and enforcement. Any regulation of environmental pollution such as air, water (surface and groundwater), and land cannot be effective without appropriate monitoring and enforcement. However, monitoring and enforcement are costly. Evidence suggests that a significant portion of the costs of implementing environmental laws arises from the costs incurred by the regulatory agencies for inspections, enforcement activities, and judicial actions against polluters who fail to comply (Gray and Shimshack, Reference Gray and Shimshack2011).
In this paper, we study the impact of monitoring and enforcement actions on the behavior of major toxic polluters in Mexico. One major contribution of this paper is the evidence it provides that the regulatory pressure channels which exist in developed countries also operate in the context of developing countries. We find that despite the imposition of only a few fines on individual polluters, there is a significant deterrence impact on toxic pollutant discharges. We find evidence that the regulation implemented through priority violations detected and fines imposed result in a significant reduction in toxic pollution by the plant. We find some evidence of regulator reputation effects. Shimshack and Ward (Reference Shimshack and Ward2005) define it as plants revising their beliefs with increased sanctions on other plants in the same jurisdiction. Policymakers need to consider this spillover effect as it implies that significant cost-efficiency is obtained from these rarely-imposed monetary fines.
Past studies on regulation in a developing country context are limited. The only other study that looks at determinants of monitoring and fines is Escobar and Chávez (Reference Escobar and Chávez2013) for conventional air emissions in Mexico City. However, they do not consider actual emissions reported by major polluters. Past evidence on voluntary environmental initiatives indicates that environmental certificates are limited to short-term improvements in environmental performance (Blackman et al., Reference Blackman, Lahiri, Pizer, Rivera Planter and Muñoz Piña2010). Hence, the effectiveness of regulatory activities such as inspections, and enforcement actions such as monetary fines, remains an open question.
We make three main contributions to the environmental regulation literature in a large developing country. First, we find evidence that inspections and fines are consistent with the compliance history of the individual facility. Second, we find evidence that the regulation implemented through priority violations detected and fines imposed result in a significant reduction in toxic pollution. This result is economically meaningful as it provides evidence on the deterrence effect of regulatory activities such as priority violations and fines. Third, we show that regulator fines against others in the same jurisdiction lead polluters to reduce their toxic pollutant discharges.Footnote 1 We infer that regulatory pressure directed at individual polluters and against all other polluters in the same municipality are both effective in improving environmental performance of major toxics polluters.
To explore our questions, we created comprehensive panel data on 3,436 major toxics-generating facilities from 2004 to 2015 by matching annual pollution reports on seven toxics with the inspections and fines data from the federal regulatory agency. We estimate panel data models for inspections, fines, amount of fines, and toxic pollution levels. We address potential sample selection bias, as the reporting of toxics releases might be influenced by regulatory pressure. We include socioeconomic controls and different specifications to account for plant-specific fixed effects and time-varying factors at state level. Environmental regulation in Mexico focuses on improving annual measurement and reporting. Major facilities that are subject to mandatory reporting face fines upon detection of priority violations. Alternatively, they might reach an agreement to improve environmental management practices through voluntary initiatives and certificates.
Results show that an additional priority violation under the toxics program increases the probability of receiving an inspection visit by seven percentage points. Similarly, an additional fine imposed under the toxics monitoring program increases the probability of receiving an inspection visit by three percentage points. An additional priority violation under the toxics inspection program also increases the probability of monetary fines by five percentage points and of a higher fine amount by as much as 18 per cent. General regulatory activities not specifically directed at the plant yield less significant results upon inclusion of plant fixed effects.
We find strong evidence of a deterrence effect of the regulation. An additional priority violation followed by fines leads to a decline in annual toxics releases by more than 50 per cent. Previous studies find that inspectors target larger plants and those belonging to high-risk industrial sectors. Essentially, inspectors do not utilize self-reported toxics pollution as discussed in the data section. In the absence of the typical incentives to underreport pollution, we capture environmental deterrence with the outcome of a reduction in toxics releases. We find some general regulator reputation effects as higher fines against other major polluters in the same municipality induce a small reduction in plant-level annual toxics releases by 0.1 per cent. The reporting results show that plants facing higher inspections under the toxics program, higher inspections under all other programs, and higher fines are more likely to report toxics releases.Footnote 2 Increased frequency of general municipal inspections also increases the likelihood of plants reporting pollution.
Put differently, we provide novel evidence that formal regulatory actions such as inspections and fines are imposed on polluters with recent violations. We find that significant non-compliance followed by fines, results in plants reducing their toxic pollutant releases. Given that the regulation focuses on annual measurement and accurate reporting, we infer that concern for a bad public image due to considerable media attention when fined provides the incentive to reduce pollution levels (La Verdad, 2018; Montoya, Reference Montoya2018; Perla, Reference Perla2018).Footnote 3 Economic incentives also exist. Facilities with priority violations can negotiate voluntary environmental certificates to avoid paying fines. Obtaining these voluntary environmental programs also provides immunity from regulatory scrutiny and a reputation of environmental stewards. We find some evidence that higher fines for other major facilities in the same municipality result in a general deterrence impact.
2. Background monitoring and enforcement
Monitoring and enforcement actions can be quite time-consuming and costly procedures for both developed and developing countries. Environmental inspections in the US range from low-intensity activities such as visual confirmation of abatement equipment to maintenance, sampling and reporting procedures, and even sampling emissions at the plant. Subsequently, enforcement actions depend on the severity of the violation and the compliance history of the facility. Usually, they begin with administrative orders and might end in financial penalties and closure of the plant, following civil and criminal litigation. Regulators target polluters based on local marginal benefits and the costs of monitoring and enforcement (Helland, Reference Helland1998; Gray and Shadbegian, Reference Gray and Shadbegian2004). Inspectors target larger plants that are major polluters and those that have a high environmental impact and risk to human health, such as chemical manufacturing plants. Regulators also target frequent violators with a previous history of non-compliance (Shimshack, Reference Shimshack2014).
Regulatory interventions such as inspections and enforcement actions improve environmental performance in developed countries such as the US. In terms of deterrence, both specific actions against individual polluters as well as general regulatory actions against all other plants under the same legal jurisdiction improve compliance by reducing violations (Shimshack and Ward, Reference Shimshack and Ward2005) or improve over-compliance (Shimshack and Ward, Reference Shimshack and Ward2008). Shimshack and Ward (Reference Shimshack and Ward2005) highlight the mechanism whereby plants revise their beliefs by observing regulatory actions such as increased sanctions on all other plants in the same jurisdiction in the US. The authors also mention that the monetary fines imposed on the plant might underestimate the true economic costs of sanctions resulting from bad publicity or a damaged reputation with the regulators.Footnote 4
Recent evidence from large emerging economies suggests that weak institutions and limited budgets result in environmental regulatory actions that are somewhat limited. Gupta et al. (Reference Gupta, Saksena and Baris2019) find evidence that large air- and water-polluting plants in one state in India improved compliance when faced with more inspections and violation notices. Regulators targeted plants based on their compliance history and those classified as dirty industries, but implemented less stringent enforcement actions if they were more profitable or listed in stock exchange markets. Similarly, China's pollution levy system shows that inspections verify plants' self-reported pollution but do not improve performance by reducing their pollution (Lin, Reference Lin2013).
In Latin America, Caffera and Lagomarsino (Reference Caffera and Lagomarsino2014) find that polluters adjust conventional water pollution discharges upwards in the presence of municipal inspectors in Uruguay. Regarding deterrence, they report the limited effectiveness of specific deterrence in contrast to general deterrence measures such as increased plant closures. Fines against others that are less visible events did not have significant general deterrence impacts. In Colombia, Briceño and Chávez (Reference Briceño and Chávez2010) find that enforcement and control actions (such as sampling inspections) taken by the local corporation of Corpochivor lead to lower self-reported levels of conventional water pollutants. However, enforcement and monitoring activities do not influence the final payment of the discharge fees.
Industrial pollution regulation in Mexico is still at a nascent stage. A two-fold approach has been implemented: the first is through command-and-control regulations based on mandatory reporting thresholds, and the second is through voluntary initiatives by manufacturers that invest in pollution abatement to comply with third-party environmental audits (Blackman, Reference Blackman2010). The focus of the environmental law in Mexico is to ascertain that major polluters of toxic substances into water regularly sample and measure emissions. Inspection visits to check on emission sampling and measurement records and imposing fines on those that have failed to adhere to pollution measurement protocols are the mechanisms used to promote regular measurement and reporting of pollution emissions. There are no limits on how much each plant can pollute. On the other hand, reporting abnormally high levels of emissions compared to the entire industry or sector, or even at national scale, results in reports being flagged as inconsistent and separated from the main emissions registry (Ministry of Environment in Mexico (SEMARNAT), personal communication, 2015).
Escobar and Chávez (Reference Escobar and Chávez2013) show that larger industries in Mexico City that are heavier polluters under the air emissions program face greater regulatory efforts. However, their analysis fails to consider plant-specific pollution levels. Using a small sample of 34 manufacturing facilities under federal jurisdiction and inspection visits during 2011, Camacho (Reference Camacho García2016) reports that inspectors target larger plants (based on production value), plants with higher environmental impacts, and high-risk sectors, e.g., petrochemicals, chemicals, and metal processing.
There is no prior evidence on the impact of monitoring and enforcement in improving the environmental performance of major polluters by reducing their self-reported pollutant emissions. Dasgupta et al. (Reference Dasgupta, Hettige and Wheeler2000) use survey data from 1995 from 236 major facilities in Mexico to provide some of the first evidence on self-assessed environmental compliance. Blackman et al. (Reference Blackman, Lahiri, Pizer, Rivera Planter and Muñoz Piña2010) find that voluntary mechanisms such as obtaining Clean Industry Certificates have limited effectiveness in improving long-term environmental compliance. The authors point out that plants seek out audits to obtain these environmental certificates primarily to access the benefits of two years of inspection relief and a reputation as environmental stewards in Mexican manufacturing. We interpret this as evidence of the burden of fines imposed and that polluters in Mexico largely operate under cost-minimizing principles. Anecdotal evidence mentions that one of the other advantages of obtaining a clean industry certificate is that fines imposed by the agency can be partially reduced or avoided completely if the plant commits to fulfilling its environmental management obligations under the audited program.Footnote 5
Community characteristics are significant determinants of compliance behavior for major polluters, even in developed country settings (Earnhart, Reference Earnhart2004). On the other hand, community characteristics are generally not significant determinants of inspections and enforcement actions (Shimshack and Ward, Reference Shimshack and Ward2005). Gray and Shadbegian (Reference Gray and Shadbegian2004) include the environmental preferences of state-level constituents in their inspection and enforcement models and plant-level pollution models. Palacios and Chávez (Reference Palacios and Chávez2005) find that areas in Santiago, Chile with higher population density have a lower probability of compliance, while areas with higher income witness higher compliance. Escobar and Chávez (Reference Escobar and Chávez2013) find greater inspection efforts in poorer and denser municipalities in Mexico City. Recent evidence on plants polluting more in more marginalized communities across Mexico comes from Chakraborti and Shimshack (Reference Chakraborti and Shimshack2022). The authors use detailed socioeconomic data to show that plant-level pollution increases by 15–40 per cent as 1 km areas surrounding each plant become more marginalized. For our present purposes, we utilize aggregate municipality-level census data in the regulatory activities and pollution reporting models.
3. Data
We obtained data on inspections and fines for all industries and businesses in Mexico from 2000 onwards. To include variables on formal regulatory actions, such as inspections and fines, we had to manually match the plants in the annual inspections and fines database with the plants in the annual pollution database. Based on industry names, addresses, and other locational information, only about a third of our plants with pollution reports faced any formal inspections or fines over the entire period. We assume that toxics-reporting plants not appearing in the inspections and fines database did not face any inspections or fines by the regulators.
3.1 PROFEPA data
In June 2004, Mexico adopted mandatory reporting, under federal jurisdiction, for major polluters that discharge toxics into the nation's waters. Major polluters are those that discharge more than a certain level of toxic pollutants. PROFEPA (Procuraduría Federal de Protección al Ambiente) is the agency responsible for the inspection of all major facilities subject to Mexico's General Law of Ecological Equilibrium and Environmental Protection (Ley General de Equilibrio Ecológico y Protección al Ambiente). Regulatory capacity is weak due to a lack of coordination between semi-autonomous agencies such as PROFEPA and the Ministry of the Environment (Challenger et al., Reference Challenger, Cordova, Lazos Chavero, Equihua and Maass2018).
Unlike the monitoring protocol of environmental protection agencies in developed countries, the role of inspection and enforcement in Mexico is much more limited. Rather than taking samples of actual emissions, inspections are ‘limited to surveillance of the aspects that are regulated’ (Alvarez-Larrauri and Fogel, Reference Alvarez-Larrauri and Fogel2008: 5). Inspectors check the documentation on permits (whether they are current, and payments made) and measurement records dating back three years (whether samples were sent to accredited labs for measurement and recorded). State regulators conduct monitoring and enforcement activities under federal oversight and supervision (PROFEPA, 2016).
Inspection protocols for manufacturing facilities fall under six programs: high-risk activities; toxic waste management; environmental impact; land; air (fixed sources); and water pollution. Each plant is subject to specific regulations, depending on its activity. During the visit to the plant, the inspector checks records that support the plant's compliance with all the applicable environmental norms. For water and other polluting activities, inspectors usually verify that an accredited lab has measured the discharges and permits are valid. For air emissions, inspectors also engage in visual inspection of equipment and perhaps operation (PROFEPA, 2013). The outcome of the visit can be: no irregularities; minor irregularities; urgent measures to be taken; priority attention; or temporary (partial or total) closure of the plant. For the empirical models, we define significant non-compliance status as any of the last three outcomes above. The various actions under final resolution are the closure of administrative records with no measures required, agreement to undertake measures to achieve compliance, and fines.
Regulators focus on all polluters under federal jurisdiction based on environmental impacts, prior record of compliance with the environmental legislation, and toxic residuals. Typically, inspectors target larger manufacturing facilities in the high-risk sectors for annual visits, but a facility may be visited more than once in the same year. Initial visits can be for regular monitoring or due to an emergency or citizen complaints. Initial visits are followed up by verification visits, after the completion of which firms are obligated by law to take measures to achieve compliance; or sanctions in the form of fines are imposed as a resolution to administrative actions. Camacho (Reference Camacho García2016) finds that verification visits are for priority violations that were outcomes from the previous or initial visit.
We obtained detailed data on plant name, address, type of facility, inspections program, type of inspection, the visit outcome, final resolution, and fines imposed through a Transparency request. We examined inspections and data on fines from 2000 to 2016. The toxic waste or residuals program registered the most inspection activities, with 51 per cent of the visits between 2000 and 2016. High-risk activities comprised 10 per cent of all visits, land contamination and air emissions 9 per cent each, biological residuals 8 per cent, and environmental impact 5 per cent were the other major industrial inspections programs.
On average, PROFEPA conducted about 7,000 annual visits: 57 per cent were for regular monitoring; the remaining initial visits were 7 per cent due to citizen complaints, and 4 per cent emergencies; and 32 per cent were follow-up verification visits.Footnote 6 Of the total inspection visits, plants were fined about 30 per cent of the time every year. From the data, plants can be fined more than once within a year for violations under different inspection programs, and the amount of fines might be identical under all programs. The fines data exhibit extreme skewness; only a few plants faced significant penalties.
3.2 RETC data
The self-reported pollution database on toxic pollution, called the Pollutant Release and Transfer Registry (Registro de Emisiones y Transferencias de Contaminantes, or RETC), is available from the Ministry of Environment in Mexico (Secretaria de Medio Ambiente y Recursos Naturales, or SEMARNAT). The database is updated annually with a couple of years lag. It contains information on all polluters that are under federal jurisdiction and pollute into national waters. Based on the frequency of different pollutants and media reports, we focused on seven toxic materials discharged into water. This covers major toxic polluters under eleven industrial sectors. Major polluters are defined as plants discharging 1 kg of arsenic, cadmium, chromium, lead, mercury, and nickel, annually (and more than 100 kg of cyanide).
Since mandatory reporting began, the sample of plants reporting toxic pollution has varied remarkably from one year to the next. We accessed the database in 2017, with data up to 2015. We included direct discharges and indirect discharges through sewage, as this enters water bodies without treatment or recycling (CEC, 2011).
We undertook manual consolidation of the annual databases to create a facility-level panel. Each physical plant or business that changed names, ownership, or sector, was assigned a new identifier in the RETC database. The physical location of each plant had to be verified using geo-location tools. Table 1 shows that most of these polluters belonged to the chemicals industry (27 per cent), followed by metal processing (16 per cent) and the automotive sectors (10 per cent). As expected, these plants are mostly located in states with large industrial hubs, such as the State of Mexico (17 per cent), Tamaulipas (11 per cent), Nuevo Leon (10 per cent), Mexico City (8 per cent), and Jalisco (7 per cent).
Table 1. Top ten industries and states included in the RETC sample
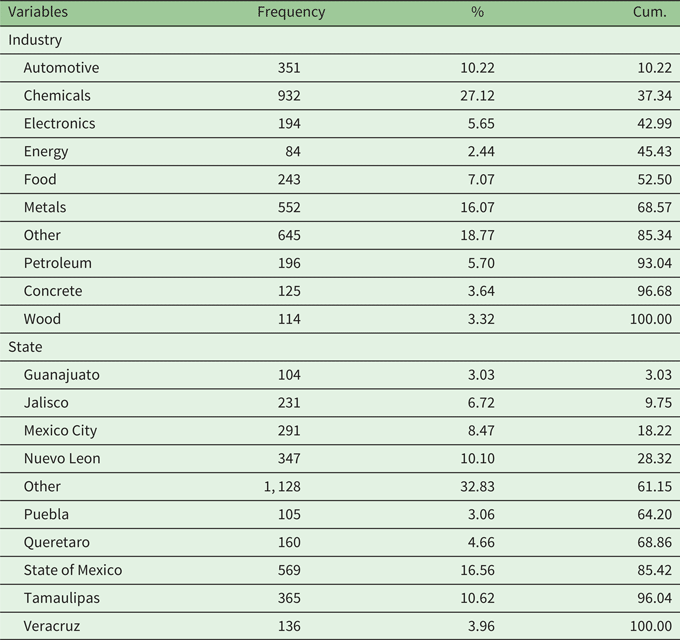
Notes: The sample comprises 3,436 facilities that report at least one of the seven toxic pollutants over 2004–2015. The share of polluters from different industrial sectors and across the various states are reported.
3.3 Sociodemographic controls
The socioeconomic and demographic variables are from two censuses (2000 and 2010) and one conteo (2005)Footnote 7 since our pollution data are from 2004 to 2015. We chose 11 census variables to incorporate indicators of education, health, and housing conditions (see table 2). We also include population density as a control for the population exposed to local pollution. We assigned municipality-level socioeconomic data to each plant. We include lagged rather than contemporaneous values for socioeconomic features to avoid reverse causality of pollution influencing taste-based residential sorting. We created three bins of four years of pollution to divide up the 12 years of data evenly.
Table 2. Summary statistics
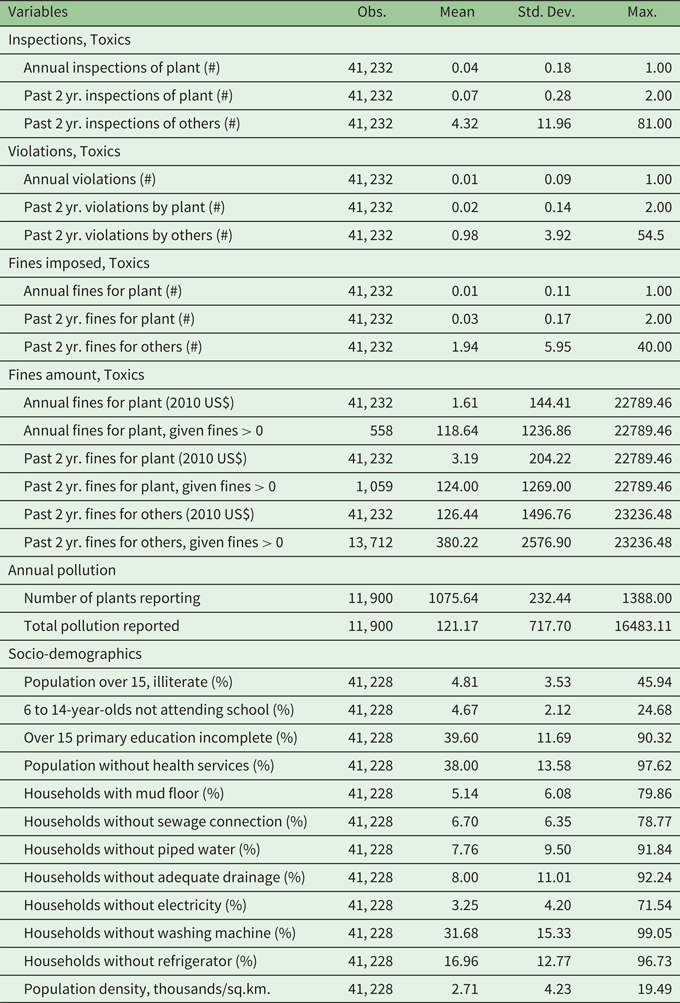
Notes: The summary statistics are for 3,436 facilities across Mexico. Total pollution is the sum of arsenic, cadmium, chromium, cyanide, lead, mercury and nickel releases into water.
3.4 Summary statistics
Our final sample was a panel of 3,436 toxic-releasing plants, over 2004–2015, with data on inspections at each plant under various monitoring programs, the outcome of the visit (i.e., priority violations detected, initial or follow-up visit), and the amount of fines. We present all descriptive statistics for regulatory actions based on toxics-inspection programs and all other programs grouped as non-toxics.Footnote 8 Table 2 presents the plant-level summary statistics on regulatory actions for the toxics-inspections program. On average, a plant was inspected 0.04 times annually. Priority violations were detected only 0.01 times, on average. A plant faced a financial penalty 0.01 times per year, on average. As regards the amount of fines, on average, a plant faced fines of US$119 in real terms, annually.
Table 2 also presents the relevant statistics for the other regulatory activities used in the estimations, namely lagged inspections, lagged fines counts, and lagged amount of fines, for the plant itself and others in the same municipality. We consider a lag length of two years, as regulatory processes often spilled across years. On average, over the past two years, a plant was inspected 0.07 times, priority violations were detected 0.02 times, and fines imposed 0.03 times, with an average fine of US$124. For general deterrence measures, the average number of inspections of all other plants in the same municipality was 4.32, the average number of priority violations detected was 0.98, the average number of fines was 1.94, and the average amount of fines was US$380.
Next, we present the summary statistics for annual toxic pollution. On average, the number of plants reporting water pollution for at least one of the seven toxic pollutants was around 1,075 facilities per year. However, the panel was unbalanced, exhibiting considerable variation over the years covered. The number of facilities reporting peaked at 1,388 facilities with water pollution reports in 2006. We consider pollution summed over the seven pollutants to calculate total water releases (considered in Helland and Whitford (Reference Helland and Whitford2003)). We preprocessed the data with 0.5 per cent trimming (adopted widely in studies with toxics pollution data, e.g., in Chakraborti and Shimshack (Reference Chakraborti and Shimshack2022)). In the raw data, the maximum value for each of the seven pollutants was 40 to 80 standard deviations greater than the mean. The bottom panel of table 2 summarizes the average toxic water pollution discharges across facilities. Among facilities reporting discharges, mean total discharges of arsenic, cadmium, chromium, cyanide, lead, mercury, and nickel was 121 kg per year. The pollution data exhibit considerable variability across facilities with maximum total pollution reported at 16,483 kg per year.
Finally, we report the summary statistics for the socioeconomic controls. The average plant is in a community with a low share of population over 15 who are illiterate (5 per cent), a low proportion of 6 to 14-year-olds not attending school (5 per cent), a much higher share of over 15 year-olds with incomplete primary education (40 per cent), a high share of population without health services (38 per cent), a low share of households with mud floors (5 per cent), a low share of households without a sewage connection (7 per cent), a low share of households without piped water (8 per cent), a low share of households without adequate drainage (8 per cent), a much smaller share of households without electricity (3 per cent), a much higher share of households without a washing machine (32 per cent), a modest share of households without a refrigerator (17 per cent), and an average population density of 2,712 people per square km. Since our sample is from urban municipalities, the average population density is closer to the population density for metropolitan areas rather than the entire country.
4. Empirical strategy
In this section, we test some hypotheses on environmental regulation in Mexico. Our conclusions derive from the results of the regulatory action models and the self-reported pollution models. First, we empirically model the determinants of inspections and enforcement actions such as fines implemented by the regulatory agency, PROFEPA. Second, we model the impact of regulatory activities on annual reporting of seven toxic substances by major polluters in Mexico. To address sample selection, we first estimate reporting models that explain what factors induce polluters to file annual toxics reports. Conditional on reporting, the pollution models explain the factors that induce polluters to change their toxics pollution levels. For deterrence effects of the regulation, factors that induce polluters to reduce toxics reported are of particular interest.
4.1 PROFEPA inspections and fines
From prior evidence, we know that inspectors typically target high risk, toxics-generating industries, e.g., the chemical industry and those that have potential environment (health) impacts on the population. We estimate linear probability models for both inspections and fines under the toxics monitoring program. Plant fixed effects allow us to control for idiosyncratic targeting of plants by inspectors based on the type of manufacturing activity or size of the operation, i.e., larger plants are inspected more frequently. Equation (1) presents the empirical specification for the regulatory activity models,

We estimate three separate models: annual inspections, annual fines, and annual amount of fines. For the inspections model, the dependent variable, $Ins{p_{it}}$ , is toxic inspections at plant i and year t, a 0/1 binary variable. It takes a value of 1 if the plant is inspected under the toxics program during a year and 0 if the plant did not witness any toxics inspection visit in that year. For the fines model, the dependent variable $Fin{e_{it}}$
 is a 0/1 binary outcome that takes the value 1 if plant i receives a fine following an inspection under the toxics monitoring program in year t and 0 if plant i does not receive a fine in year t. For the amount fines model, the dependent variable is the log of the monetary fine imposed under the toxics monitoring program for plant i and year t with $Fin{e_{it}} > 0$
 .
.
Lagged inspections and fines faced by the plant are captured by ${R_{it^{\prime}}}$ in equation (1). We control plant-specific targeting that may vary over time by including regulatory actions faced by the plant over the past two years, $t^{\prime} = \{{t - 1,\; t - 2} \}$
 , such as the total number of inspections, total number of priority violations as the outcome of inspections, sum of total fines imposed. We consider both priority violations and fines as some priority violations detected could be resolved with polluters and regulators agreeing on a more stringent environmental management program. ${R_{it^{\prime}}}$
 includes lagged inspections conducted at plant i, lagged priority violations as an outcome of the inspection visit at plant i, and log of lagged amount of fines at plant i. We then sum over the past two years. Consequently, identification comes from time variation in plant-specific targeting.
We consider regulatory actions under the toxics-inspection program and all other non-toxics inspection programs separately. In our sample, 30 per cent of the plants were inspected for toxics and non-toxics programs simultaneously. Of these, 30 per cent were fined for both toxics and non-toxics in the same year. Of these, close to 50 per cent were fined identical amounts for toxics and non-toxics during the same year.
To control municipality-level variations due to changes in budget or political situation, we include the total number of inspections and fines imposed on all other plants reporting to the RETC in the same municipality. In equation (1), ${R_{ - it^{\prime}}}$ includes the number of toxics inspections for all other major polluters in the same municipality and the log of the amount of fines under the toxics program for all other plants in the same municipality. We then sum over the past two years to calculate our measures of general regulatory activities. We focus on toxics inspections to capture general regulatory pressure to avoid multicollinearity problems, as an increased budget is likely to increase all types of inspections.
In equation (1), ${\mathrm{{\rm X}}_{it}}$ is the vector of 12 lagged socioeconomic, demographic variables, including population density of the municipality for plant i, and is drawn from the census years 2000 and 2010, and conteo year 2005. We include year fixed effects to control for all annual changes in regulatory activities that are not specific to the plant or the municipality.Footnote 9 Finally, we cluster standard errors at the state level to control for arbitrary correlation across plants in the same state.
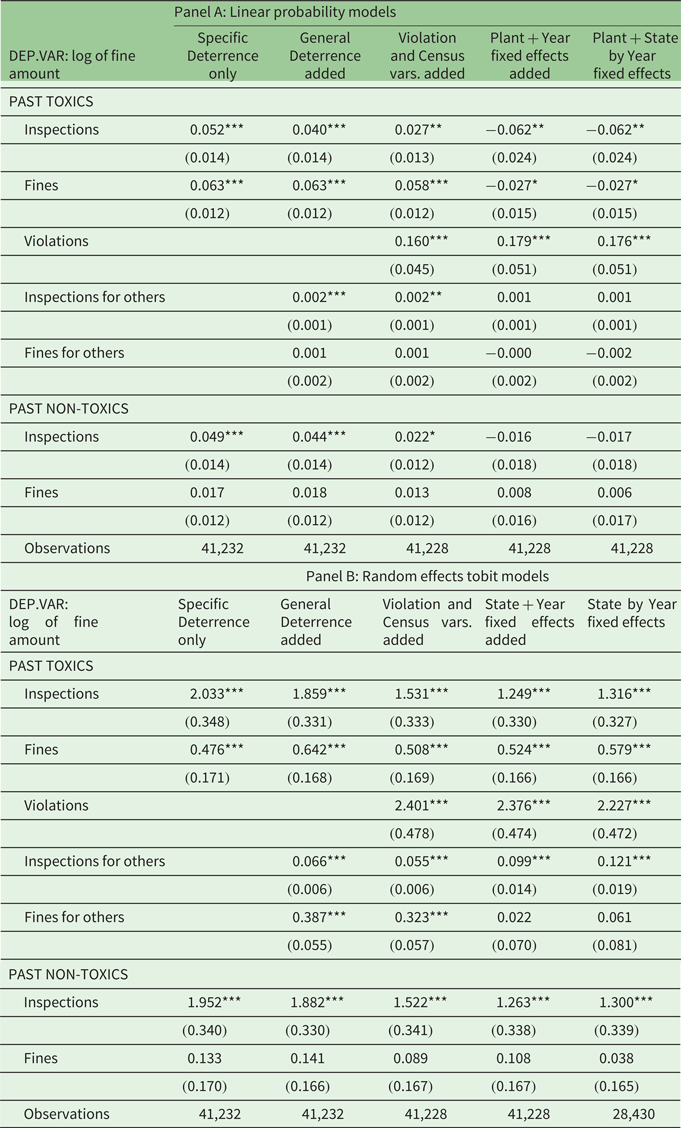
First, we model annual visits by PROFEPA inspectors under the toxic-residuals inspection program at each plant in our sample. Panel A of table 3 presents the results of the linear probability inspection models and panel B shows probit estimations excluding controls for plant-specific effects.Footnote 10 The coefficients presented in panel B are the marginal effects calculated at mean values. In general, we find that an additional priority violation or an additional fine increases the probability of being inspected. For the linear probability models, results show that an additional priority violation, under the toxics program, increases the probability of receiving an inspection visit in the current year by around seven percentage points (last column of table 3, panel A). An additional fine imposed under the toxics program increases the probability of receiving an inspection visit in the current year by three percentage points. We interpret this result as evidence of targeting by regulators based on significant violations detected or actual fines imposed. Similar conclusions emerge from the random effects probit results, although the coefficients are smaller in magnitude (table 3, panel B).
Table 3. Inspections results
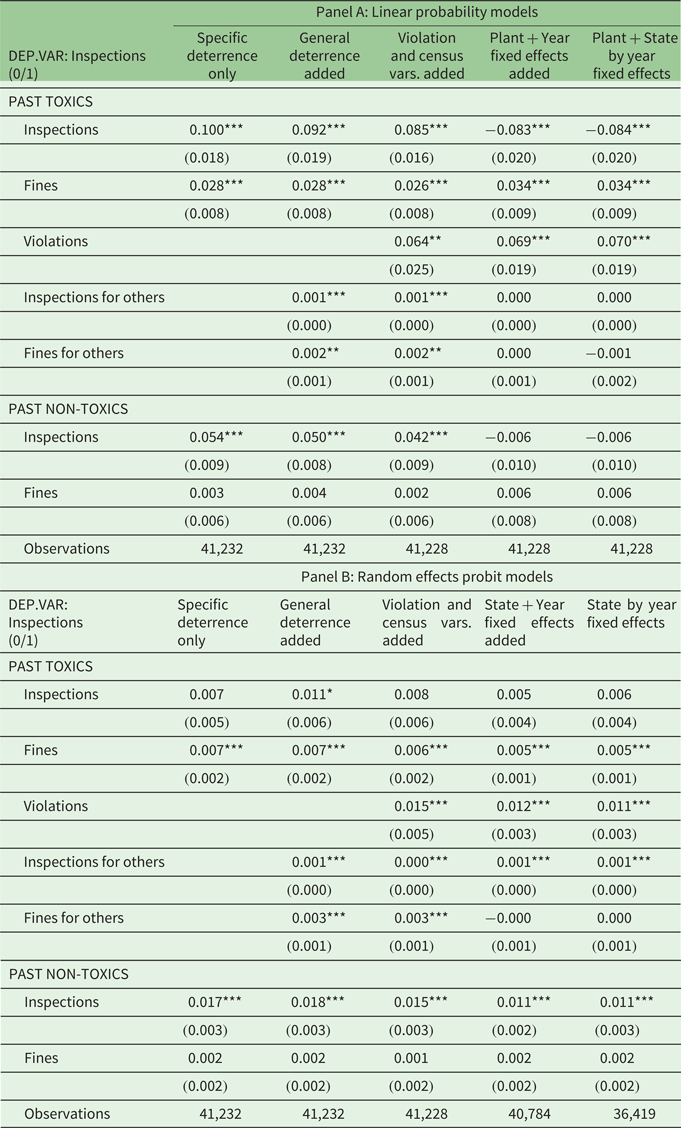
Notes: Standard errors in parentheses; *** p < 0.01, ** p < 0.05, * p < 0.1. The number of observations vary in the probit estimations due to lack of variation in toxic inspections within states or within state-by-year combinations.
In terms of general regulatory activities aimed at all other facilities in the same municipality, the total number of past inspections for others is significant in determining current inspections, but only in the absence of plant fixed effects (panel B). Increased inspections for the plant under both toxics and non-toxics programs (panel B of table 3) switches sign to negative upon including plant fixed effects (panel A). Hence, we only find robust evidence for plant-specific targeting based on past non-compliance status (priority violations) and fines imposed under the toxic inspection program.
For the fines models (0/1), we present linear probability results in panel A of table 4 and marginal effects calculated at mean values in panel B. Like the inspection models, an additional significant violation for toxics inspections increases the probability of current monetary fines imposed by five percentage points (panel A of table 4). Again, the random effects probit coefficients in panel B are smaller in magnitude. Unlike the inspection results, past fines under the toxics program are not significant predictors of current fines, upon including plant fixed effects (panel A of table 4). Similarly, past inspections under either toxics or non-toxics programs switch signs upon including plant fixed effects (last two columns of panel A in table 4). Regarding the general regulatory measures, like the inspection models, increased toxics inspections for all other facilities in the same municipality increase the probability of being fined in the models without plant fixed effects (comparing the last two columns of panel A in table 4 with the results in panel B). Hence, we find robust evidence of past significant violations being followed up with current fines.
Table 4. Fines results
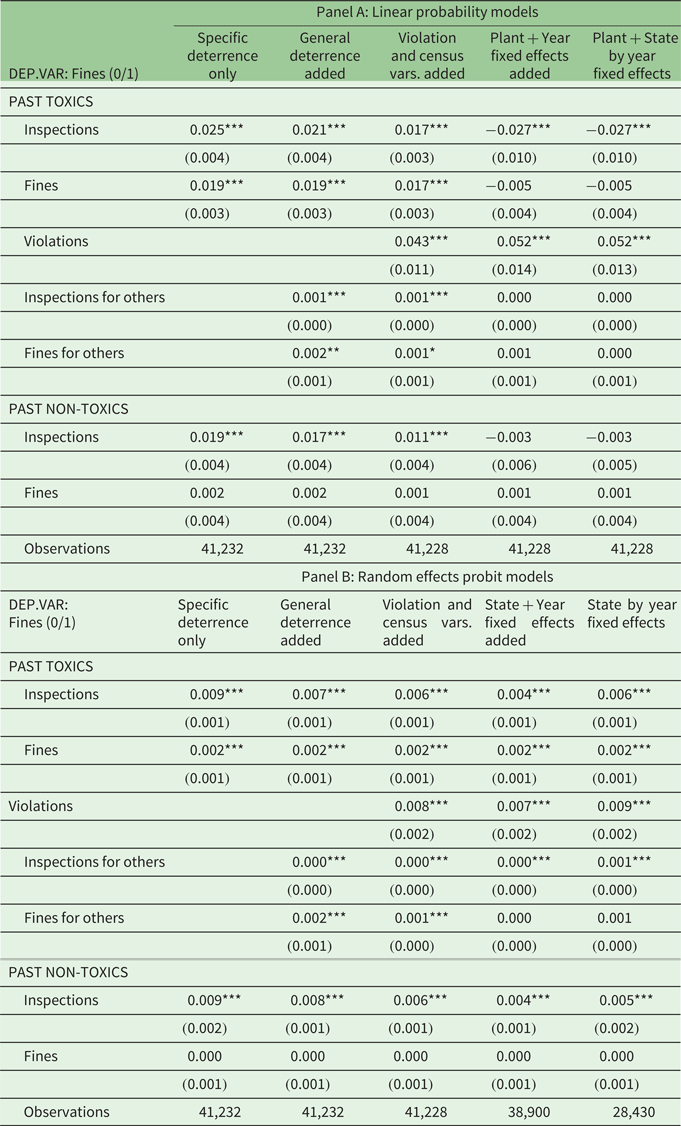
Notes: Standard errors in parentheses; ***p < 0.01, ** p < 0.05, * p < 0.1. The number of observations vary in the probit estimations due to lack of variation in toxic fines within states or within state-by-year combinations.
In table 5, we present the results of the amount of fines models. In panel A, we present linear estimation results with plant fixed effects and in panel B we present random effects tobit models censored at zero fines. Like the binary fines models, past significant violations under the toxics program increase the amount of fines. An additional priority violation results in a higher amount of fines by almost 18 per cent (panel A of table 5). The coefficients in the tobit estimations are higher in magnitude by more than 10 times (panel B of table 5), indicating that the plant fixed effects models might yield conservative estimates. Like the binary fines models, the coefficients for past toxics and non-toxics inspections and fines switch sign to negative upon including plant fixed effects (compare panel A of table 5 to panel B results). Similarly, the coefficient on toxics inspections for all other plants in the same municipality are no longer significant upon inclusion of plant fixed effects (see last two columns of panel A of table 5).
Table 5. Fines amount results
Notes: Standard errors in parentheses; *** p < 0.01, ** p < 0.05, * p < 0.1. The number of observations vary in the probit estimations due to lack of variation in toxic fines within states or within state-by-year combinations.
Overall, we infer that environmental regulation in Mexico is broadly consistent with the compliance history of the individual polluter, as an additional priority violation under the toxics monitoring program results in a higher probability of current inspections, fines, and amount of fines. Enforcement actions such as past monetary fines under the toxics monitoring program only predict increased targeting through higher current inspections.Footnote 11
4.2 Environmental deterrence of monitoring and enforcement
In this section, we investigate whether regulatory actions, as captured by PROFEPA's monitoring and enforcement activities such as fines imposed, have any environmental deterrence impact. We test the impact of monetary sanctions and inspections conducted on the plant itself and others in the same municipality on self-reported levels of toxic pollution. We estimate a Heckman selection model to incorporate the regulatory pressure of increased fines and violations due to non-compliance with reporting protocols such as maintaining annual records of pollution. We hypothesize that regulatory pressure incentivizes polluters to report toxic water releases.
Following the literature, we include measures of specific and general deterrence, i.e., regulatory activities directed specifically at a plant as well as regulatory activities directed at all other major polluters in the same municipality. Past studies on developing countries find stronger evidence of a deterrence impact from general regulatory activities, e.g., visible actions such as plant closure, in contrast to specific activities taken against a plant. In the Mexican context, we are particularly interested in enforcement spillovers such as higher incidence of fines imposed on all other major polluters in the same municipality. We investigate whether general regulator reputation effects induce plants to adopt proactive environmental actions that lead to reductions in their toxic emissions. By contrast, the incidence of fines imposed against a specific plant is scarce in the sample.
Equation (2) below presents the panel data model for toxics releases. We sum the seven toxic substances released into water for each year. For facility i in year t, we regress the log of toxic pollutants discharged into the water on a set of regulatory activity variables and socioeconomic and other controls that can influence pollution levels. In equation (2), ${R_{it^{\prime}}}$ includes the total number of inspections of the plant, total number of violations as an outcome of inspections at the plant, the log of the sum of monetary fines imposed on the plant, and an interaction of violations and fines imposed; ${R_{ - it^{\prime}}}$
 includes the total number of inspections for other plants in the same municipality and the log of the total amount of fines for the other plants in the same municipality. As in the inspections and fines models, we consider a lag length of the past two years for the variables capturing regulatory activities. Plant fixed effects ${\alpha _i}$
 capture all time-invariant plant-specific (e.g., size, age, type of industrial facility) and location-specific factors (e.g., political jurisdiction, state, distance to large metropolitan cities). Lagged socioeconomic variables ${X_{it}}$
 capture any differences in plant-level pollution based on community characteristics. Year fixed effects control for annual changes in toxics releases not specific to a plant.


where toxic releases are observed, i.e., $to{x_{it}} > 0$ if
if


Equation (3) presents the selection model. Our hypothesis is that a facility's decision to report toxics releases is non-random as it might be influenced by regulatory pressure such as past monitoring and enforcement actions of the plant and for others in the same municipality. If $\rho \ne 0$ , then linear toxics release models yield biased estimates of the impact of specific and general regulatory activities on toxics releases by plants in our sample. We are unable to include plant fixed effects in the selection models as these are probit estimations of the probability that a plant reports the release of toxic pollutants. However, we include state and year fixed effects to control for state-level differences in reporting and trends in reporting over time.
As a robustness check, we estimate an alternate specification, with state-by-year interactions, in both the pollution and selection models. In these models, we control for time-varying factors at the state level such as changes in budget, changes in regulatory stringency, environmental attitudes, or changes in the economy.
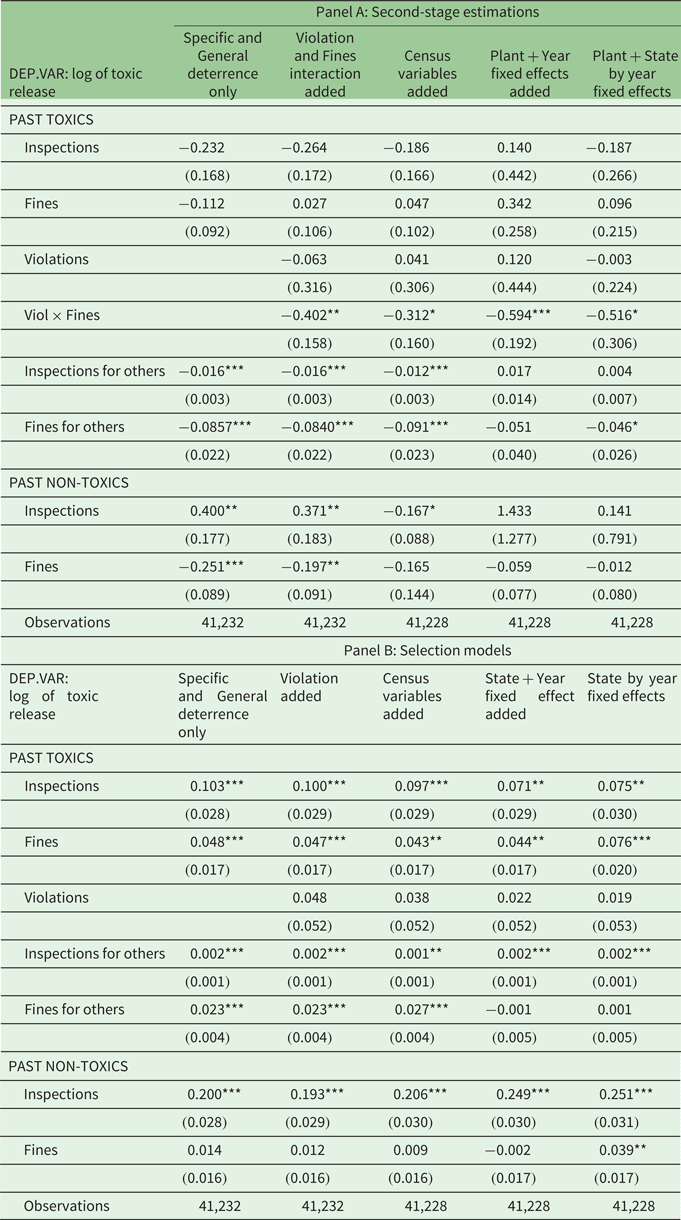
Table 6, panel A presents the second-stage estimations of the log of toxic pollutant releases into water for each plant in our sample. Panel B presents the selection models. Plants are more likely to report pollution if they are either inspected or fined more in the past. Increased municipal inspections not targeted at the specific plant also induce self-reporting of pollution. We conclude effectiveness of toxics reporting regulation and regulator reputation effects.
Table 6. Toxics pollution releases results
Notes: Standard errors in parentheses; *** p < 0.01, ** p < 0.05, * p < 0.1.
Conditional on reporting, the pollution models highlight the deterrence effect of targeting through violations detected and fines imposed on the plant itself. This is seen in the negative coefficient on the interaction between violations and fines imposed. Overall, we find direct statistical evidence on the deterrence effect of regulations through violations detected and fines imposed. We hypothesize that the interaction term between violations and fines imposed on each plant is the primary mechanism for establishing evidence on the deterrence effect of the regulation. Coefficients reported in panel A of table 6 show that the effect of fines imposed on polluters with priority violations detected is to reduce toxic pollution by as much as 52 per cent (last column). The result remains valid through various specifications. We find evidence that the regulation implemented through priority violations detected and fine imposed result in a significant reduction in toxic pollution by the plant. This result is economically meaningful as evidence on the deterrence effect of regulatory activities in particular recorded violations and fines.
The general regulator reputation effect is found in the negative coefficient on higher fines imposed on all other major plants in the same municipality. The coefficient in the last column of panel A of table 6 shows that a 1 per cent increase in the amount of fines for other major facilities in the same municipality leads to a reduction in toxics discharges by almost 0.05 per cent per year. The magnitudes are consistent with our expectations as these actions are not targeted at specific plants.Footnote 12
For the selection models, past fines induce plants to report releases of toxics (panel B of table 6). Similarly, past inspections under both non-toxics and toxics programs induce plants to report positive toxics releases. Increased inspections for others also induce plants to report positive toxics releases. We conclude positive evidence for the effectiveness of the regulatory actions in promoting self-reporting of toxic pollution. This means that more plants are induced to comply with their reporting protocols, such as annual measurement frequency, by taking samples and sending them to the authorized labs.
5. Discussion and conclusion
In this paper, we find specific mechanisms through which environmental regulation in Mexico is effective despite being limited in scope and function. We provide long-term evidence on toxics releases into water using a large sample of 3,436 major facilities in Mexico.
We find positive evidence of regulators targeting those with a prior history of significant non-compliance. An additional priority violation under the toxic inspection program increases the probability of being inspected by seven percentage points. We find similar evidence for fines imposed under the toxic inspection program. An additional fine raises the probability of current inspections by three percentage points. An additional priority violation under the toxic inspection program increases the probability of being fined by five percentage points. The amount of fines also increases upon detection of a priority violation under the toxic inspection program. An additional priority violation results in an increase in the amount of fines by 18 per cent. By contrast, general deterrence variables are less significant in inspections and fines models.
We find robust evidence of the deterrence effect of the regulation. We address potential sample selection bias arising due to non-randomness in pollution reporting decisions. A plant with a priority violation detected and fined, induces a decline in toxics releases by as much as 52 per cent. We find some evidence of the general regulator reputation effect. The plant fixed effects results show that a 1 per cent increase in the amount other facilities are fined in the same municipality results in a reduction in annual discharges of toxics by 0.1 per cent, on average. We conclude that both general and specific regulatory pressure might be effective in inducing improvements in environmental performance by reducing toxics releases into water. Similarly, we find that self-reporting is more likely when there are more inspections and fines imposed on the facility and when there are more inspections on other major polluters in the same municipality.
We provide comprehensive evidence of the effectiveness of regulatory actions in Mexico despite widespread concerns about regulatory capture. We speculate the following channels through which regulatory pressure leads to reductions in environmental releases of toxics. In a developing country context, mechanisms such as public image and voluntary environmental initiatives might be important in determining reductions in toxics releases. For example, in Mexico, the imposition of fines by PROFEPA is widely publicized in the news media. The other channel is regulator reputation effects when plants respond to increased sanctions on other polluters in the same jurisdiction. Our findings are parallel to evidence from other developing countries that more visible deterrence effects such as widely publicized fines are crucial drivers of improving toxics releases of major polluters.
Supplementary material
The supplementary material for this article can be found at https://doi.org/10.1017/S1355770X22000055
Acknowledgements
This work was supported by Mexico's National Council of Science and Technology CONACYT [grant # PNDCPN 2014-01/248906]. I thank Journal Co-Editor Eswaran Somanathan, an Associate Editor, and two anonymous reviewers; and Jay Shimshack, Hernan Bejarano, and participants at the 92nd WEAI Conference, June 26th, 2017, San Diego, for generous comments.


 Open access