


The SARS-CoV-2 virus has significantly impacted global populations. As the COVID-19 outbreak evolved into a pandemic by March 2020, the world, specifically the US, grappled with how to prevent this disease from spreading worldwide.Reference Bergquist, Otten and Sarich1 Since then, a massive surge of research and evaluation has been done to understand how the pandemic could have been handled better.Reference Adami and Ries2, Reference Amicosante, Rosso and Bernardini3 Evaluation is crucial for improving public health across the globe. Providing evidence on factors that contributed to the spread and control of the pandemic can inform decision-makers of more evidence-based decisions in the future.
Time-varying reproduction number (Rt) is a version of the reproduction number metric that epidemiologists use to evaluate the transmission potential of infectious diseases in the presence of interventions. The reproduction number is the average number of secondary infections generated by 1 infectious person. Rt represents the reproduction number at a given time (t) in the presence of population immunity, behavioral changes, or public health interventions. The Rt value provides insight into how pathogens spread throughout a population during an outbreak.Reference Cori, Ferguson and Fraser4 Specifically, Rt can be used to assess how effective a public health intervention is in controlling the spread of an infectious disease. Using the renewal equation and the generation time of the disease (proxied by serial interval), the Rt value can be estimated as it changes over time.Reference Cori, Ferguson and Fraser4
West Virginia is located in the southeastern United States, in the heart of the Appalachian region. Although this region is known for its coal mining and other industrial projects, it is also geographically close to Washington D.C., Pittsburgh, PA, and Cleveland, OH. The capital of West Virginia, Charleston, hosts a sizeable metropolitan population that acts as an urban hub for various businesses, residents, and government buildings. The diversity found across the state, from rural to urban areas, makes West Virginia a cultural hub where differing views on how the pandemic should be handled intersect.
The purpose of this study is threefold. Firstly, we estimated the transmission potential of COVID-19 as the 7-day sliding window Rt from March 10, 2020-February 28, 2023. Secondly, we evaluated the impact of 5 policy changes in 2020 on Rt values in West Virginia and its 9 regions. Thirdly, we compared the case burden of each region in 2020, 2021, and 2022 by estimating the incidence rate ratio (IRR) through Poisson regression using the statewide case rate as the reference group.
Methods
Aggregated daily cumulative count data for West Virginia and its counties were downloaded from the COVID-19 Data Repository by the Center for Systems Science and Engineering (CSSE) at Johns Hopkins University.5 The time series covered the period from January 22, 2020-March 9, 2023, by the date of report. CSSE stopped retrieving case count data on March 10, 2023. In this study, the incident case count data were shifted backward by 9 days to approximate the date of infection before Rt estimation (see below), with the time series ranging from January 13, 2020-February 28, 2023. The first reported case in West Virginia was recorded on March 19, 2020, with an estimated date of infection of March 10, 2020. We estimated the 7-day sliding window Rt from March 10, 2020-February 28, 2023. For the policy change Rt with non-overlapping time windows, we limited our analysis to the year 2020 (the time series of March 10, 2020, to December 31, 2020, by the estimated date of infection). We chose to limit policy change Rt analysis to 2020 because this method did not capture the gradual change in population immunity or the vaccine campaign rollout. The official vaccine rollout in West Virginia began on December 14, 2020.6
Unit of Analysis (Regions in West Virginia)
For our analysis, we divided the state of West Virginia into 9 distinct regions: Metro-Charleston, Clarksburg, Eastern, Western, Northern, Southern, Martinsburg, Morgantown, Wood-Jackson (Figure 1). We used the U.S. Census Bureau-defined Metropolitan Statistical Areas as a starting point for grouping counties into regions.7 Factors considered included county populations, West Virginia’s major highways, and the potential to commute to highly populated US cities. After rounds of deliberation between AAB, XH, JS, and ICHF, the team settled on the current grouping of counties into 9 regions. It is important to note that the 2 counties of Wood and Jackson were grouped into a stand-alone Wood-Jackson region because of the 3 populated towns in Wood County and the populations that live there.
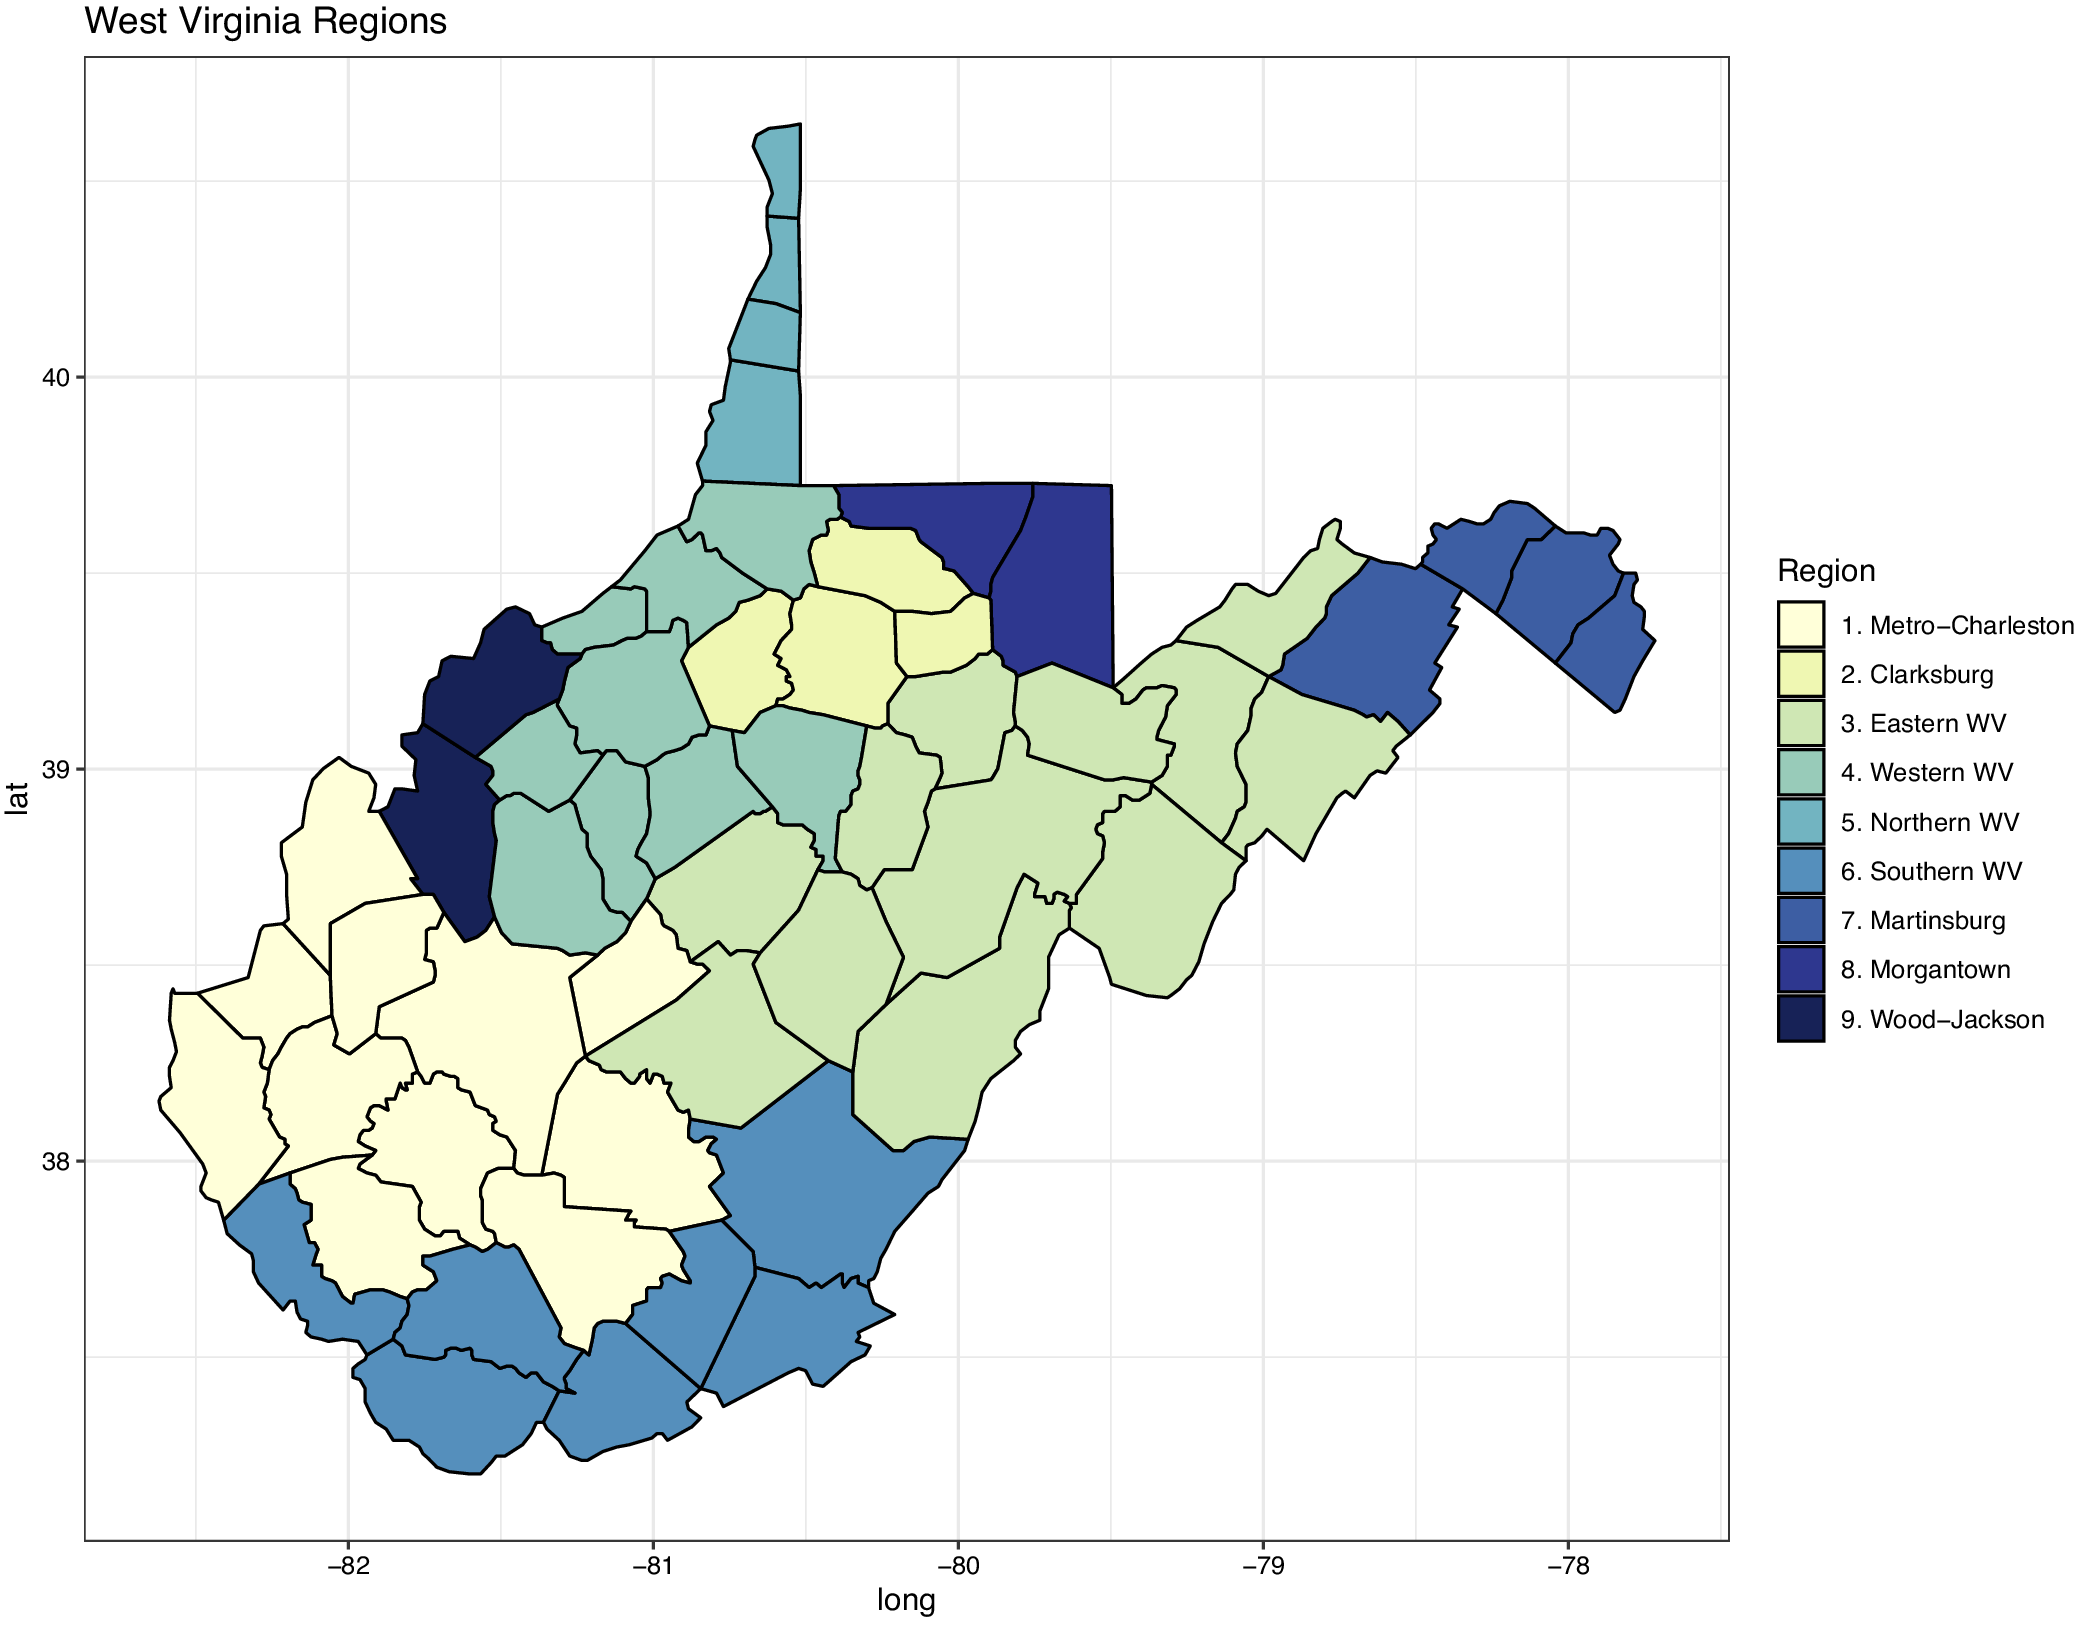
Figure 1. A map of West Virginia. Counties are grouped into 9 regions for analysis in this study. These regions are: (A) Metro-Charleston, (B) Clarksburg, (C) Eastern, (D) Western, (E) Northern, (F) Southern, (G) Martinsburg, (H) Morgantown, and (I) Wood-Jackson.
R t Estimation
The time-varying reproduction number, Rt, served as an indicator of the transmission potential of the virus at a given time t. A Rt value >1 means the epidemic is growing, while a Rt value <1 means the epidemic is declining. To approximate the time of infection and adjust for the mean incubation period of 6 days and the median lag from testing to report of 3 days, the time series of incidence cases was shifted backward by 9 days.8 During the data cleaning, negative case counts were replaced with a 3-day average from before and after the negative case count date. Nonparametric bootstrapping of the incident case count data with a rolling 15-day window (±7 days) was performed to account for irregular reporting in the data. A Poisson-distributed multiplier (mean = 4) was applied to estimate infection count accounting for underreporting of asymptomatic and mildly symptomatic infections.9
7-Day-Sliding-Window R t
To give an overview of how transmission potential changes over time, we estimated Rt from the estimated daily incident infection count by the estimated date of infection, March 10, 2020-February 28, 2023, using a 7-day sliding window. EpiEstim takes an average of the daily Rt estimates over a rolling 7-day period and therefore smooths the Rt curve.Reference Cori, Ferguson and Fraser4 Rt was estimated over time for the state and each of the 9 regions.
Policy Change R t
To estimate the percentage difference in Rt from first policy change to fifth policy change (“Policy change Rt”), the estimated daily incident infection counts from March 10, 2020-December 31, 2020 (estimated date of infection) were analyzed. Six non-overlapping time windows were defined by 5 important dates on which behavioral pattern changes were initiated among the West Virginia populations. These dates were taken from the Department of Health and Human Services and the Governor of West Virginia’s Executive Orders, as defined in Table 1. The dates in 2020 were chosen as follows. On March 24, an Executive order to Stay at Home was issued.10 On May 4, the campaign “West Virginia - The Comeback” was initiated. The indoor mask mandate was instated on July 7. Schools reopened on September 9. Moreover, virtual learning resumed on November 14. An Rt value with its 95% credible interval (CrI) was estimated for each non-overlapping time window. Percentage change (and 95% CrI) was then calculated between each successive policy change Rt value. The same procedure was repeated for the statewide data and each of the 9 regions.
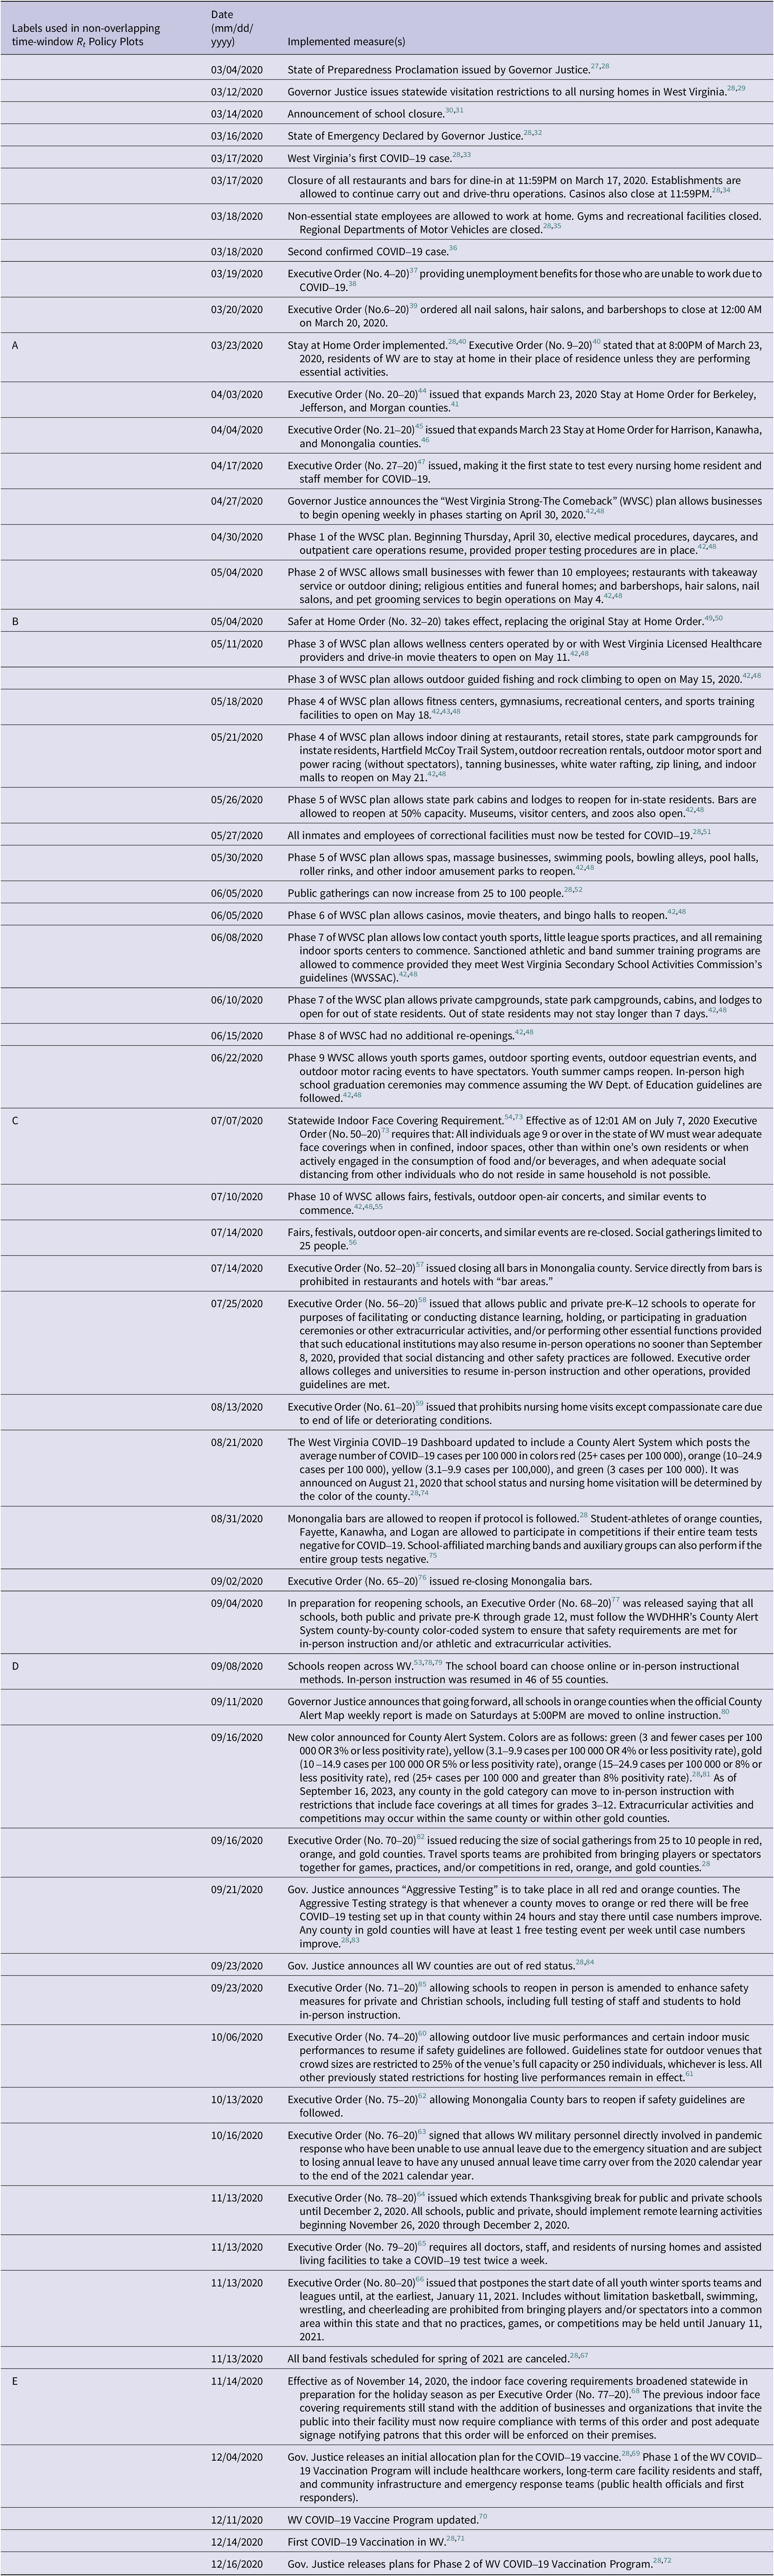
Table 1. A list in timeline order of all policy changes made by West Virginia to decrease the spread of COVID-19 March 2020-December 2020
Incidence Rate Ratio
To estimate the difference in case burden across different regions of the state, an IRR of observed case count was calculated for each region for each year of 2020, 2021, and 2022 (date of report), using the state as the reference. Poisson regression models, using person-days observed as the offset, were used to test the null hypothesis that the incident case rate for the state was equal to the incident case rate for each region. The number of days observed was 345, 365, and 365 in 2020, 2021, and 2022 respectively. 2020 was a leap year (366 days), and the time series began on January 22, 2020 (date of report), ending on December 31, 2022. The IRR analysis analyzed the incident case count data based on the number of daily incident cases by date of report. It should be noted that West Virginia’s COVID-19 declaration of emergency was terminated on January 1, 2023.11
Statistical language and Supplementary Materials
R version 4.3.1 and RStudio version 2023.9.0.0 statistical software were used to conduct the statistical analysis and to create figures and maps. We used the R package EpiEstim version 2.2-4 to generate Rt estimates. The online supplementary materials contain 20 files. Files S1-S9 are the R codes used to generate figures and data estimates. Files S10-S19 are the R functions used in these data files. File S20 contains Supplemental Figure 1.
Results
7-Day-Sliding-Window R t
The statewide Rt estimation showed significant changes in reproduction numbers throughout the time series. Figure 2 presents the bootstrapped incident case count data (panel 1), estimated daily infection count (panel 2), and the 7-day sliding window Rt (panel 3) for West Virginia. At the pandemic’s start, the 7-day sliding-window Rt was estimated to be 2, dropping to 1 in early April 2020. For the rest of the time series, Rt fluctuated above and below 1, showing when the pandemic was spreading and slowing down. The number of new cases stayed consistent for the first 8 months of 2020, with the first wave occurring at the end of December and going through January 2021. From January 2021-July 2021, 1 peak in Rt was greater than 1. In the remainder of 2021, there were 2 prominent peaks greater than 1. In 2022, there were 2 peaks: 1 early in the year and 1 in May. Rt fluctuated right around 1 for the rest of the year. The estimated number of new infections had 3 prominent peaks throughout the time series. The highest number of new cases was estimated in January 2022, the Omicron wave.Reference Daria and Islam12
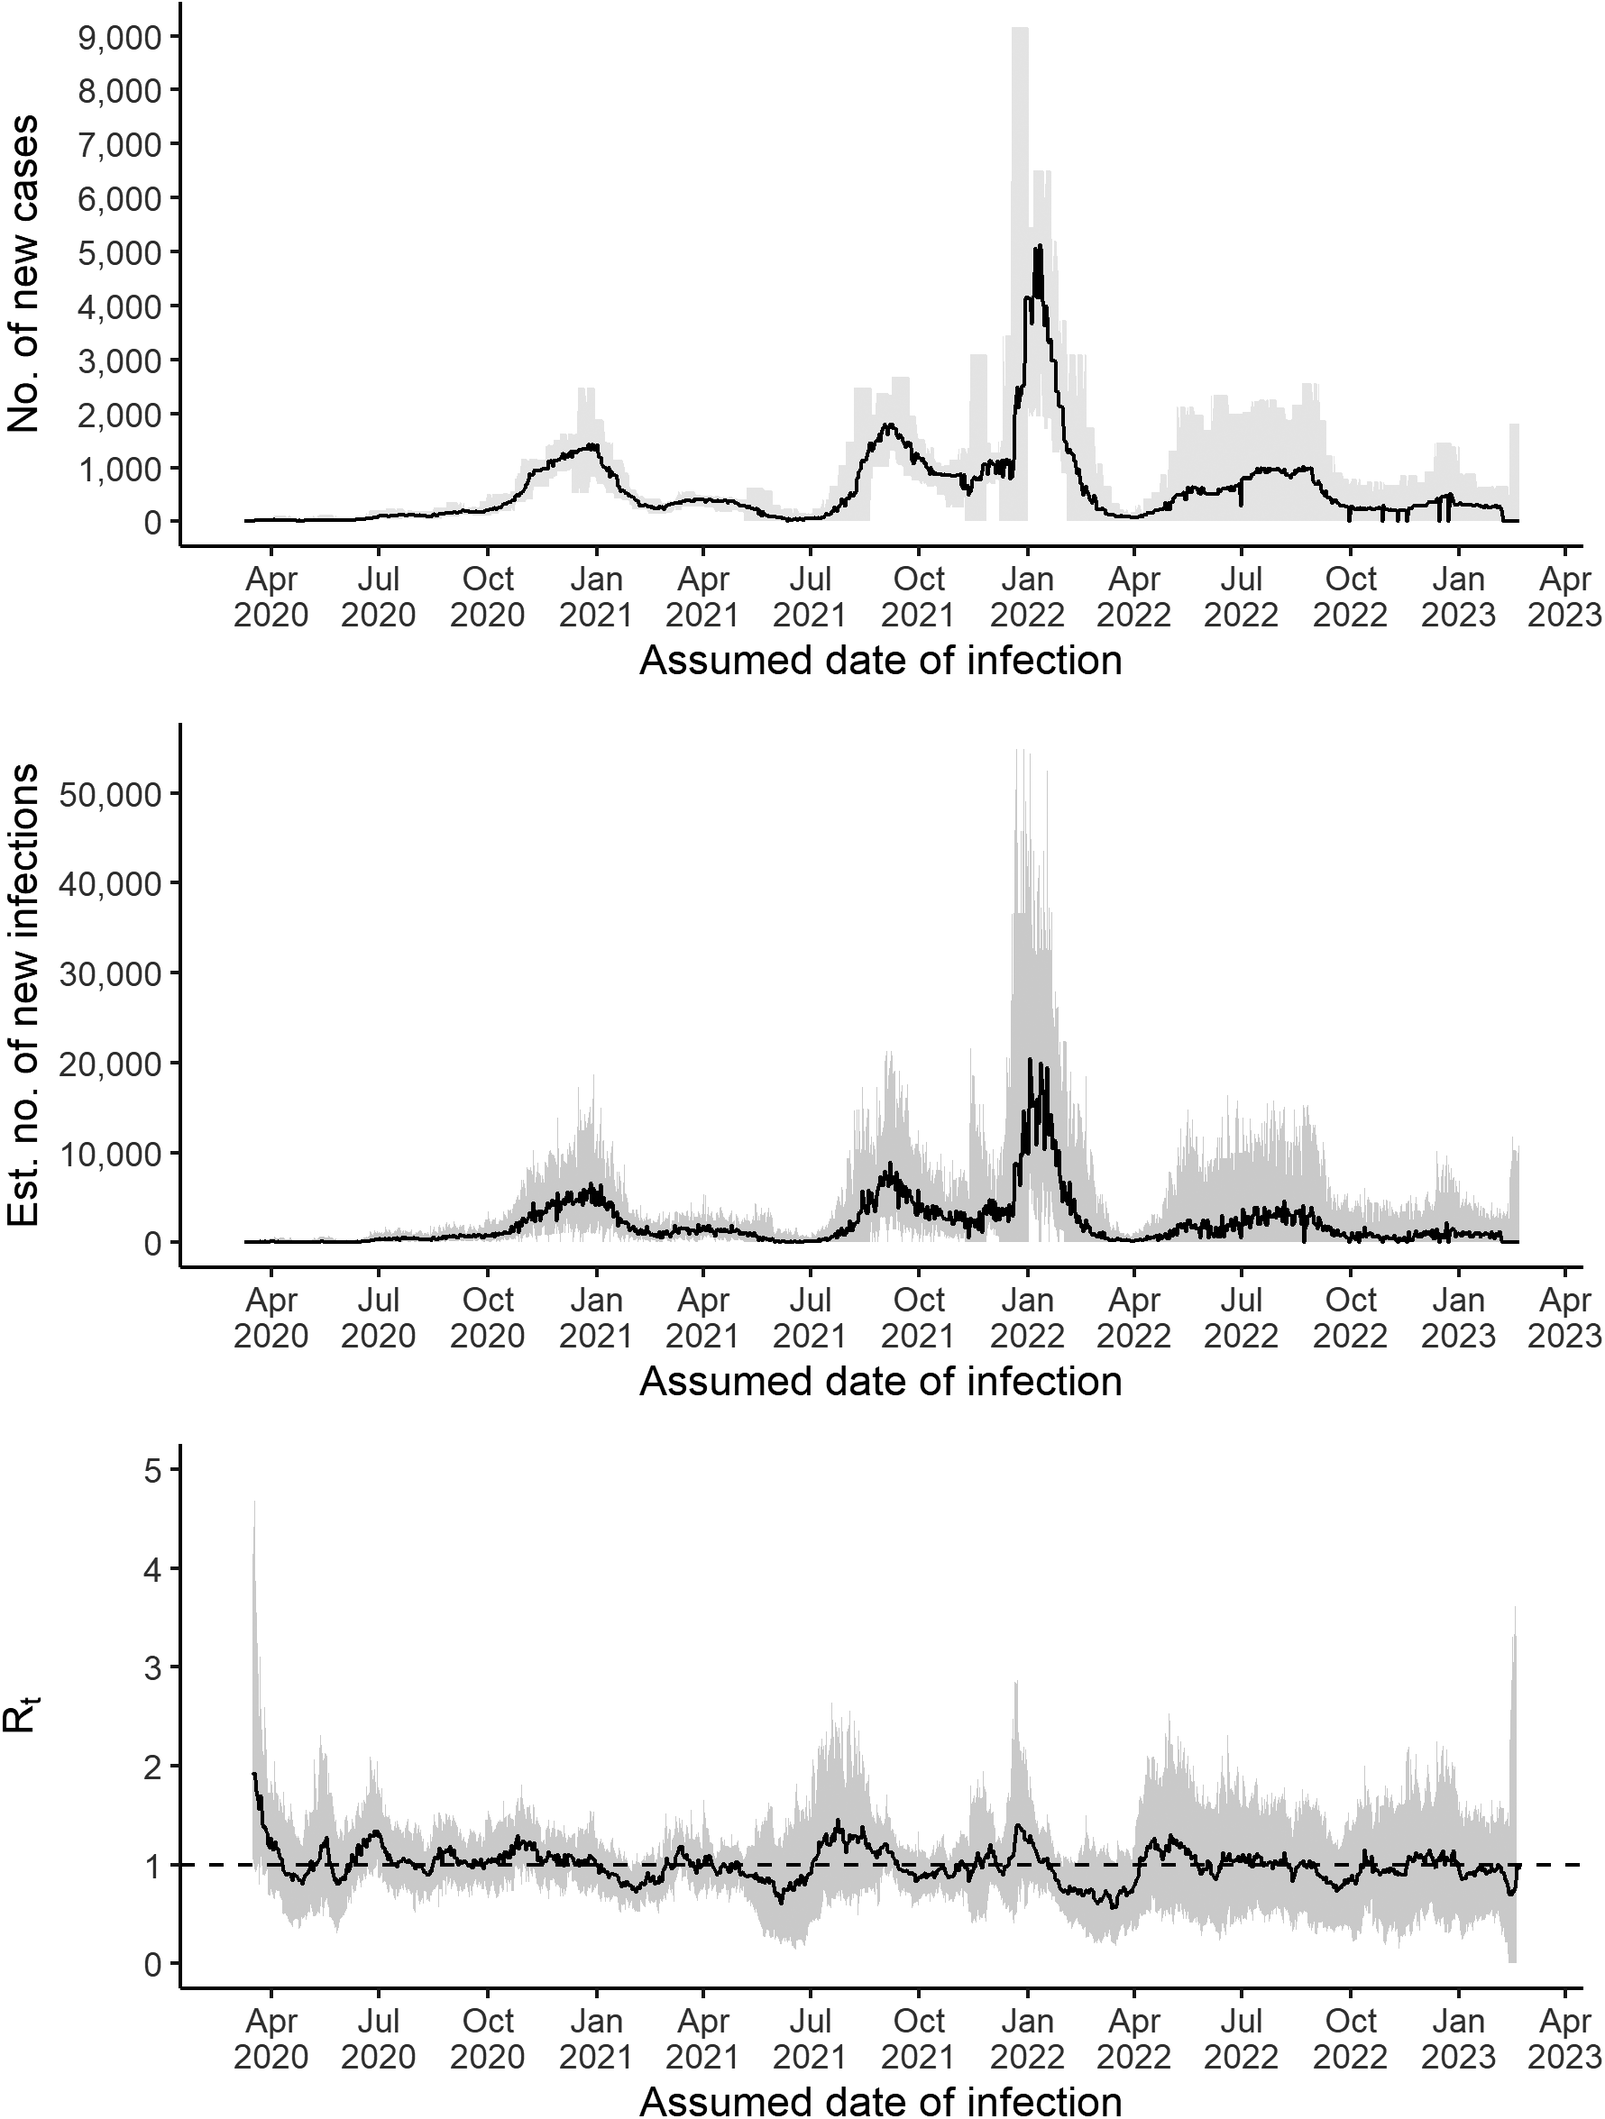
Figure 2. Panel 1 is the number of new cases in West Virginia throughout the time series with credible intervals. Panel 2 is the estimated number of new infections for the time series with a credible interval. Panel 3 presents the 7-day sliding window Rt estimates (black line) and its 95% credible interval (grey areas).
Policy Change R t
The percentage change in policy change Rt across West Virginia and its regions is presented in Figure 3. Supplemental Figure 1 (Supplemental File S20) presents the statewide changes in Rt over time across all non-overlapping time windows. The first policy change date, March 24, occurred 5 days after West Virginia reported its index case (Table 1). After the stay-at-home order was implemented, the policy change Rt decreased substantially (-38.67%; 95% CrI, -57.47%, -21.78%). Six regions experienced significant decreases in Rt after the policy change, with the Clarksburg region showing the largest decrease (-39.52%; 95% CrI, -60.73%, -15.02%). Metro-Charleston, Northern, Martinsburg, Morgantown, and Wood-Jackson decreased by about 30% (Table 2).
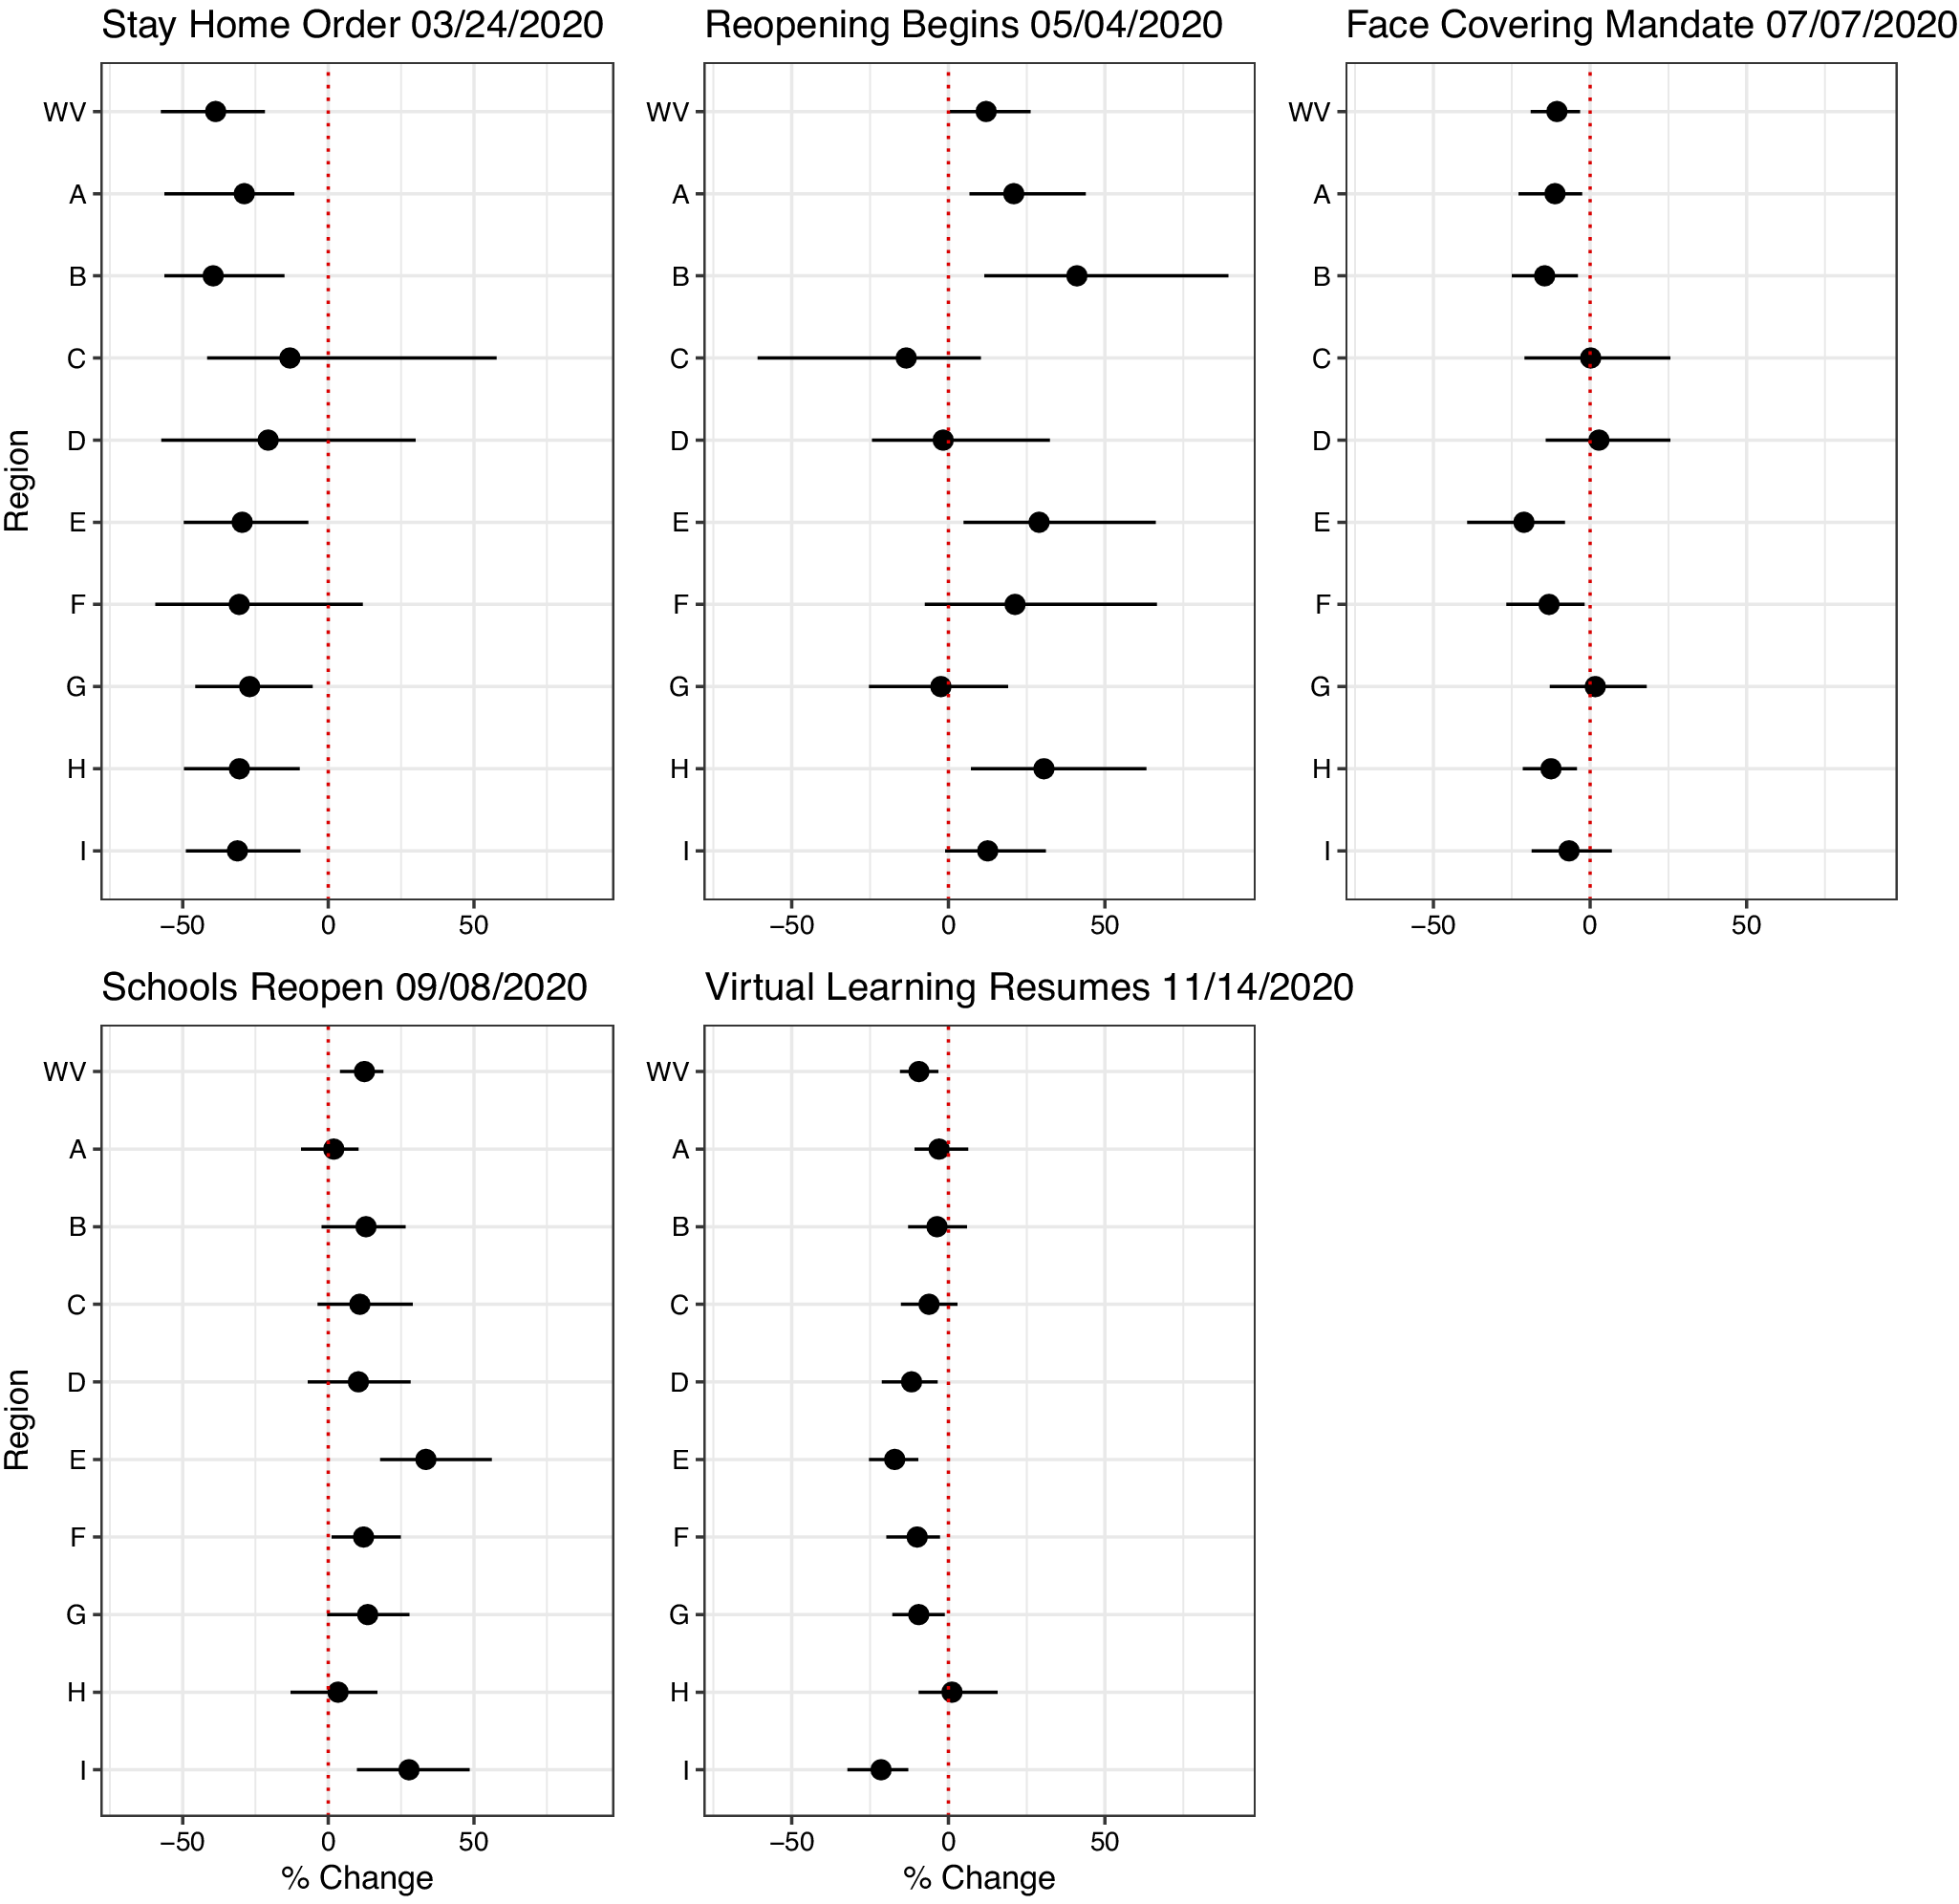
Figure 3. This figure displays the percentage change in Rt value with each policy implementation between each of the non-overlapping time windows. The figures display the Stay-at-Home Order, Reopening Begins, Indoor Mask Mandate, Schools Reopen, and Virtual Learning Resumes. A=Metro-Charleston, B=Clarksburg, C=Eastern, D=Western, E=Northern, F=Southern, G=Martinsburg, H=Morgantown, I=Wood-Jackson.
Table 2. Percentage change and 95% credible interval (CrI) in Policy Change Rt after each policy change, in West Virginia and its regions, in 2020
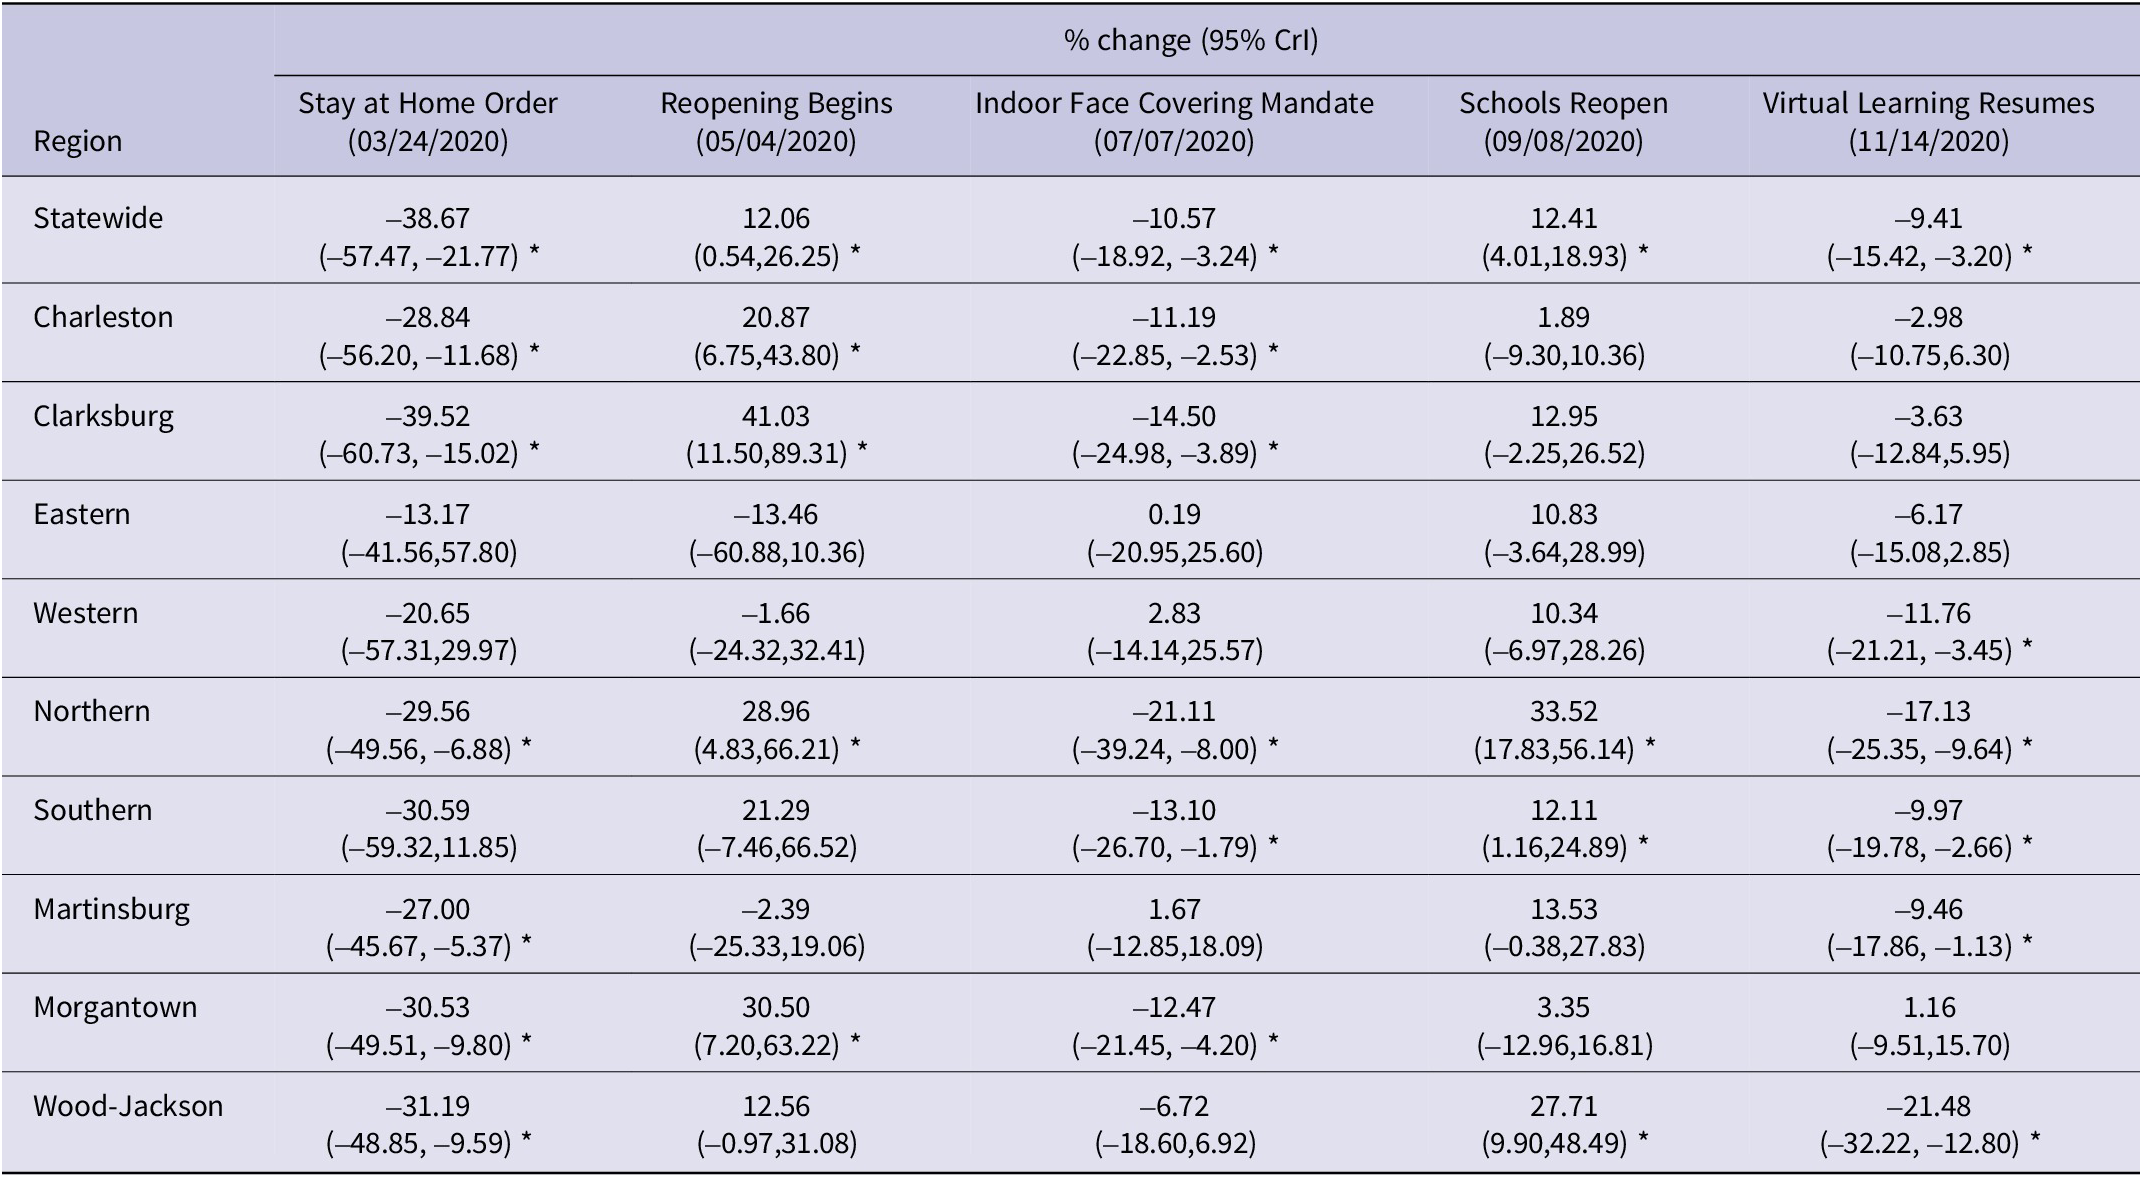
CrI, credible interval. The dates were indicated in the mm/dd/yyyy format. *The 95% CrI does not include 0 (equivalent to P<0.05) indicating that the null hypothesis that the percentage Rt change equals 0 can be rejected.
Reopening Begins marked the start of businesses reopening in West Virginia. With restrictions, businesses could open to small crowds; most were carry-out-only options. After May 4, 2020, the state saw a 12.06% (95% CrI, 0.54%,26.25%) increase in Rt. The Clarksburg region experienced a 41.03% (95% CrI, 11.50%, 89.31%) increase, Morgantown had a 30.5% (95% CrI, 7.20%, 63.22%) increase, the Northern region increased by 28.96% (95% CrI, 4.83%, 66.21%), and Metro-Charleston increased by 20.87% (95% CrI, 6.75%, 43.80%). The Eastern, Western, and Martinsburg regions had decreased Rt, which were not statistically significant.
The indoor face-covering mandate was implemented 9 weeks after reopening began (Table 1). This mask mandate was designed to slow the spread of the SARS-CoV-2 virus between people. After this mandate in early July, policy change Rt decreased in West Virginia (-10.57%, 95% CrI, -18.92%, -3.24%). Metro-Charleston, Morgantown, Southern, Northern, and Clarksburg saw noticeable decreases in Rt, while the rest saw negligible changes.
In September 2020, West Virginia opened all schools up to in-person instruction with restrictions. The state saw a 12.41% (95% CrI, 4.01%,18.93%) increase in policy change Rt, which was similar to what was seen in the Southern region. The Northern region had an increase of 33.52% (95% CrI, 17.83%, 56.14%).
Lastly, after schools transitioned back to online learning in November 2020, policy change Rt decreased in West Virginia (-9.41%, 95% CrI, -15.42%, -3.20%). Martinsburg, Southern, and Western regions had decreases of a magnitude close to 10%, with Wood-Jackson and the Northern region having over 15% decreases. The rest of West Virginia did not see a significant increase or decrease in Rt through the end of 2020.
Incidence Rate Ratio
The relative burden of incident cases by region and year is presented as IRR with the state as the referent (Table 3, Figure 4). The IRRs of Metro-Charleston (Region A) were only slightly greater or less than 1, indicating the epidemic in Metro-Charleston was driving that of the state. Clarksburg (Region B) had an IRR of 0.822 (95% Confidence Interval (CI), 0.8, 0.844) in 2020 but had IRR > 1 in the following years. The Eastern (Region C), Western (Region D), and Southern (Region F) regions showed decreases in IRR from higher values in 2020 to lower values in 2021 and 2022. For example, the Western region decreased from an IRR of 1.86 (95% CI, 1.814, 1.900) in 2020 to 1.161 (95% CI, 1.143,1.179) in 2022. It should be noted that the Western region consistently had IRR >1 from 2020-2022. Wood-Jackson (Region I) had the highest IRR, peaking in 2021 at 1.961 (95% CI, 1.937, 1.984). Wood-Jackson had around 19.6 regional cases per every 10 cases seen throughout the state. Morgantown (Region H) had small fluctuations in IRR, remaining around 0.55 in 2020 and 2022 with a peak in 2021 of 0.73 (95% CI, 0.718, 0.743). Martinsburg (Region G) saw a case burden consistently lower than the state by 5% to 18% in 2020-2022. The Northern region (Region E) performed the best throughout the time series, with its lowest IRR in 2020 at 0.323 (95% CI, 0.316, 0.330). For every 10 new cases statewide, there were 3 new cases seen in the Northern region.
Table 3. This table displays the incidence rate ratio (IRR) estimates of each region in West Virginia across 2020, 2021, and 2022, using the statewide incident case rate as the reference group. There were 3 Poisson regression models, 1 for each year
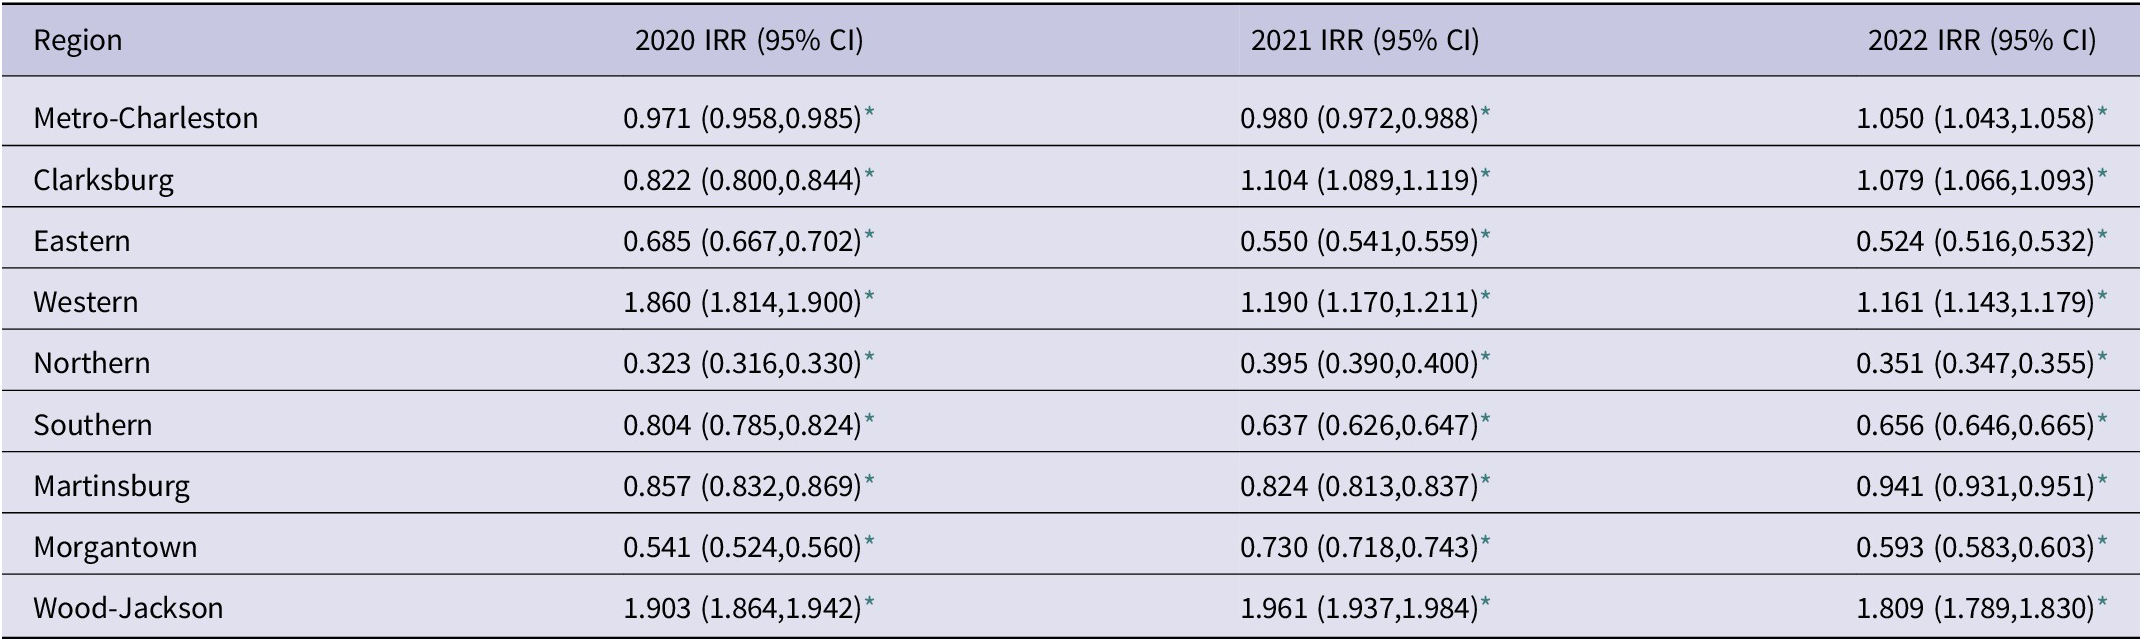
* P<0.001. CI, Confidence interval. IRR, Incidence rate ratio.
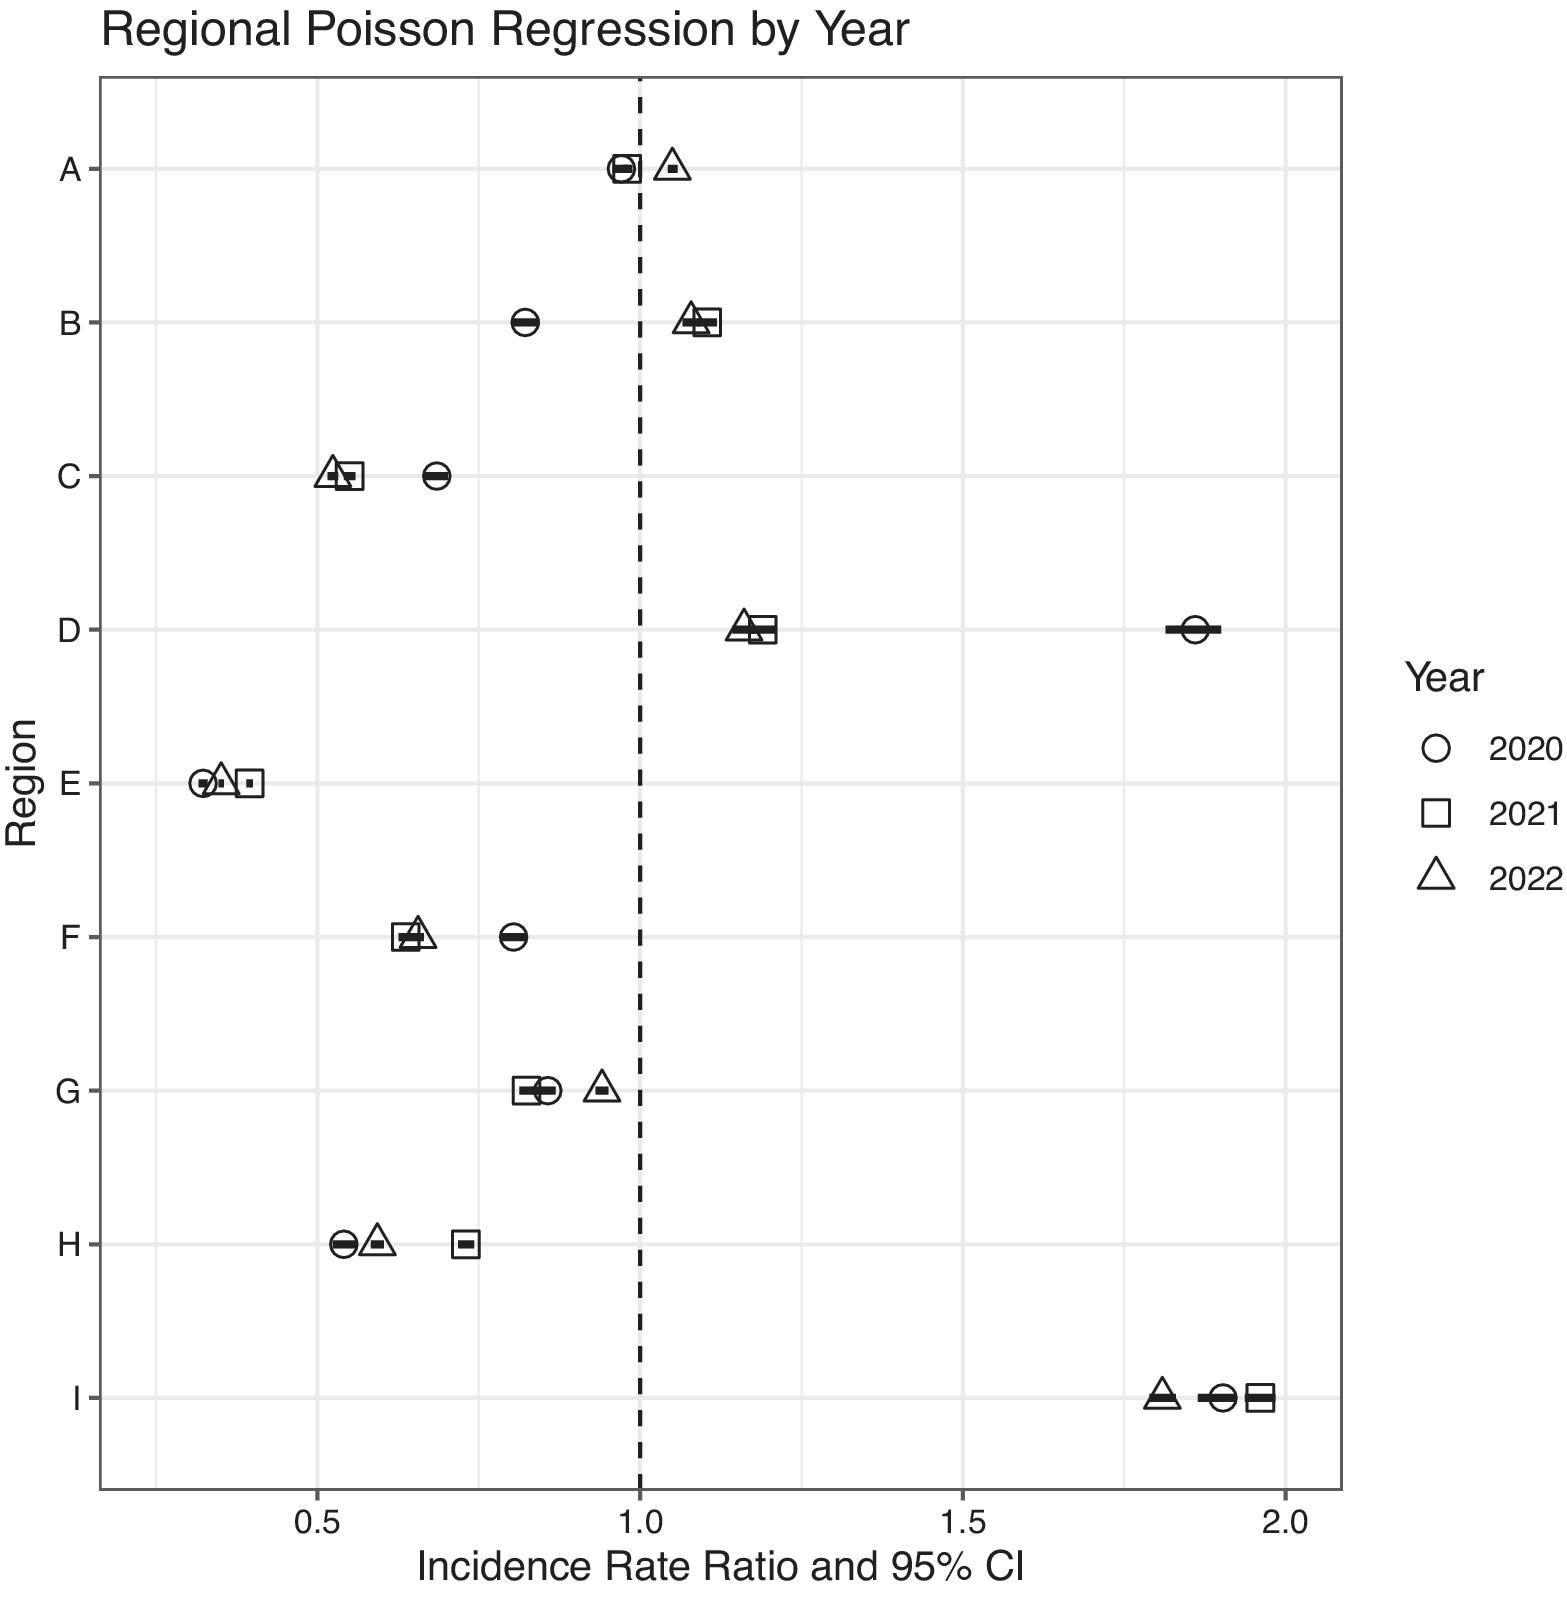
Figure 4. This figure displays the incidence rate ratio (IRR) from each region, with the incidence rate of West Virginia as the referent. The year is indicated by the symbol shape. 95% Confidence Intervals (CI) are indicated by the black bar. Each region is indicated by the following alphabet. A=Metro-Charleston, B=Clarksburg, C=Eastern, D=Western, E=Northern, F=Southern, G=Martinsburg, H= Morgantown, I=Wood-Jackson.
Discussion
In this study, we analyzed COVID-19 epidemiology in West Virginia by completing a threefold analysis: (i) describing the changes in COVID-19 transmission potential from March 2020-February 2023 through 7-day sliding-window Rt estimation, (ii) estimating the effect of non-pharmaceutical interventions and public health policy changes in 2020 via percentage changes in policy change Rt, and (iii) identifying regional variation in case burden through IRR estimation by region using statewide case count as the reference group. Tracking Rt fluctuations during the pandemic illustrates the epidemic trends of SARS-CoV-2 throughout the population. The Rt allows us to visualize the disease’s transmissibility. West Virginia’s Rt peaked with the index case in March 2020, and a steep decline showed how the number of new cases stayed low until October 2020, when Rt steadily increased through mid-November 2020 (Figure 2 Panels 1,3).
The findings of this research are supported by similar studies conducted in other states across the US. West Virginia, located in the South Atlantic region with Georgia, South Carolina, Delaware, and several other states, experienced similar peaks, changes, and values of Rt throughout the first year of the COVID-19 pandemic.13-Reference Politis, Hua and Ogwara15 In West Virginia, a peak in Rt was observed in early July 2020, followed by a decline after the implementation of the mask mandate on July 7, 2020. The Rt dropped below 1 in May, June, and September 2020. These fluctuations in Rt could be associated with a false sense of security as case numbers decline, leading to increased social activity. In early May 2020, new cases remained constant, and Rt was low. However, once Governor Justice initiated “The Comeback” campaign, which began opening businesses, Rt increased and then dropped in June 2020. The increase in cases leading up to July likely influenced the decision to implement the mask mandate in July 2020. Following the mandate, Rt fluctuated around 1 until it dipped below 1 in September 2020, potentially supporting the reopening of schools.
The policy changes that had the most significant impact on Rt estimation were primarily those implemented during the first 3 months of the pandemic in West Virginia. The state experienced significant percent changes in Rt for all 5 policy changes, contrasting with a study conducted in Alabama, Louisiana, and Mississippi, where substantial changes in Rt were seen with each policy change. These states implemented their stay-at-home order in early May and saw changes up to -20% in Rt, compared to West Virginia’s -38% (95% CrI, -57.47%, -21.77%).Reference Politis, Hua and Ogwara15, Reference Ofori, Ogwara and Kwon16 Both of these states observed significant decreases in Rt following the stay-at-home orders. Seven states in the US did not implement stay-at-home orders at the beginning of the pandemic.Reference Stracqualursi17 Of these, 4 have similar Rt estimation studies. North Dakota and Wyoming saw no significant change in Rt after their first policy change. At the same time, South Dakota experienced an increase in Rt following the announcement of the state of emergency.Reference Hua, Kehoe and Tome18 Arkansas, however, saw a change in Rt by -53% after closing school on March 17, 2020, successfully maintaining control of the pandemic with its first policy change.Reference Politis, Hua and Ogwara15 These variations indicated that implementing true stay-at-home orders, compared to other policy changes, significantly increases the likelihood of maintaining control of the pandemic, especially early on. Arkansas, for example, had social distancing guidelines in place, but the comparison across these states suggests that stricter stay-at-home orders were more effective in managing the early pandemic when vaccine was not available.
Politis et al. reported differences in Rt values following policy changes in the Appalachian region of Kentucky, noting a higher initial Rt compared to the statewide Rt observed in West Virginia after the index case in March 2020. This suggests an opportunity to examine the geographical variation in response to public health policies throughout the Appalachian region.Reference Politis, Hua and Ogwara15 Further studies should explore comparisons between these regions and consider the demographics of their populations.
Regionally, increases and decreases in Rt matched the statewide data in West Virginia, with no outliers or conflicting data observed. While some changes were statistically insignificant, the northern region stood out as the only area where every policy change resulted in a significant percentage increase or decrease in Rt. After schools reopened in September 2020, 3 regions experienced statistically significant percent increases in policy change Rt. These were Northern, Southern, and Wood-Jackson. Moreover, when schools resumed virtual learning in November, Western and Martinsburg regions joined them in significant decreases in policy change Rt estimates.
Metro-Charleston, Clarksburg, and Morgantown all saw changes in policy change Rt for the first 3 policy changes; however, in the last 2, they did not see a significant percent change. According to a retrospective cohort study, schools opening and going online had regionally diverse results when comparing increases in cases across the US.Reference Ertem, Schechter-Perkins and Oster19 Ertem et al. found no statistically significant difference in incidence in different counties that had remote learning methods or in-person instruction.Reference Ertem, Schechter-Perkins and Oster19 The variability in this national analysis provides speculation as to why regionally, there was not a large difference in Rt observed for these counties when looking at the impact of in-person instruction on virtual learning models.
To gain a better understanding of how the COVID-19 pandemic impacted the regions, IRRs were calculated by region and year (2020, 2021, and 2022), and Poisson regression was used to evaluate if the case burden (case count per person-time) was statistically significantly different from the state overall. The incidence rate of every region was significantly different from the state across the entire time series. The Metro-Charleston region had a statistically significant IRR; however, the effect size was small because the incidence rate of the state was similar to the region (IRR2020 = 0.971 (0.958,0.985), IRR2021 = 0.98 (0.972,0.988), IRR2022 = 1.05 (1.043,1.058)). Given that the Metro-Charleston region (location of the state capital) contains 33.16% of the West Virginia population, it helps explain why this region’s incidence rate is the closest to the statewide data as it hosts a large proportion of the state’s population.
The Wood-Jackson region experienced an incidence rate that was twice that of the state from 2020 through 2022 (IRR2020 = 1.903(1.864,1.942), IRR2021 = 1.961(1.937,1.984), IRR2022 = 1.809(1.789,1.830)) (Figure 4). This region contains 6.24% of West Virginia’s population, the second smallest region in the study. Many factors can explain why this region had so many cases. Two of the most populated cities in West Virginia are in Wood County, and Jackson County’s largest city has 3900 people.20 These regions are primarily rural except for 2 or 3 larger cities with a central location that hosts a large majority of essential businesses. When 2 or 3 cities host grocery stores, gas stations, and workplaces for the rural community, it creates opportunities for human interaction and disease transmission.
In contrast, the Northern region had an incidence rate that was 2/3 lower than the state’s incidence rate (IRR2020 = 0.323(0.316,0.330), IRR2021 = 0.395(0.390,0.400), IRR2022 = 0.351(0.347,0.355)). Also known as the “Northern panhandle of West Virginia,” this region is in proximity to 2 US cities with populations over 300 000.21-23 This region contains 31.4% of the population of West Virginia. The Northern region had a much better IRR than any other West Virginia region. A closer examination of what contributed to the Northern region’s better IRR would provide valuable insights into effective public health policy implementation in large populations.
The actions set in place by Governor Justice impacted West Virginia’s case count for the entirety of the pandemic. The first noteworthy wave of new infections was seen in October 2020. This 7-month delay in cases was crucial in providing better control over the COVID-19 pandemic. The mask mandate also slowed the transmission of the virus by almost 11%. This aided in decreasing transmission again by slowing the ability for large virus particles to infect susceptible individuals from the air.
The evaluation of geographical differences across the state highlights how examining the state more closely can reveal patterns that Rt values alone do not show. Future research may reveal what makes these 9 regions vary substantially in incidence rate from the state. These differences have the potential to provide strong tactics that can cater to economically, socially, and demographically different populations. Mitigating the negative impacts of the pandemic was seen in West Virginia from the swift implementation of state-wide policy changes by Governor Justice. The way that Rt fluctuated above and below 1 throughout the time series showed that West Virginia had periods of control over the pandemic and periods where intervention was necessary. Timing these moments is essential to maintaining control over a pandemic, and this evaluation contributes to the evidence for the most impactful public health interventions.
Limitations
There are limitations in this study. First, the irregularity of reporting in public health surveillance was reflected in the negative daily incident case count in the publicly available aggregated daily case count data, which had to be corrected. We further addressed the uncertainty issue of reporting irregularity by non-parametric bootstrapping of incident case count data. Second, it was suggested that only 1 in 4 COVID-19 infections were reported as cases.9 This underreporting phenomenon was attributed to asymptomatic and mildly symptomatic infections, with which the patients might not get tested. We addressed the underreporting issues using a Poisson-distributed multiplier to estimate the daily incidence infection count. Third, we shifted the time series of reported case count by 9 days to approximate the date of infection from the date of report, given a mean incubation of 6 days and a median of 3 days in the lag from symptom-onset to a confirmed case report.8
Fourth, we used the parametric instantaneous reproduction number method in the R package EpiEstim to estimate Rt. This method requires the users to specify the parameters of a known serial interval distribution as a proxy for the generation interval distribution. However, it is known that the COVID-19 serial interval may change over time due to public health interventions.Reference Ali, Wang and Lau24, Reference Kwok, Wei and Huang25 Fifth, the EpiEstim method only represents the uncertainty in the serial interval distribution in the uncertainty bounds of Rt estimates. In this study, we represent other sources of uncertainty by applying non-parametric bootstrapping and Poisson-distributed multipliers to the case count data before applying the EpiEstim Rt estimation. Sixth, we used a non-overlapping time window between policy changes to estimate policy change Rt and its percentage change after a policy change. This method is subject to arbitrariness as the authors had to determine which policy change dates should be chosen as the cut-off points. Seventh, it was assumed that the transmission potential was stable over the period for the policy change Rt, given that a specific package of non-pharmaceutical interventions was implemented. However, people’s compliance with public health interventions and policies might change over time.Reference Du, Wang and Shan26 We did not have data to represent such potential changes. Eighth, given that aggregate data were used, no data pertinent to individual-level characteristics, e.g., age, was available. Such confounding factors cannot be adjusted. Ninth, this is an ecological analysis. Thus, the ecological fallacy is possible. That said, ecological analysis is an appropriate study design for our study given our research question. Tenth, it was out of the scope of this paper to analyze other social determinants of health at the aggregate level.
Conclusions
Across the state of West Virginia, significant decreases in Rt were observed for the stay-at-home order, mask mandate, and when schools resumed virtual learning. These trends were also reflected across regions, and although no specific trends were seen across smaller or larger regions, Metro-Charleston did reflect significant fluctuations in Rt in the first 3 months of the pandemic. The case burden varied significantly by region in the state as reflected by IRRs substantially larger than or smaller than 1, indicating a large difference in incidence rate between the statewide rate and each of the regions (except Metro-Charleston). Clarksburg’s incidence rate was lower than the statewide rate in 2020, but higher in 2021 and 2022. Our IRR results suggest geographical variation in case burden in West Virginia.
Supplementary material
The supplementary material for this article can be found at http://doi.org/10.1017/dmp.2025.49.
Data availability statement
COVID-19 data analyzed in this project are publicly available at the COVID-19 Data Repository by the Center for Systems Science and Engineering (CSSE) at Johns Hopkins University.
Author contribution
AAB and XH served as co-first authors; DAA, SD, WSK, OO, and OAS served as co-second authors; AAB: Conceptualization, Study Design, R Code Writing, Data Analysis, Manuscript Writing, and Editing; XH: Conceptualization, Study Design, R Code Writing, Data Analysis, Manuscript Writing, and Editing; DAA: R Code Writing, Data Analysis, Manuscript Writing, and Editing; SD: R Code Writing, Data Analysis, Manuscript Writing, and Editing; WSK: R Code Writing, Data Analysis, Manuscript Writing, and Editing; OO: R Code Writing, Data Analysis, Manuscript Writing, and Editing; OAS: Data Analysis (Retrieval of policy information), Manuscript Editing; JS: Study Design, Manuscript Editing; JK: R Code Writing, Manuscript Editing; KOK: Manuscript Editing; GH: Manuscript Editing; ICHF: Conceptualization, Study Design, R Code Writing, Manuscript Writing, and Editing
Funding statement
We did not receive any external funding for this project.
Competing interest
ICHF consulted for Merck & Co., Inc. All the other authors have nothing to declare.


 Open access