Cognitive control, or executive functioning, describes the ability to regulate complex and goal-directed behaviors that involve planning, attention maintenance, inhibition, processing speed, and/or working memory. These skills are critical to adaptive functioning and mental health (for a comprehensive review, see Diamond, Reference Diamond2013). Although impaired cognitive control is implicated in several psychiatric conditions, it features prominently in attention deficit hyperactivity disorder (ADHD; Barkley, Reference Barkley1997). ADHD is a prevalent primary diagnosis in children (Polanczyk et al., Reference Polanczyk, Salum, Sugaya, Caye and Rohde2015) and also commonly comorbid with other neurodevelopmental, genetic, and/or medical diagnoses (Muskens et al., Reference Muskens, Velders and Staal2017). Children with ADHD present with highly heterogeneous profiles of cognitive control deficits (Arnett, McGrath, et al., Reference Arnett, McGrath, Flaherty, Pennington and Willcutt2022; Fair et al., Reference Fair, Bathula, Nikolas and Nigg2012). As such, ADHD samples are particularly well suited for investigations of developmental pathways featuring individual differences in cognitive control.
According to Barkley’s self-regulation model of ADHD, impaired cognitive and behavioral self-regulation underlie ADHD symptoms (Barkley, Reference Barkley1997, Reference Barkley2015). For example, the ability to maintain attention to relatively less interesting or cognitively challenging information, while ignoring irrelevant distractions, is synonymous with attention regulation. Likewise, the abilities to inhibit prepotent responses and modulate activity level to match environmental context are examples of impulse control and behavioral self-regulation, respectively. However, models in which multiple, additive cognitive control deficits are proposed to explain ADHD (i.e., the “multiple deficit model”) account for only 16% of variance in hyperactivity/impulsivity and 35% of variance in inattention symptoms (McGrath et al., Reference McGrath, Pennington, Shanahan, Santerre-Lemmon, Barnard, Willcutt, DeFries and Olson2011). Thus, additional measures of cognitive control and cognitive development are needed to develop a more comprehensive etiological model of ADHD.
At the cortical level, atypical functional connectivity in the prefrontal striatal circuits is implicated in both ADHD (Cubillo et al., Reference Cubillo, Halari, Smith, Taylor and Rubia2012) and cognitive control processes (Castellanos & Proal, Reference Castellanos and Proal2012; Chung et al., Reference Chung, Weyandt and Swentosky2014; Collette et al., Reference Collette, Van der Linden, Laureys, Delfiore, Degueldre, Luxen and Salmon2005). Measures of cognitive control have been theorized to reflect underlying neurocognitive circuitry. Moreover, Johnson (Reference Johnson2012) proposed that prefrontal cortical networks influence development of other cortical networks and structures. Thus, cognitive control and its underlying neural circuitries may moderate the effects of atypical cortical development elsewhere in the brain. Alternately, neuropsychological and direct cortical measures of cognitive control may represent distinct constructs, with the former reflecting integration of multiple sensory, motor, and attention networks (Masumoto et al., Reference Masumoto, Yamaguchi, Sutani, Tsuneto, Fujita and Tonoike2006; O'Halloran et al., Reference O'Halloran, Kinsella and Storey2012; Tomasino et al., Reference Tomasino, Borroni, Isaja and Ida Rumiati2005) and the latter representing more localized function.
The NIH Research Domain Criteria (RDoC) framework, which encourages identification of transdiagnostic markers to support individualized diagnostic and treatment approaches, includes cognitive control within the "cognitive systems" matrix (Cuthbert & Insel, Reference Cuthbert and Insel2013; Insel et al., Reference Insel, Cuthbert, Garvey, Heinssen, Pine, Quinn, Sanislow and Wang2010) and encourages investigation of this construct using multiple levels of analysis (i.e., brain and behavior).
EEG methods, including event-related potentials (ERPs), have been used to capture neural activation during cognitive control tasks (Downes et al., Reference Downes, Bathelt and De Haan2017). ERPs are temporally sensitive, stimulus-, or response-locked components, and therefore offer precise measurement of neural responses to both external and internal stimuli. For example, the P3a component originates from the frontal and parietal regions (Squires et al., Reference Squires, Squires and Hillyard1975) and is thought to reflect novelty detection (Polich, Reference Polich2012). The P3b appears to originate from the parietal region (Squires et al., Reference Squires, Squires and Hillyard1975) and corresponds to task preparation and execution (Polich, Reference Polich2012). Additionally, the timing of the P3b often overlaps with a late slow wave (LSW) component that is present during working memory tasks (Ruchkin et al., Reference Ruchkin, Canoune, Johnson and Ritter1995). Attenuated ERP component amplitudes can be understood as reduced neural activation deriving from low excitation, weaker functional connectivity, or atypical allocation of cognitive resources (L. Jonkman et al., Reference Jonkman, Kemner, Verbaten, Van Engeland, Camfferman, Buitelaar and Koelega2000; van Dinteren et al., Reference van Dinteren, Arns, Jongsma and Kessels2014). Of note, attenuated P3a, P3b, and LSW ERP component amplitudes have been reported in pediatric ADHD samples (Kaiser et al., Reference Kaiser, Aggensteiner, Baumeister, Holz, Banaschewski and Brandeis2020).
Aperiodic slope, also known as 1/fβ distribution, can be measured using EEG and reflects the balance of slower and faster brain oscillations (Palva & Palva, Reference Palva and Palva2011). Prior research suggests that flatter slopes reflect greater cognitive engagement (He et al., Reference He, Zempel, Snyder and Raichle2010; Lendner et al., Reference Lendner, Helfrich, Mander, Romundstad, Lin, Walker, Larsson and Knight2020) and increased activation of local rather than global neural networks. There is a developmental effect on the aperiodic spectral slope beginning in infancy, wherein the slope flattens over the course of the lifespan (Hill et al., Reference Hill, Clark, Bigelow, Lum and Enticott2022; Schaworonkow & Voytek, Reference Schaworonkow and Voytek2021; Voytek et al., Reference Voytek, Kramer, Case, Lepage, Tempesta, Knight and Gazzaley2015). While infants at risk for ADHD have steeper aperiodic slope than their typically developing peers (Karalunas et al., Reference Karalunas, Ostlund, Alperin, Figuracion, Gustafsson, Deming, Foti, Antovich, Dude, Nigg and Sullivan2022), school-aged and adolescent children diagnosed with ADHD have flatter aperiodic slopes relative to peers (Arnett, Fearey, et al., Reference Arnett, Fearey, Peisch and Levin2022; Ostlund et al., Reference Ostlund, Alperin, Drew and Karalunas2021; Pertermann et al., Reference Pertermann, Bluschke, Roessner and Beste2019), suggesting an atypical cortical developmental trajectory among ADHD children.
Taken together, prior work suggests that children diagnosed with ADHD often have deficits in cognitive control skills and that those impairments may either derive from or compound reduced neural activation during cognitive tasks. Additionally, global cortical development appears to be atypical among children with ADHD, and this likewise may add to or interact with brain and behavioral atypicalities in cognitive control. As has been outlined by the RDoC framework, examination of brain–behavior associations of transdiagnostic markers, such as cognitive control, has the potential to strengthen etiological models, refine current psychiatric nosology, and guide treatment approaches.
In this study, we test three competing etiological models of ADHD, all of which include cognitive control at its core (Figure 1). First, a mediation framework posits that global neural dysfunction underlies aberrant cognitive control, which in turn leads to behavioral symptoms. In this model, cognitive control would represent an intermediate phenotype in the association between the global cortical development and behavioral symptoms. Second, a moderation framework posits that cognitive control is a risk and/or protective factor that modulates the strength of the association between ADHD symptoms and atypical neural activation and/or global cortical development. The potential moderating role of cognitive control was described by Johnson (Reference Johnson2012), who noted that the prefrontal cortical networks influence development of other cortical networks and structures. Thus, in the moderation framework, brain and behavioral measures of cognitive control are a proxy for the integrity of prefrontal cortical networks, which, at high levels, can buffer atypical cortical development elsewhere in the brain; or conversely, increase liability for abnormal neural development to lead to ADHD symptoms. Third, a multiple deficit model suggests that ADHD symptoms are best accounted for by multiple, additive neurocognitive vulnerabilities, measured at different levels (cortical and behavioral). Based on the extant literature and the model proposed by Johnson (Reference Johnson2012), we hypothesize that we will see support for the moderation framework. By examining the biopsychosocial path from neural atypicalities to ADHD symptoms and clarifying the role that cognitive control plays in this association we hope to refine etiological models of ADHD and advance what is known about the transdiagnostic marker cognitive control.
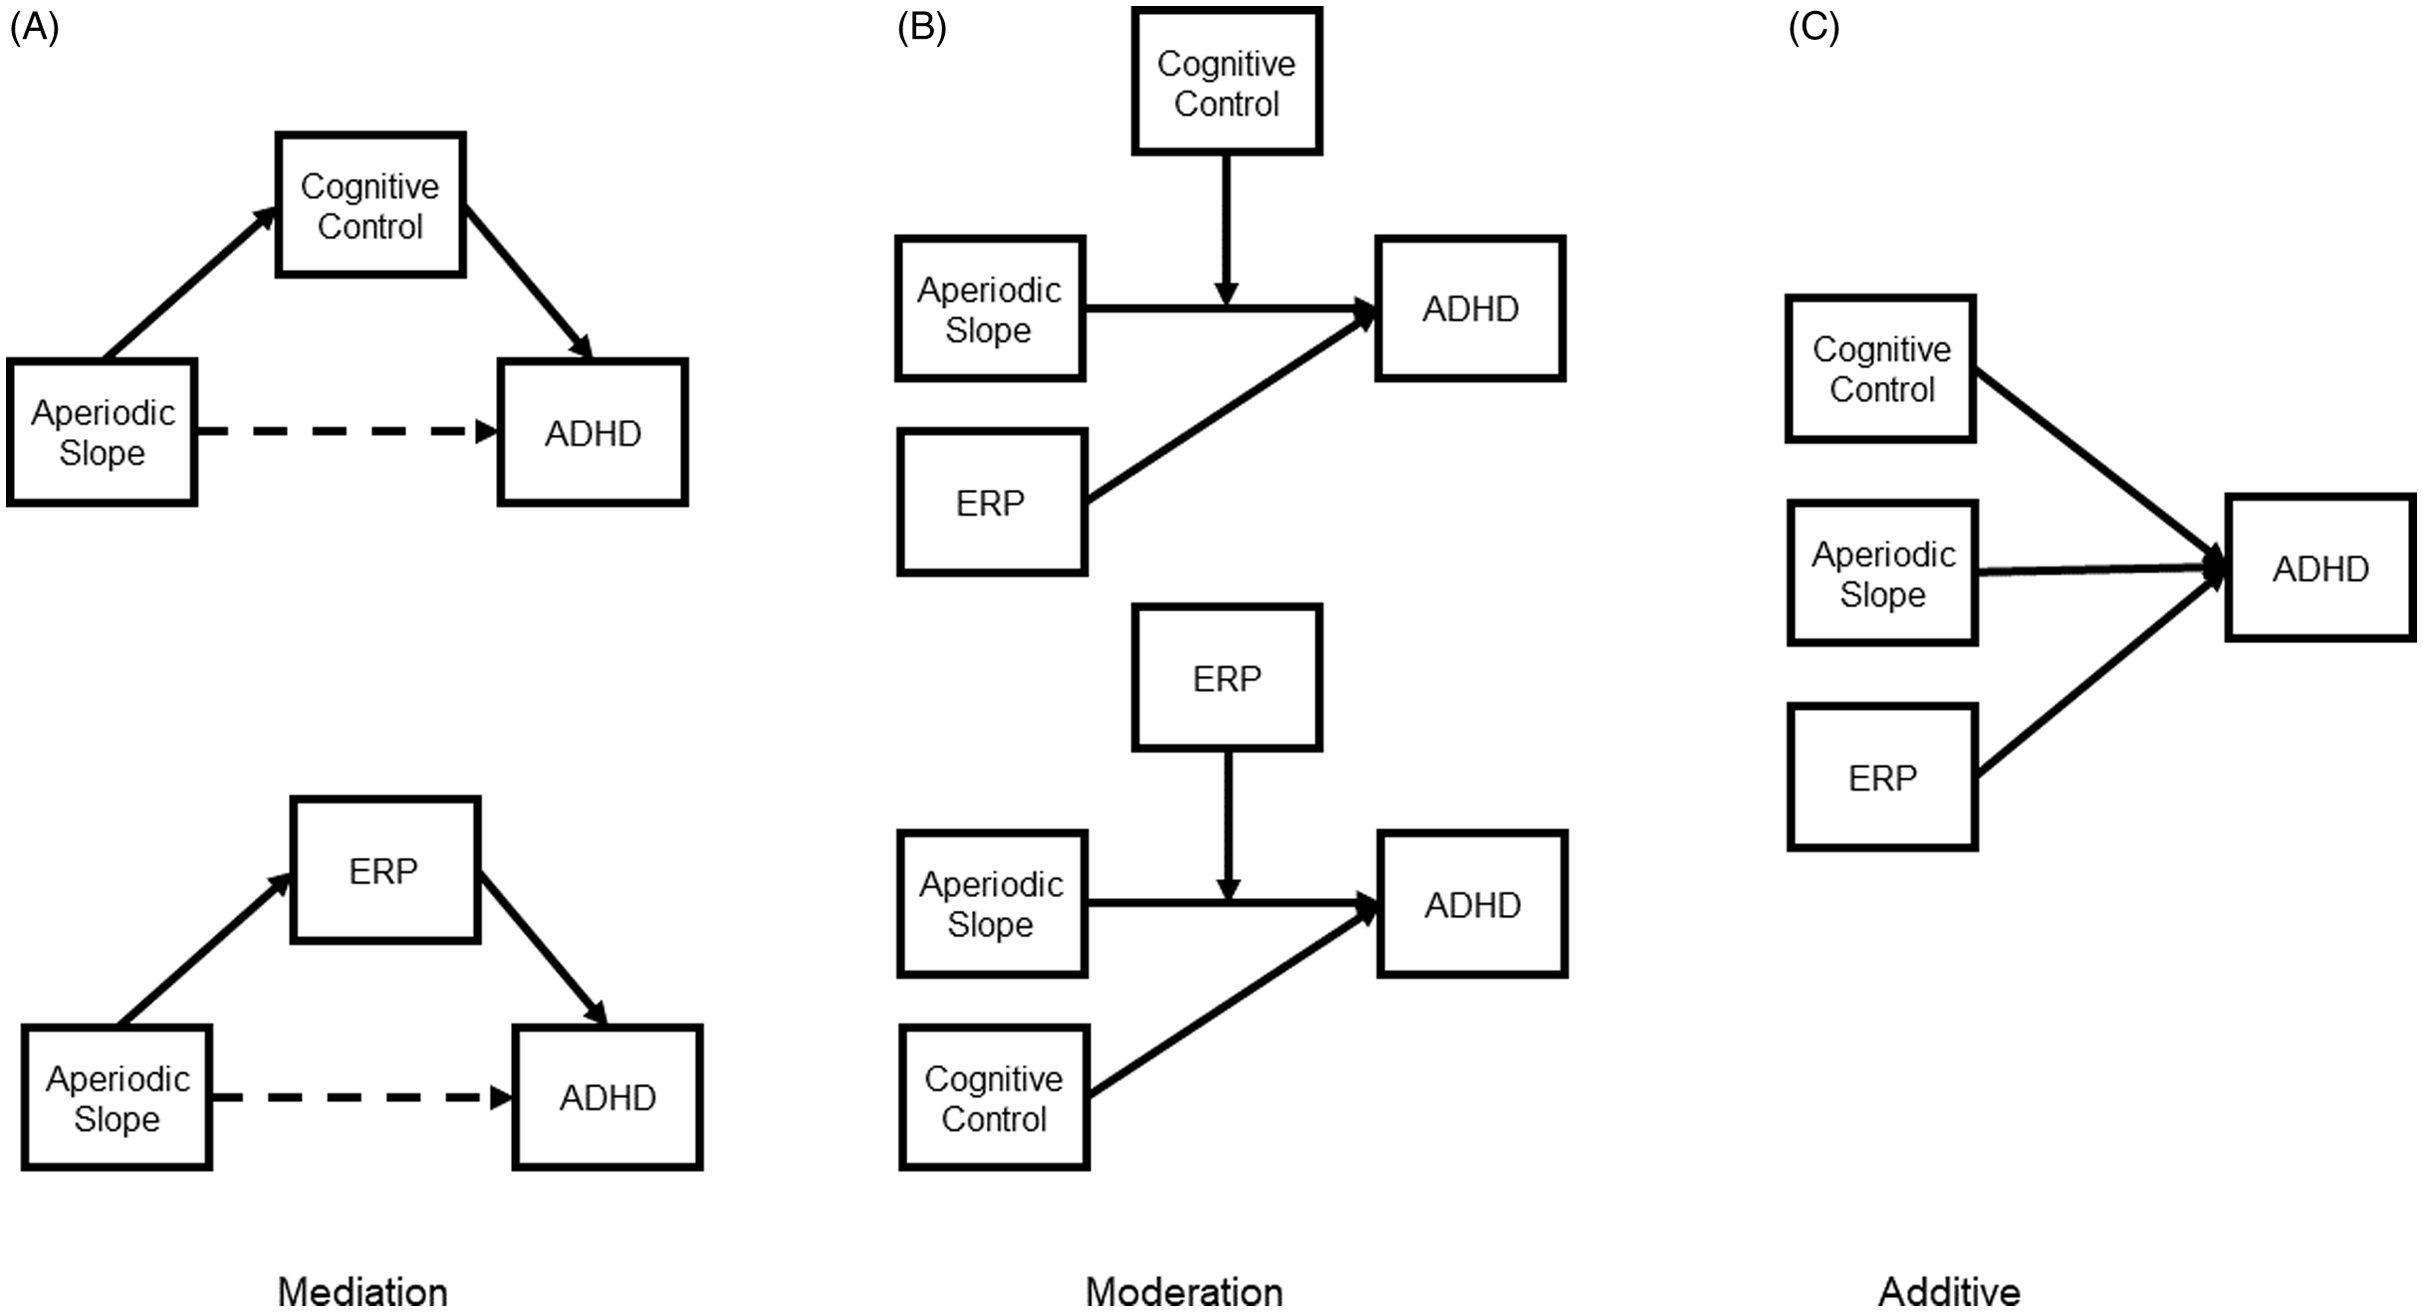
Figure 1. Schematic representation of the three competing etiological models. In the mediation model (A), behaviorally measured cognitive control or neurophysiologically measured cognitive control (ERP) mediates the association between aperiodic slope (i.e., global neurocognitive dysfunction) and ADHD. The dashed line represents a non-significant direct path. In the moderation model (B), behaviorally measured cognitive control or ERP moderates the association between aperiodic slope and ADHD. In the additive model (C), behaviorally measured cognitive control, ERP, and aperiodic slope explain distinct variance in ADHD outcomes.
We model a cognitive control factor that is indicated by shared variance across a range of neurocognitive domains (auditory attention, working memory, visual working memory, processing speed, inhibitory control), and a neural factor that is indicated by shared variance in neural activation associated with cognitive control processes (P3a, P3b, and LSW amplitudes). This approach acknowledges the heterogeneity in neurocognitive and phenotypic profiles of ADHD (Geurts et al., Reference Geurts, Verté, Oosterlaan, Roeyers and Sergeant2005; Nigg et al., Reference Nigg, Sibley, Thapar and Karalunas2020) and reduces error bias associated with single indicators. We also considered a non-prefrontal cortex index of cognitive functioning: aperiodic spectral slope.
Method
Participants
One-hundred seven children with a clinical diagnosis of ADHD and 34 control children, ages 7–11 years, were recruited via outreach to local pediatric hospitals and psychiatric clinics, schools, social media, and a university research registry. Exclusion criteria were a diagnosis of ASD, intellectual disability, gestational age <32 weeks, known genetic disorder, prenatal exposure to alcohol or drugs, or color blindness. Additional inclusion criteria for control participants were lack of immediate family history of ADHD or history of concern for ADHD symptoms. ADHD diagnoses were confirmed by a licensed clinical psychologist specializing in pediatric ADHD using a combination of sources that included direct observation, caregiver report on the computerized version of the Kiddie Schedule for Affective Disorders and Schizophrenia (K-SADS; Kaufman et al., Reference Kaufman, Birmaher, Brent, Rao, Flynn, Moreci, Williamson and Ryan1997), review of medical records, and/or caregiver report of at least six DSM-5 inattentive or hyperactive/impulsive symptoms as rated by a caregiver on the Strengths and Weakness of ADHD and Normative (SWAN) behaviors rating scale (Swanson et al., Reference Swanson, Schuck, Porter, Carlson, Hartman, Sergeant, Clevenger, Wasdell, McCleary, Lakes and Wigal2012). Control children had fewer than two DSM-5 ADHD symptoms in either symptom domain on the SWAN.
Twenty-two participants were disqualified following enrollment due to inability to confirm the ADHD diagnosis or suspicion of ADHD in a typically-developing (TD) participant; suspicion or later diagnosis of ASD or intellectual disability; identification of epileptiform activity during a subsequent EEG; or failure to abstain from medication prior to testing. The final sample of participants included 89 children with ADHD and 30 TDs. The groups did not differ on age (t[54.84] = 0.98, p = .332), proportion of females (x 2 [1] = 0.04, p = .845), or non-white participants (x 2 [1] = 0.14, p = .713). Consistent with prior literature (e.g., Calub et al., Reference Calub, Rapport, Friedman and Eckrich2019), the ADHD group had significantly higher total SWAN scores (t(53.60) = 16.88; p < .001) and full scale IQ (FSIQ) (t[56.66] = 4.47, p < .001) compared to the TD group. Please see Supplementary Materials Table 1 for group means.
Additionally, fifteen participants were excluded from the ERP analyses due to difficulties understanding or complying with the ERP task instructions, and/or not achieving the minimum 60% accuracy on the ERP task. The final sample for ERP analyses included 75 children with ADHD and 29 control participants. Participants who were excluded from ERP analyses due to task performance were younger (included M = 9.82 years; excluded M = 8.70 years; t[1] = 2.86, p = .011), and had more severe ADHD symptoms (t[22.87] = 2.45, p = .022) and lower FSIQ (t[15.92] = 3.14, p = .006), but did not differ on proportion of female (x 2 [1] = 0.001, p = .982) or non-white participants (x 2 [1] = 0.22, p = .637). Within the final ERP sample, the mean age was 9.96 years (SD = 1.35) for the ADHD group and 9.46 years (SD = 1.34) for the control group; there were no significant group differences on age (t(52) = 1.70; p = .10). Thirty-seven percent of participants identified as non-White, and the proportion of females was 31%. Proportions of females and non-White individuals did not differ across ADHD and control groups (p’s > .618).
Procedures
Participants abstained from taking prescribed ADHD medications for at least 48 hr prior to the research visit, when applicable. Caregivers completed written consent and children completed verbal and written assent at the start of the visit in compliance with the approved University of Washington IRB protocol. Research procedures included approximately 60 min of high-density EEG and 90 min of neuropsychological testing with a trained clinician, while parents completed questionnaires about their child’s behavioral, medical, and developmental histories.
EEG recording
Continuous EEG was collected with a high-density, 128-channel Magstim-EGI Hydrocel geodesic sensor net and Netstation Acquisition software version 4.5.6 integrated with a 400-series high impedance amplifier (Magstim-EGI; Plymouth, MN). Signal-to-noise ratio was maximized by reducing electrode impedances to below 50 kOhms at the start of the session, and by monitoring and re-wetting electrodes with saline solution throughout. EEG signals were referenced to the vertex electrode, analog filtered (0.1 Hz high-pass, 100 Hz elliptical low-pass), amplified and digitized with a sampling rate of 1000 Hz. Timing of the presentation of the visual stimuli on the subject monitor was recorded using a Cedrus Stimtracker (Cedrus Corporation, San Pedro, CA).
EEG processing
EEG data were processed offline in MATLAB R2018b using EEGLAB 15 and ERPLab v8.0 functions. To aid with artifact detection, initial processing included 6 min of resting EEG data and 6 min of a related ERP paradigm, in addition to the experiment analyzed in the current study. Eye electrodes and 14 rim channels were excluded from analyses. Data were downsampled to 250 Hz and bandpass filtered at 0.3–80 Hz. Electrical line noise from 55–65 Hz was removed using the Cleanline plugin for EEGLAB. Bad channels were automatically detected and subsequently interpolated back into the dataset prior to average referencing, following methods outlined in Gabard-Durnam et al. (Reference Gabard-Durnam, Mendez Leal, Wilkinson and Levin2018). Extended independent component analysis was run with primary component analysis dimension reduction to identify and subsequently remove artifactual independent components (e.g., eye blinks, line noise, or cardiac signal), consistent with published pipelines (Levin et al., Reference Levin, Méndez Leal, Gabard-Durnam and O’Leary2018). After ERP segmentation, data were further lowpass filtered at 40 Hz and corrected using a 300 ms baseline.
Measures
IQ. The Vocabulary and Matrix Reasoning subtests of the Wechsler Abbreviated Scale of Intelligence (WASI-II; Wechsler, Reference Wechsler2011) were used to estimate a FSIQ for each participant.
Cognitive control
Several subtests from the Wechsler Intelligence Scale for Children, Fifth Edition (WISC-5; Wechsler, Reference Wechsler2014) were included in the cognitive control factor. The coding subtest was used as an estimate of processing speed; digit span forward was used as a measure of auditory attention; digit span backward as a measure of verbal working memory; and picture span as an estimate of visual memory. Stop-signal reaction time from a computerized stop-signal task (SSRT; for methods, see Arnett et al., Reference Arnett, Rhoads and Rutter2021) and the Color-Word Interference subtest (Condition 3: Inhibition) of the Delis-Kaplan Executive Function System (DKEFS; Delis et al., Reference Delis, Kaplan and Kramer2001) were used as measures of inhibitory control.Footnote 1 Age-based scaled scores were derived for each measure using published clinical norms. An age-standardized residual was calculated for the SSRT score.
Psychological symptoms
Caregiver report on the SWAN questionnaire (Swanson et al., Reference Swanson, Schuck, Porter, Carlson, Hartman, Sergeant, Clevenger, Wasdell, McCleary, Lakes and Wigal2012) was used to assess ADHD symptom severity in all study participants. The SWAN uses a balanced 7-point Likert scale to measure adaptive skills and impairment associated with the 18 ADHD symptoms described in the DSM-5 (American Psychiatric Association, Reference Association2013). Example items include, “gives close attention to detail and avoids careless mistakes,” and “sits still.” Caregivers were asked to rate their child’s abilities relative to similar-age peers, when their child was not taking medications (if applicable). Ratings were averaged across relevant items to create mean inattention, hyperactivity/impulsivity, oppositional defiance, and sluggish cognitive tempo scores, with higher scores reflecting more severe ADHD symptoms. All four symptom summary scores were included as indicators in the ADHD factor.
Aperiodic slope
Aperiodic slope was derived from two resting paradigms. In the lights on resting condition, visual stimuli were presented using E-Prime 2.0, and consisted of six 30-s, silent, abstract color videos (Webb et al., Reference Webb, Borland, Santhosh, Naples, Levin and Bernier2018). During the lights off condition, the participant room was reduced to near-total darkness for 2 min. Participants were instructed to sit quietly with their eyes open during both experiments. After processing, all participants had at least 85 s of lights off and 127 s of lights on resting data. The Fitting Oscillations and One-Over-f (FOOOF) MATLAB toolbox (Donoghue, Dominguez, et al., Reference Donoghue, Dominguez and Voytek2020; Donoghue, Haller, et al., Reference Donoghue, Haller, Peterson, Varma, Sebastian, Gao, Noto, Lara, Wallis, Knight, Shestyuk and Knight2020) were used to compute the aperiodic exponent across a frequency range of 1–50 Hz, at each electrode for each individual. Informed by prior research (Ostlund et al., Reference Ostlund, Alperin, Drew and Karalunas2021; Robertson et al., Reference Robertson, Furlong, Voytek, Donoghue, Boettiger and Sheridan2019), we used a fixed aperiodic slope calculation after visual inspection did not indicate a “knee” in individual power spectral density distributions. Other parameters were applied as follows: peak_width_limits = [2,12], max_n_peaks = 8, min_peak_height = 0.5, peak_threshold = 2.0. Mean aperiodic slopes were calculated as the average of aperiodic slope at five midline electrode clusters: anterior frontal (Afz, Af3, Af4), frontal (Fz, F3, F4), central (Cz, C3, C4), parietal (Pz, P3, P4), and occipital (Oz, O1, O2). The aperiodic factor was estimated using equally weighted values from lights off and lights on paradigms. Aperiodic slope values were not correlated with the number of resting seconds analyzed (p’s > .99).
ERP task
Participants completed a dual task 1-back and passive visual oddball, adapted from Jonkman et al. (Reference Jonkman, Kemner, Verbaten, Koelega, Camfferman, v.d. Gaag, Buitelaar and van Engeland1997). One-back targets were presented alternately with visual oddball stimuli. Participants were instructed to press the right button when two identical 1-back targets (rectangles of the same color) were presented consecutively and the left button for incongruent consecutive targets (rectangles of different colors). Participants were told to ignore the oddball visual stimuli, which were irrelevant to the 1-back task. Oddball stimuli consisted of white brackets (standard stimuli; 60%), white brackets oriented in the opposite direction (deviant; 20%), and non-repeated white line drawings of vehicles and animals (novel; 20%). Participants were allowed up to three practice sets of 10 trials, followed by 140 test trials (each including a target and irrelevant stimulus) over three blocks. All stimuli were presented against a black background with a duration of 300 ms and interstimulus interval that varied randomly from 0.8–1.4 s.
ERP components
Grand average ERP waveforms were visualized for five a priori determined midline electrode clusters, consistent with prior research (Loo et al., Reference Loo, McGough, McCracken and Smalley2018): anterior frontal (Afz, Af3, Af4), frontal (Fz, F3, F4), central (Cz, C3, C4), parietal (Pz, P3, P4), and occipital (Oz, O1, O2). For each ERP component, the region of interest and time window were selected based on relevant prior literature (Gomarus et al., Reference Gomarus, Wijers, Minderaa and Althaus2009; L. Jonkman et al., Reference Jonkman, Kemner, Verbaten, Van Engeland, Camfferman, Buitelaar and Koelega2000; Willner et al., Reference Willner, Gatzke-Kopp, Bierman, Greenberg and Segalowitz2015) as well as visual examination of waveforms and topographical plots (see Figure 2). Mean amplitudes were averaged across trials. The P3a and P3b components were extracted from the parietal region (Pz, P3, P4), at 300–420 ms and 450–600 ms, respectively. The LSW was extracted from the central region (Cz, C3, C4) at 600–1000 ms. Based on prior literature, mean P3a and P3b amplitudes were calculated for novel stimuli, and mean P3b and LSW amplitudes were calculated for target stimuli (L. Jonkman et al., Reference Jonkman, Kemner, Verbaten, Van Engeland, Camfferman, Buitelaar and Koelega2000; Riggins & Scott, Reference Riggins and Scott2020). After processing, each participant had at least 104 ERP trials included. Partial Pearson correlations between ERP amplitudes and trial count, controlling for task accuracy and FSIQ, revealed a significant association between trial count and target P3b amplitude (r = .26, p = .008). Thus, P3b amplitude was not included in subsequent analyses. Partial correlations between trial count and novelty P3a, novelty P3b, and target LSW amplitudes were not significant (p’s > .098).
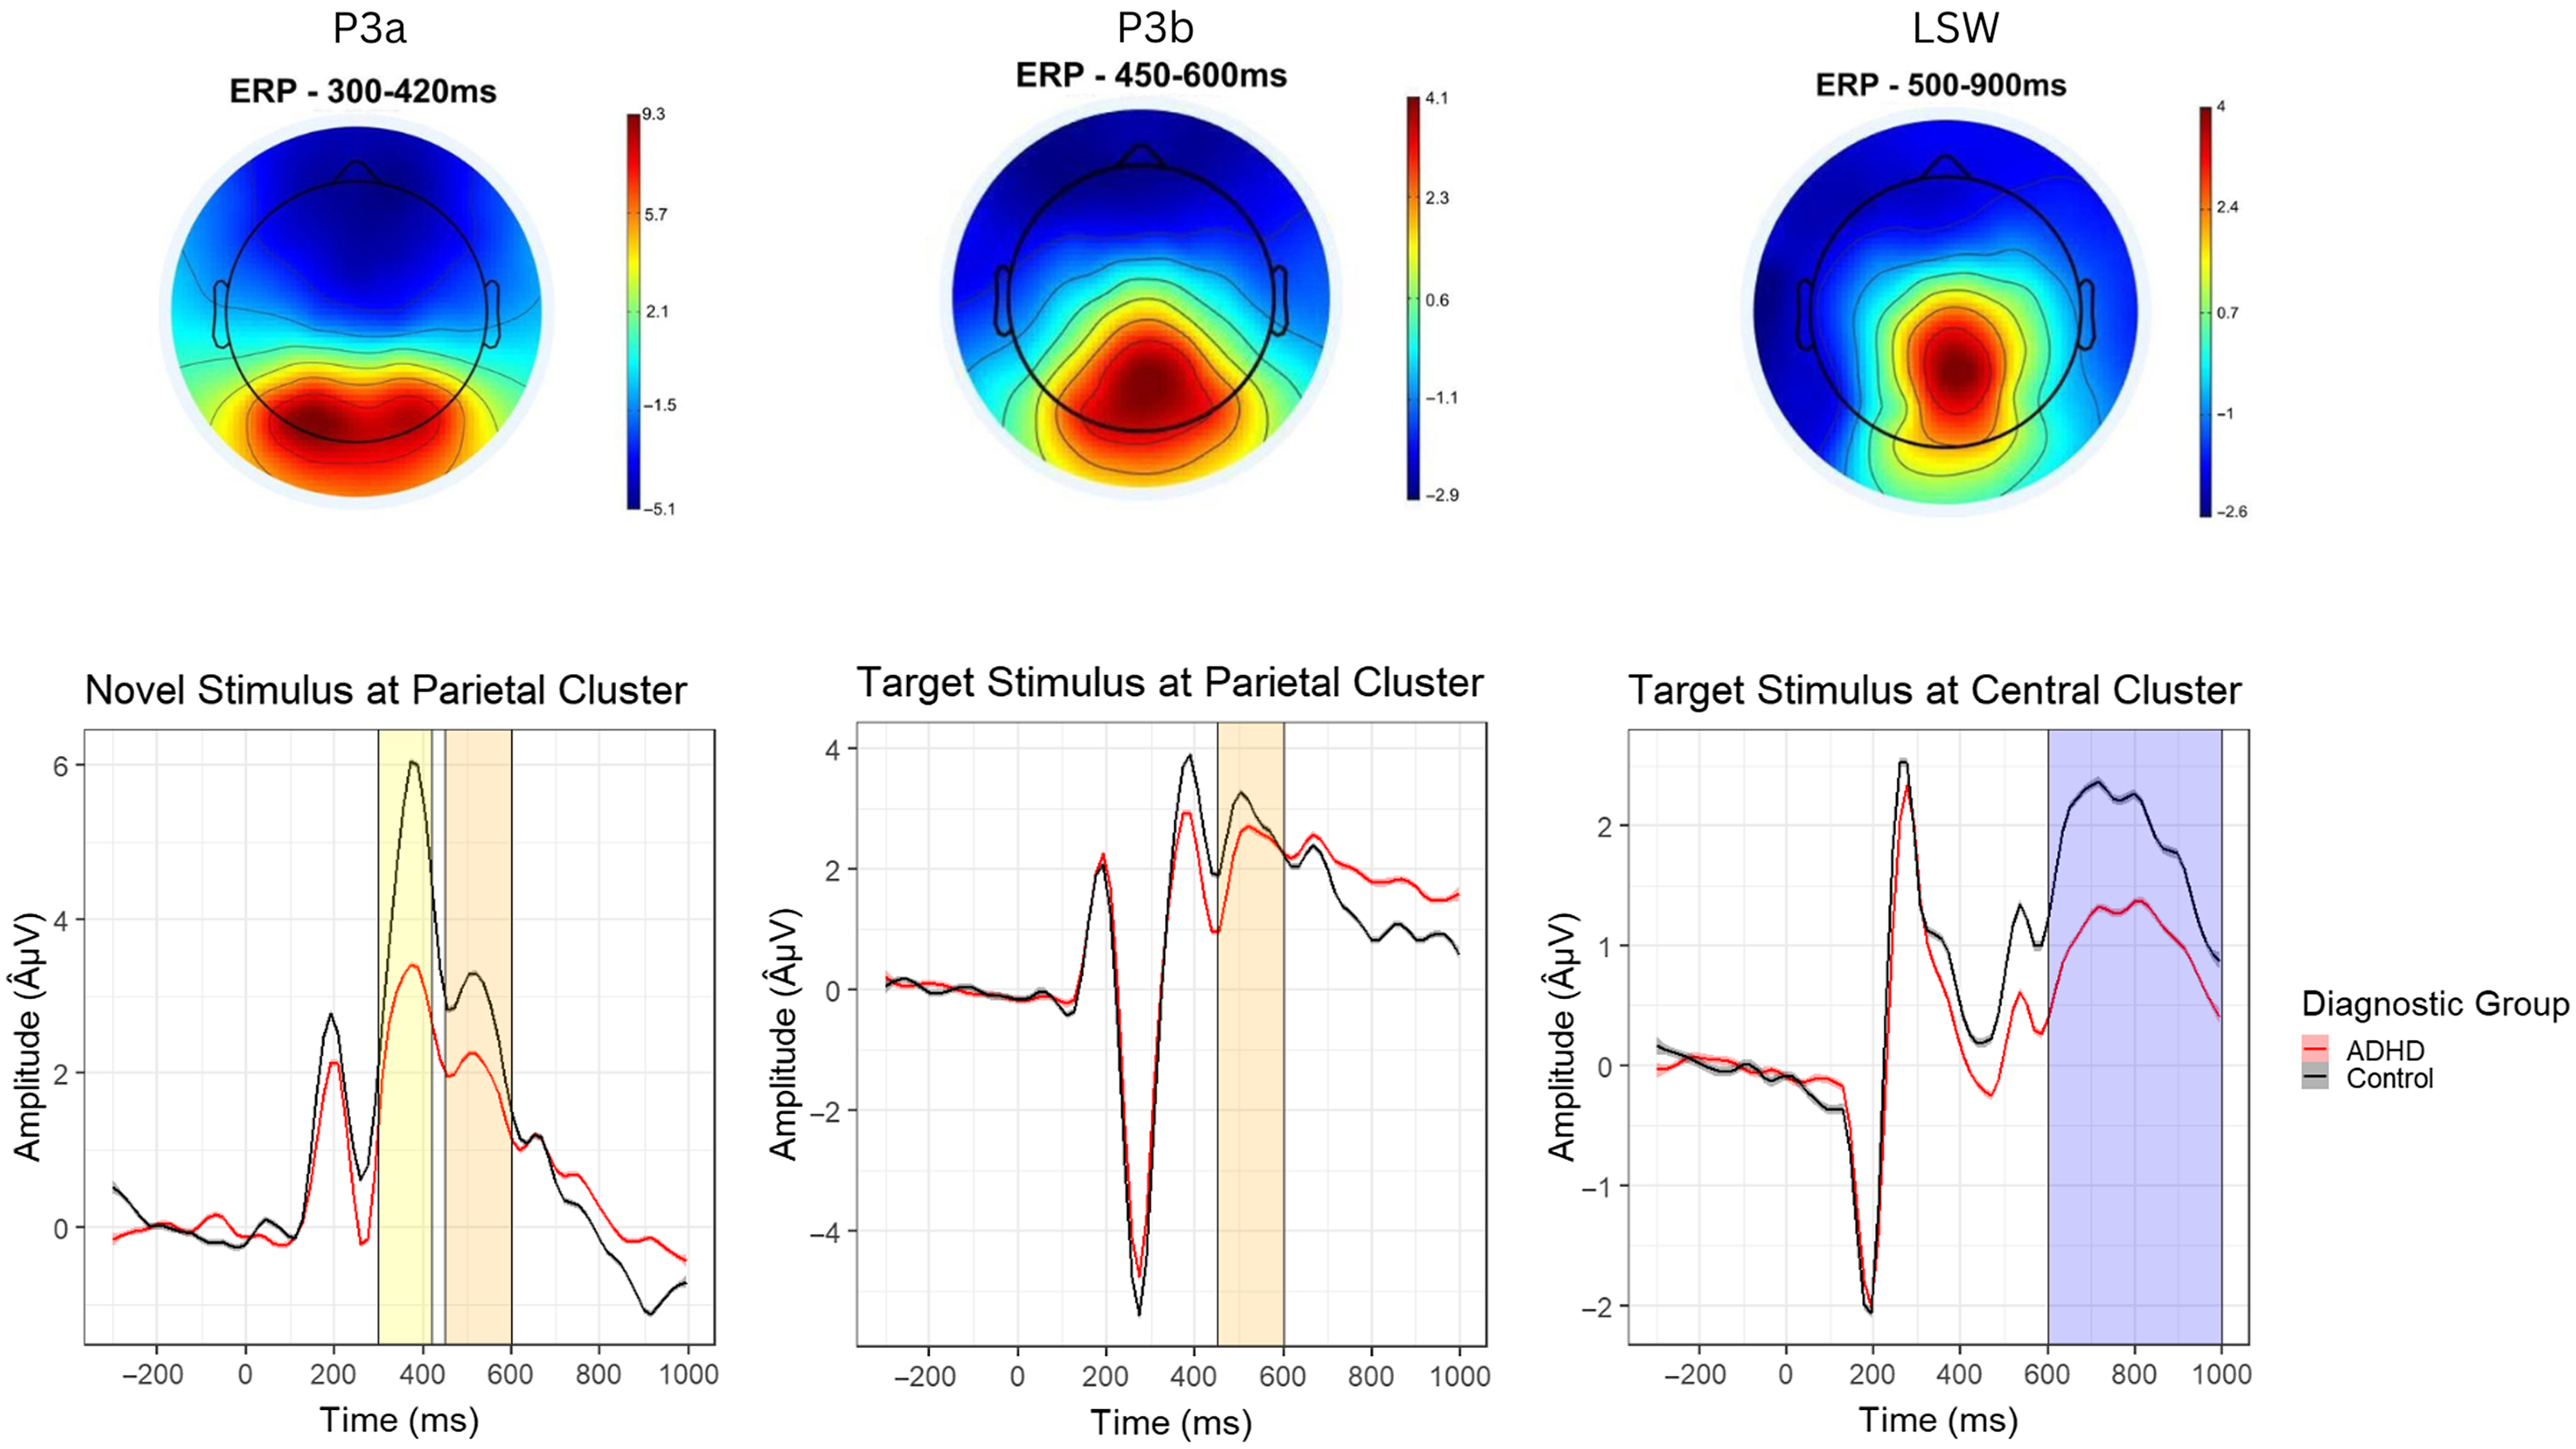
Figure 2. Topographical maps (top) and waveforms (bottom) for the novel P3a, target P3b, and late slow wave (LSW) event related potential (ERP) components.
Statistical Analyses
Statistical analyses were completed in R Studio version 1.4.1717. Descriptive statistics were computed to characterize the sample and evaluate normality of study variables. One variable (LSW) demonstrated excessive skew (>5.0) due to a single outlier; this data point was removed. Confirmatory factor analysis (CFA; R Lavaan package) was used to derive four latent factors representing (a) aperiodic slope, (b) ERP, (c) cognitive control, and (d) ADHD symptoms. The individual latent factors were modeled separately to confirm that the models fit the data before combining all four factors into a single CFA. Missing values were estimated with full information maximum likelihood. Excellent model fit was indicated by at least two of the following: non-significant Chi square, SRMR < .05, and/or CFI > .90. Residual variances and path weights were also examined to determine the fit of indicators with the overall factor. When indices suggested less than excellent fit, modification indices were called to identify parameters that could be revised to improve model fit.
Because our sample size was underpowered to model full structural equation additive, moderation and mediation models, factor scores for aperiodic slope, ERP, cognitive control, and ADHD constructs were derived using the Bartlett method and used in subsequent analyses. First, we examined pairwise comparisons among the factor scores to determine if the models were justified. Next, we planned to examine a series of linear regressions with the ADHD factor score as the dependent variable, and aperiodic slope, ERP and/or cognitive control factors as independent variables.
Results
Confirmatory factor analysis
All hypothesized indicators loaded as expected onto the confirmatory latent factors and independent models fit the data well (Supplementary Materials, Table 2). The combined model likewise demonstrated excellent fit: Δχ2[84] = 105.83, p = 0.054; SRMR = 0.077; CFI = 0.964 (see Supplementary Materials). The final model specified a residual covariance between WISC-5 coding and DKEFS inhibition indicators. Additionally, the residual variance of the novelty P3a amplitude was set to zero due to a negative variance without this restriction. Finally, a residual covariance between inattention and sluggish cognitive tempo symptoms was modeled. The aperiodic slope factor only had two indicators; thus, factor loadings were set to be equal. See Figure 3.
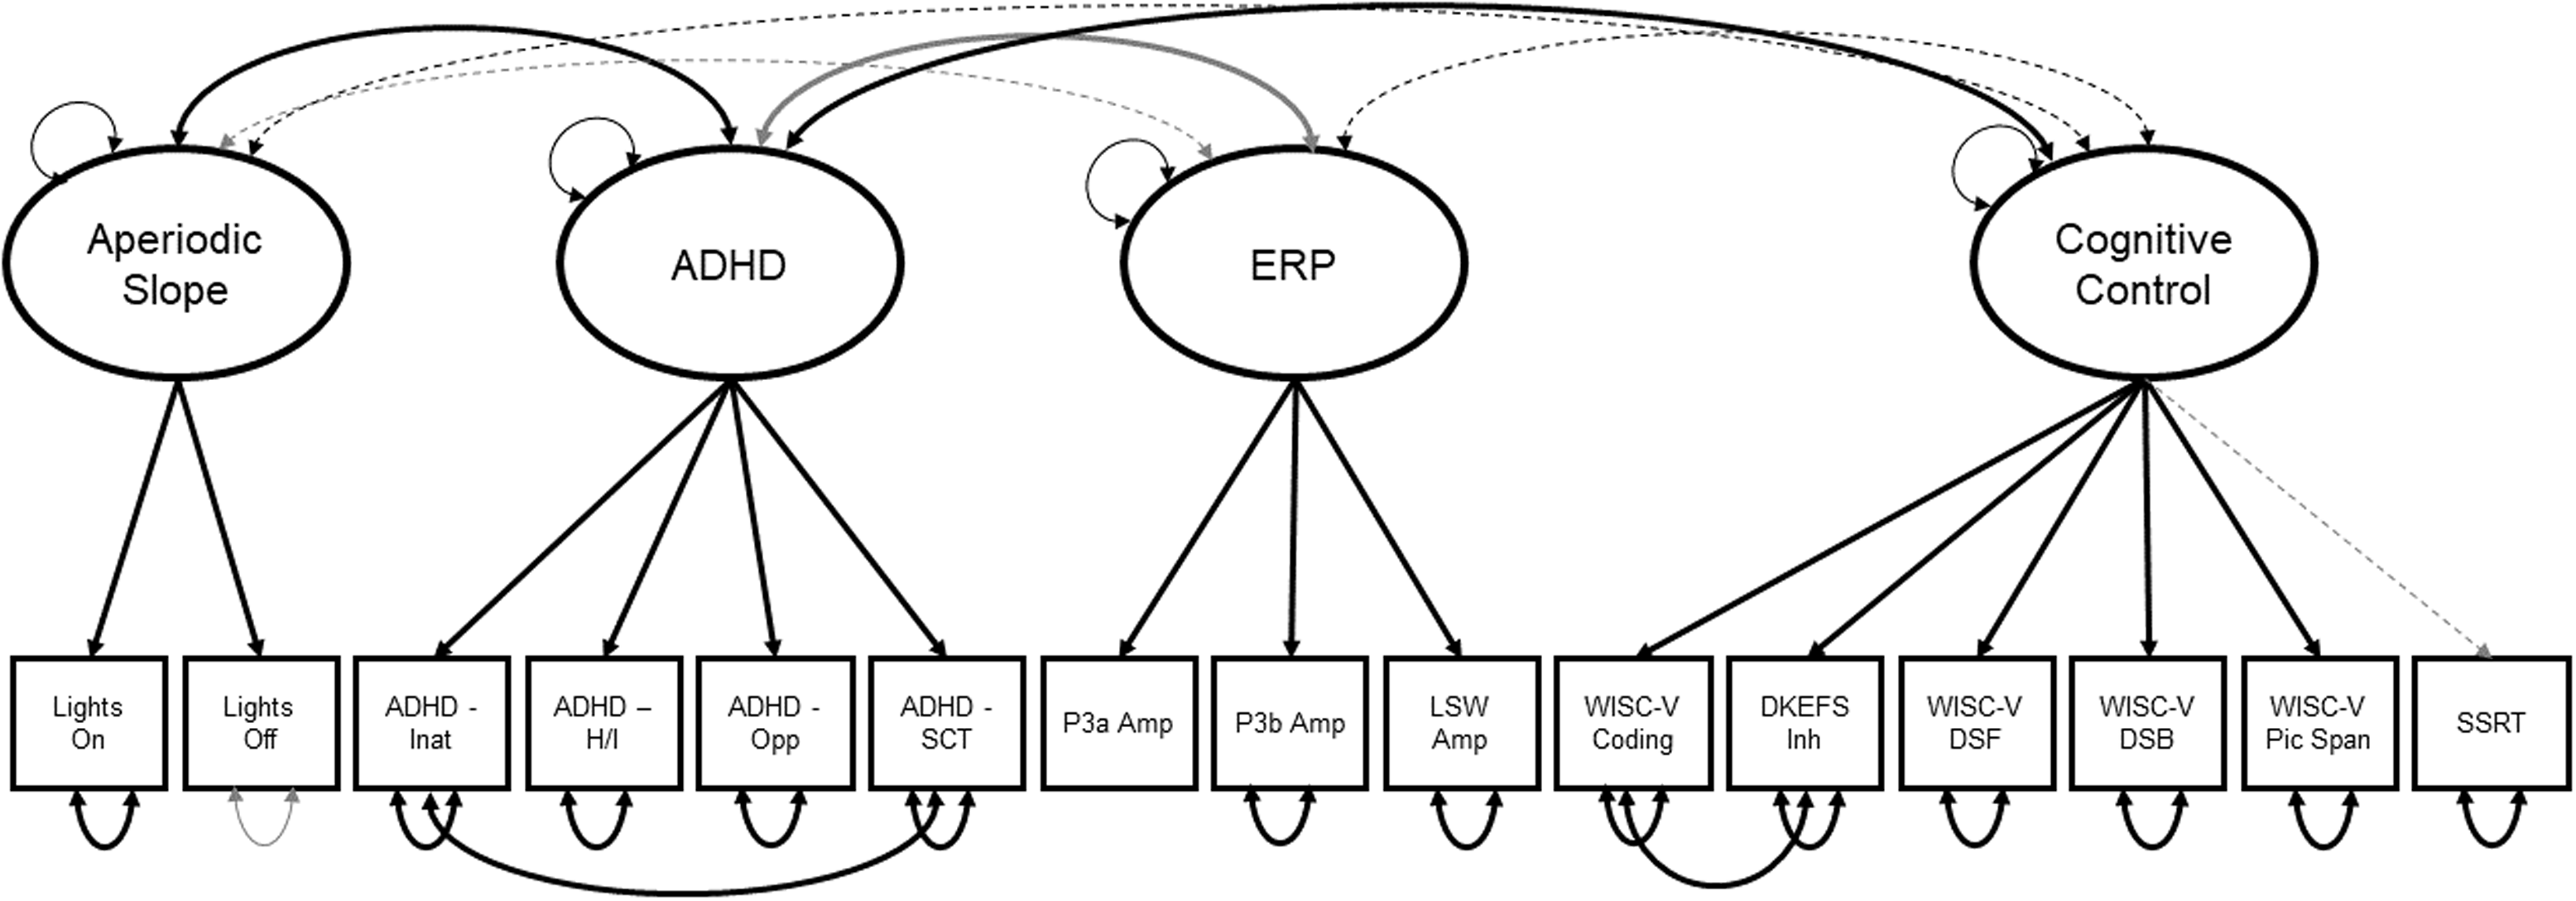
Figure 3. Structural equation model from which the four factor scores were derived. Thick lines indicate path coefficients that are statistically significant at p < .01. Thin, dashed lines indicate non-significant paths. Black lines indicate positive coefficients; gray lines indicate negative coefficients. Coefficient values are not depicted for simplification. Lights on = Lights on resting condition; Lights off = Lights off resting condition; ADHD Inat = Inattentive Symptoms; ADHD H/I = Hyperactive/Impulsive Symptoms; ADHD Opp = Oppositional Defiant Symptoms; P3a Amp = P3a Amplitude; P3b Amp = P3b Amplitude; LSW = Late Slow Wave; DKEFS Inh = DKEFS Color-Word Inhibition; WISC-V DSF = WISC-V Digit Span Forward; WISC-V DSB = WISC-V Digit Span Backwards; WISC-V Pic Span = WISC-V Picture Span; SSRT = Stop-Signal Task Reaction Time.
We tested for measurement invariance between ADHD and TD groups in the full CFA. The model demonstrated configural (Δχ2[85] = 86.39, p = 0.438) and weak factorial (i.e., metric; Δχ2[9] = 13.47, p = 0.143) invariance across groups. However, the model did not show strong factorial (i.e., scalar) invariance (Δχ2[11] = 29.98, p = 0.002). This was anticipated given that a test of strong factorial variance evaluates whether the factor intercepts are equal across groups, and we expected the ADHD and TD groups to differ on the ADHD and cognitive control factor scores, at least. Thus, factor scores were computed from the full model for all individual participants.
Factor score correlations
To evaluate whether our data met the basic assumptions of the additive, moderator, and mediation models, we first computed bivariate Pearson correlations among ADHD, cognitive control, ERP and aperiodic slope variables, as well as two hypothesized covariates, FSIQ and age (Table 1). As predicted (and consistent with the results of the CFA), the ADHD factor was correlated with all other variables. Specifically, greater ADHD symptoms were associated with flatter aperiodic slope, reduced ERP amplitude, lower cognitive control, lower FSIQ, and older age. Contrary to predictions, the ERP, cognitive control and aperiodic slope factors were not significantly correlated. Thus, we moved forward with testing the moderation and additive models, but not the mediation model. Age and FSIQ were included as covariates.
Table 1. Factor score and covariate correlations
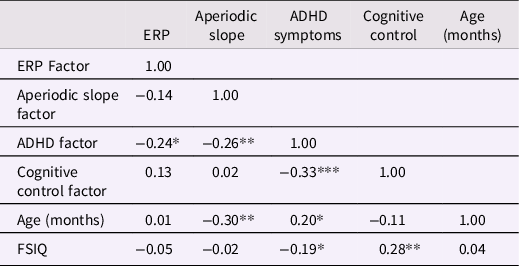
Note. ERP = event related potential; FSIQ = full scale IQ; *p < .05, **p < .01, ***p < .001.
Moderation models
Next, we tested the moderation hypothesis, namely that cognitive control would moderate the association between aperiodic slope and ADHD factors. In the first model, we tested for an interaction between cognitive control and aperiodic slope while controlling for the effects of the ERP factor, age, and FSIQ. The interaction term approached significance: B = 0.14, SE = 0.07, p = .052, indicating that for children with low levels of cognitive control, the association between flatter aperiodic slope and ADHD symptom severity was steeper (Figure 4). This model explained 28% of the variance in ADHD symptoms. In contrast, the interaction between aperiodic slope and the ERP factor, while controlling for the EF factor, age and FSIQ, was not statistically significant (B = −0.05, SE = 0.10, p = .629). Of note, results were similar when the analyses were repeated without including the additional factors as covariates in the models.
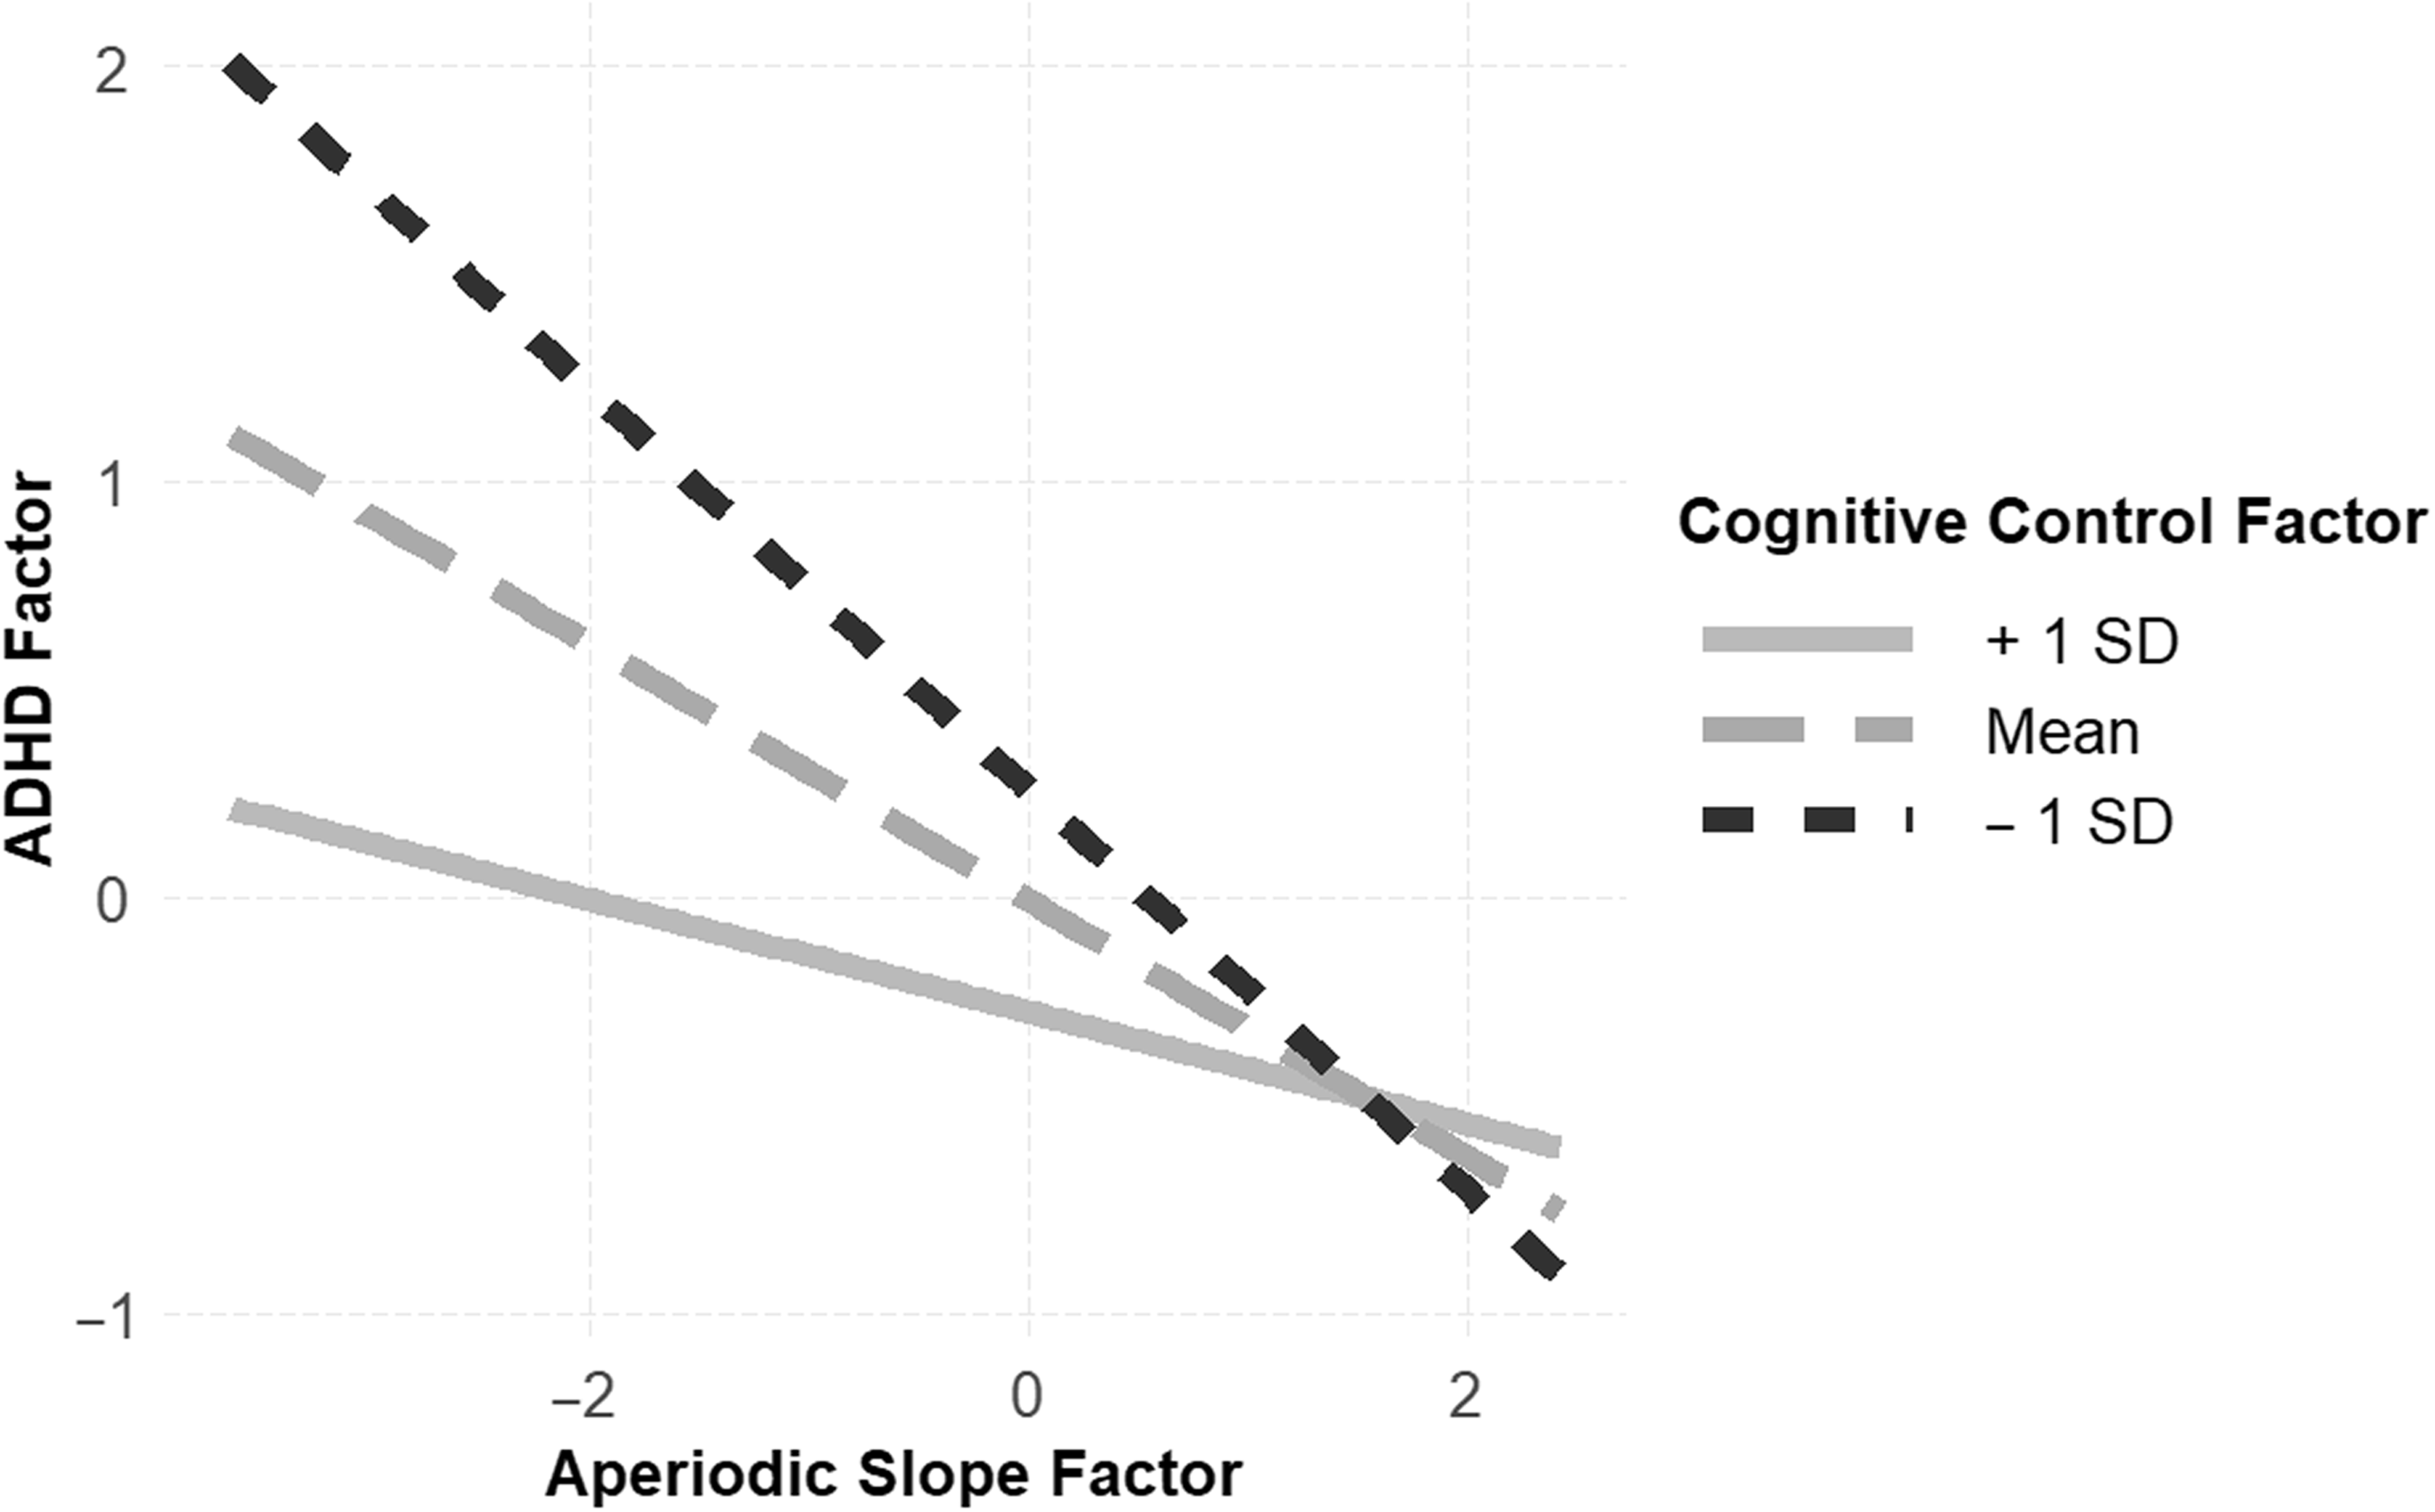
Figure 4. There was evidence to support the moderation model, wherein strong cognitive control (solid gray line) protected against elevated ADHD symptoms in children with atypical aperiodic slope, and reduced cognitive control (dashed black line) exacerbated ADHD symptoms in children with atypical aperiodic slope.
Additive model
Results of the additive linear regressions are reported in Table 2. Consistent with an additive model, the aperiodic slope, cognitive control, and ERP factors each explained unique variance in the ADHD factor, over and above age and FSIQ. The final model had a multiple R 2 = .26 (F[5,97] = 6.67, p < .001), indicating the additive model explained a significant minority of variance in ADHD symptoms.
Table 2. Additive linear regression models
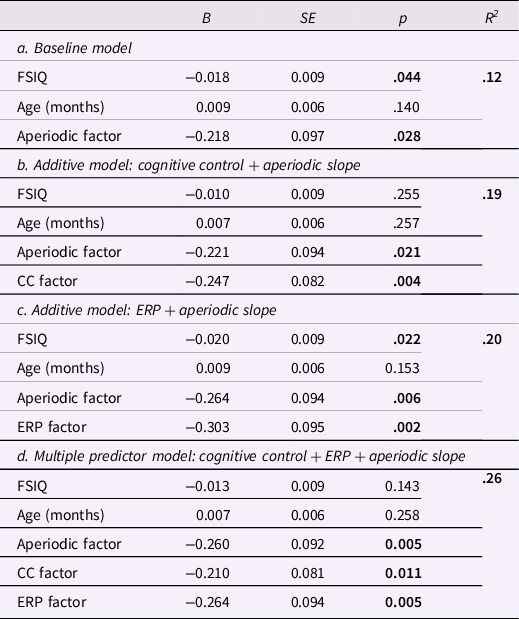
Note. FSIQ = full scale IQ; CC = cognitive control; ERP = event related potential; significant values bolded.
Discussion
Cognitive control describes behaviorally measured neurocognitive skills that allow individuals to flexibly navigate various environmental demands. Impairments in laboratory measures of cognitive control, sometimes referred to as executive functions (Diamond, Reference Diamond2013), have been documented across a range of psychiatric nosologies, highlighting the potential role of cognitive control as a transdiagnostic indicator of psychopathology (Bong et al., Reference Bong, Choi, Kim, Lee and Kim2020; Craig et al., Reference Craig, Margari, Legrottaglie, Palumbi, De Giambattista and Margari2016; O'Hearn et al., Reference O'Hearn, Asato, Ordaz and Luna2008). Children with ADHD commonly present with reduced cognitive control skills; for example, Kofler and colleagues reported that 89% of children with ADHD demonstrated impairment in at least one executive functioning domain (Reference Kofler, Irwin, Soto, Groves, Harmon and Sarver2019). Interestingly, there appears to be neurocognitive heterogeneity such that no single cognitive control impairment is wholly predictive of an ADHD diagnosis (Kofler et al., Reference Kofler, Irwin, Soto, Groves, Harmon and Sarver2019).
In this study, we tested three etiological models for ADHD symptoms, each of which featured cognitive control. Specifically, we examined (a) cognitive control as a mediator of the association between global cortical development and ADHD symptoms, (b) cognitive control as a moderator of the association between global cortical development and ADHD symptoms, and (c) an additive model for the prediction of ADHD symptoms. We considered two indices of cognitive control (ERP amplitudes and neuropsychological assessment), and one indicator of global cortical development (resting aperiodic spectral slope). Informed by the prior literature, we expected the moderation model to best fit the data.
The mediation model was not supported, nor was it tested, because aperiodic slope was not significantly correlated with cognitive control or ERP factors. This was not entirely surprising, given that our measure of aperiodic slope captured neural oscillatory activity across multiple brain regions, rather than focusing on frontal alone. On the other hand, we were surprised to report that the ERP and cognitive control factors were likewise not correlated. Prior work has suggested a significant association between ERPs derived during cognitive control tasks and behavioral measures of cognitive control (Downes et al., Reference Downes, Bathelt and De Haan2017) and ADHD symptoms (Brown et al., Reference Brown, Clarke, Barry, McCarthy, Selikowitz and Magee2005). The discrepancy between prior research and this study is likely attributable to the use of factor scores, rather than individual variables, in our analyses. In school-aged children, published studies have typically focused on associations between specific cognitive control domains and ERP components, often derived from the same task (Downes et al., Reference Downes, Bathelt and De Haan2017). Due to the heterogeneity in cognitive control profiles among children with ADHD, we tested a broader model of overall cognitive control that reflected shared variance across multiple domains of functioning. Of note, post-hoc analyses suggested a significant and positive correlation between the ERP factor score and task accuracy (Pearson’s r = .22, two-tailed p = .024).
Consistent with our a priori hypothesis, there was some evidence to support the notion that behaviorally measured cognitive control modulates the association between non-PFC cortical development (i.e., aperiodic slope) and ADHD symptoms. Specifically, our simple slopes analysis indicated that children with strong cognitive control had a weaker association between atypical cortical development (i.e., flat aperiodic slope) and ADHD symptoms. Importantly, the interaction term only approached significance, suggesting that these results should be interpreted with caution. This finding is corroborated by behavioral genetics research which found that strong cognitive control is a heritable protective factor against ADHD, psychiatric, and learning disorder symptoms in a large sample of twins (Arnett, McGrath, et al., Reference Arnett, McGrath, Flaherty, Pennington and Willcutt2022). Similarly, our research group recently found that strong cognitive control skills served as a protective factor against familial risk for ADHD specifically and general psychopathology broadly (Peisch, Lee, & Arnett, under review). Whereas these prior publications support cognitive control as a moderator of the association between genetic risk and symptoms, the models proposed by Johnson (Reference Johnson2012) and Cole et al. (Reference Cole, Repovš and Anticevic2014) describe interactions among distinct cortical networks. For example, Cole et al. (Reference Cole, Repovš and Anticevic2014) proposed that the frontoparietal control network serves as an “immune system” within the brain, protecting against mental health symptoms. In contrast to this theory, we did not find evidence for an interaction between direct measures of prefrontal cortical functioning and broad cortical development.
The third model tested in this study – an additive model – was also supported by the data. Vulnerabilities in aperiodic slope, ERPs, and cognitive control each explained unique variance in ADHD symptoms. Together they explained slightly less variance than was explained by the moderation model which included all three predictors as well as the interaction between cognitive control and aperiodic slope. These results align with the observation that ADHD is a highly heterogenous disorder (Luo et al., Reference Luo, Weibman, Halperin and Li2019), with multiple possible pathways leading to the same clinical diagnosis (Sonuga-Barke et al., Reference Sonuga-Barke, Auerbach, Campbell, Daley and Thompson2005; Sonuga-Barke, Reference Sonuga-Barke2005). The idea of an additive model has been supported by recent genetic research such that additive genetic variants have been shown to contribute to heritability of ADHD (Demontis et al., Reference Demontis, Walters, Martin, Mattheisen, Als, Agerbo, Baldursson, Belliveau, Bybjerg-Grauholm, Bækvad-Hansen, Cerrato, Chambert, Churchhouse, Dumont, Eriksson, Gandal, Goldstein, Grasby, Grove and Neale2019). Similarly, a multiple deficit model of neuropsychological constructs explains greater variance in ADHD and comorbid disorders than a single deficit model (McGrath et al., Reference McGrath, Peterson and Pennington2020). Research on the genetic etiology of autism has likewise revealed that individuals with “multiple hits,” i.e., multiple inherited and de novo genetic variants, have more severe autism phenotypes (Guo et al., Reference Guo, Wang, Wu, Long, Coe, Li, Xun, Ou, Chen, Duan, Bai, Zhao, Shen, Li, Wang, Zhang, Baker, Liu, Pang and Duan2018, Reference Guo, Duyzend, Coe, Baker, Hoekzema, Gerdts, Turner, Zody, Beighley, Murali, Nelson, Bamshad, Nickerson, Bernier and Eichler2019).
Our results have implications for clinical care of children with ADHD and other disorders known to involve vulnerabilities in cognitive control skills. Clinical assessments for ADHD could consider brain and behavioral data in an effort to increase diagnostic accuracy. In line with this notion, Häger et al. (Reference Häger, Åsberg Johnels, Kropotov, Weidle, Hollup, Zehentbauer, Gillberg, Billstedt and Ogrim2021) had suggested a diagnostic index for pediatric ADHD that combines ERPs and behavioral test scores from a visual go/no-go task; our results support such efforts. In addition to informing assessment approaches, our findings also have implications for clinical interventions. Prior work suggests plasticity in cognitive control skills, indicating that they could be strengthened through preventative and intervention efforts (Zelazo, Reference Zelazo2020). A recently-published meta-analysis of the effects of physical activity interventions on executive functions among individuals with neurodevelopmental disorders concluded that this type of treatment had clinical promise (Sung et al., Reference Sung, Ku, Leung and MacDonald2021). Neurofeedback and cognitive training interventions may also strengthen cognitive control in clinical samples (Kouijzer et al., Reference Kouijzer, de Moor, Gerrits, Congedo and van Schie2009; Steiner et al., Reference Steiner, Frenette, Rene, Brennan and Perrin2014), but concerns about generalizability of these skills and small effect sizes have tempered enthusiasm about these clinical interventions (Louthrenoo et al., Reference Louthrenoo, Boonchooduang, Likhitweerawong, Charoenkwan and Srisurapanont2021). In addition to guiding intervention efforts, our results can inform clinical assessments. Cognitive control domains can be measured in a developmentally-sensitive manner as early as the preschool years (Carlson, Reference Carlson2016); thus, clinical assessments for ADHD should include neuropsychological measures of cognitive control whenever possible.
Findings should be interpreted in the context of this study’s strengths and limitations. We used rigorous assessments and validated measures to capture the main study constructs, which represents a notable strength. Relatedly, these variables represent multiple levels of analyses: brain activity, neuropsychological functioning, and symptoms. As mentioned above, the use of latent factors to derive estimates of neural activation, cognitive control, and ADHD symptoms also represents a strength and could help address heterogeneity reported in prior work. Unlike prior work, our ADHD factor reflected heterogeneity in the phenotypic presentation of the disorder: we included sluggish cognitive tempo and oppositional defiant symptoms as indicators in addition to the core symptoms of hyperactivity/impulsivity and inattention. Regarding limitations, it is important to note that the sample reflected the local ethnic and racial composition and may not be representative of the overall US populations. It is also important to acknowledge that our cross-sectional data do not support causal inferences and that our best model only accounted for 28% of variance in ADHD symptoms. Lastly, we focused only on a few neurocognitive correlates of ADHD; there are many variables we did not measure, the inclusion of which could reveal additional mediating, moderating, or additive effects. For example, characteristics of the home environment (Gould et al., Reference Gould, Coventry, Olson and Byrne2018) and parental ADHD (Johnson, Reference Johnson2012), have been shown to moderate severity of ADHD symptoms in the child.
To fully test the three etiological models discussed here, longitudinal work, preferably with very young children at risk for ADHD, is necessary. Prospective longitudinal studies with young children at risk for ADHD could help identify developmental cascades that explain individual differences in the pathways from genetic risk to neurocognitive dysfunction and ultimately, developmental outcomes. In an effort to expand what is known about cognitive control as a transdiagnostic marker, future research should also include individuals with other disorders, particularly neurodevelopmental disorders, such as autism spectrum disorder. Similarly, additional indices of cortical activity, such as error processing, should be considered in association with cognitive control and psychiatric symptoms. The idea of cognitive control as a moderator of ADHD risk should be further tested with more distal factors as independent predictors, such as genetic risk (e.g., polygenic risk scores).
In conclusion, our study supports the view that cognitive control features prominently in the etiology of pediatric ADHD and that research should continue to explore associations between different indices of cortical functioning, behavior, and psychiatric symptoms. In line with the RDoC framework, our results support the utility of considering core constructs, such as cognitive control, at multiple levels of analysis.
Supplementary material
The supplementary material for this article can be found at https://doi.org/10.1017/S095457942200116X
Funding statement
This research was funded by grants to A.B.A. from the National Institute of Mental Health (K99MH116064-01A1 and R00MH116064-01A1).
Conflicts of interest
None.

