


1. Introduction
Over the past two decades, the words “maker” and “makerspace” have become increasingly common in English vocabulary. Dale Dougherty, the man credited with popularizing the maker movement, explains that few people call themselves inventors, but many identify themselves as makers in some sense (Dougherty Reference Dougherty2012). Making encapsulates a myriad of activities, including hardware, software, textiles and even cooking. Makerspaces exist as collaborative workspaces where people of diverse backgrounds but similar interests gather to work on projects and share ideas, skills and equipment. They may house a wide array of tools, including 3D printers, laser cutters, wood and metal working machinery, computers, electronics and craft equipment. Today, makerspaces can be found in many different places, including K-12 (primary and secondary) schools, museums, libraries, community centers and college campuses (Peppler & Bender Reference Peppler and Bender2013).
Prior studies of academic makerspaces have shown that they are a tremendous asset to engineering curriculum and offer many positive benefits such as increased design self-efficacy (Galaleldin et al. Reference Galaleldin, Bouchard, Anis and Lague2017; Hilton et al. Reference Hilton, Tomko, Murphy, Nagal and Linsey2018, Reference Hilton, Talley, Smith, Nagel and Linsey2020; Carbonell et al. Reference Carbonell, Andrews, Boklage and Borrego2019), motivation (Nadelson et al. Reference Nadelson, Villanueva, Bouwma-Gearhart, Lanci, Youmans, Lenhart and Van Winkle2019; Hilton et al. Reference Hilton, Talley, Smith, Nagel and Linsey2020; Bouwma-Gearhart et al. Reference Bouwma-Gearhart, Ha Choi, Lenhart, Villanueva, Nadelson and Soto2021), innovation (Longo, Yoder & Geurra Reference Longo, Yoder and Geurra2017; Bouwma-Gearhart et al. Reference Bouwma-Gearhart, Ha Choi, Lenhart, Villanueva, Nadelson and Soto2021) and communication (Nadelson et al. Reference Nadelson, Villanueva, Bouwma-Gearhart, Lanci, Youmans, Lenhart and Van Winkle2019; Bouwma-Gearhart et al. Reference Bouwma-Gearhart, Ha Choi, Lenhart, Villanueva, Nadelson and Soto2021) to the students who use them. Given all these affordances, it is critical that makerspace staff invest in studying their makerspaces to keep them as welcoming and effective as possible. Ongoing work is being done to understand student tool usage in makerspaces toward this end (Blair et al. Reference Blair, Banks, Linsey and Layton2021, Reference Blair, Banks, Hairtson, Linsey and Layton2022a,Reference Blair, Banks, Hairtson, Linsey and Layton b).
This article focuses on understanding how makerspaces react to disruptions, which in this case occurs in the form of increased restrictions. COVID-19 cases increased rapidly in early 2020, college campuses closed their doors and university makerspaces were shut down (Smalley Reference Smalley2021). When colleges slowly opened back up, makerspaces experienced immense restrictions, changing the way they were operated and used by students (Bill & Fayard Reference Bill and Fayard2021; Lieber, Suriano & Brateris Reference Lieber, Suriano and Brateris2021). This provided a unique opportunity to study how makerspaces handle disruptions and gave insight into identifying and reacting to future disturbances.
Historically, makerspaces have been studied primarily through sign-in systems (Imam, Ferron & Jarriwala Reference Imam, Ferron and Jarriwala2018; Harmer & Kaip Reference Harmer and Kaip2019; Cooke & Charnas Reference Cooke and Charnas2021), interviews (Linsey et al. Reference Linsey, Forest, Nagel, Newstetter, Talley and Smith2016; Tomko et al. Reference Tomko, Nagel, Linsey and Aleman2017; Harmer & Kaip Reference Harmer and Kaip2019) and surveys (Culpepper & Hunt Reference Culpepper and Hunt2016; Linsey et al. Reference Linsey, Forest, Nagel, Newstetter, Talley and Smith2016; Imam et al. Reference Imam, Ferron and Jarriwala2018; Cooke & Charnas Reference Cooke and Charnas2021). Collecting sign-in data is the most common of these, with most makerspaces implementing some form of electric sign-in system (Imam et al. Reference Imam, Patel, Ferron and Jarriwala2017). Students may be asked to swipe their college ID card (Imam et al. Reference Imam, Patel, Ferron and Jarriwala2017; Schoop et al. Reference Schoop, Huang, Khuu and Hartmann2018; Cooke & Charnas Reference Cooke and Charnas2021), enter a people counting system such as a turnstile (Linsey et al. Reference Linsey, Forest, Nagel, Newstetter, Talley and Smith2016; Imam et al. Reference Imam, Ferron and Jarriwala2018; Cooke & Charnas Reference Cooke and Charnas2021) or manually login via a tablet or computer (Harmer & Kaip Reference Harmer and Kaip2019; Cooke & Charnas Reference Cooke and Charnas2021). These studies seek to measure the impact of makerspaces, often with the implied goals of increasing impact and understanding who is benefiting. While these methods provide knowledge about user demographics, motivations and tool usage, they fail to provide an overall quantitative metric of health that can be compared across semesters. In this article, we explore the use of the metrics from network analysis of modularity, nestedness and connectance to provide an overall quantitative assessment of the makerspace health, analogous to the use of these metrics for describing the health of ecosystems.
To obtain quantitative metrics over the overall health of the space, makerspaces are modeled here as bipartite networks, with two unique actor groupings, users and the tools. The only interactions modeled are the ones occurring between the two groups. NASA has used similarly based approaches to map the innovation space of different teams working on the NASA International Space Apps Challenge to understand the transfer of information (Senghore et al. Reference Senghore, Campos-Nanez, Fomin and Wasek2015). Neuron-to-synapse interactions in neural networks, airport–flight transportation networks and plant–pollinator interactions in ecosystems have also all been historically modeled as bipartite networks (Guimerà et al. Reference Guimerà and Amaral2005; Olesen et al. Reference Olesen, Bascompte, Dupont and Jordano2007; Barber et al. Reference Barber, Faria, Streit and Strogan2008). The popularity stems from the effectiveness of network models as visualization tools that highlight the importance of network structures to the phenomena being studied (Newman, Forrest & Balthrop Reference Newman, Forrest and Balthrop2002; Smith-Doerr, Manev & Rizova Reference Smith-Doerr, Manev and Rizova2004; Casper & Murray Reference Casper and Murray2005; Latapy, Magnien & Vecchio Reference Latapy, Magnien and Vecchio2006; Wang et al. Reference Wang, Li, Wang and Pan2012; Alsamadani, Hallowell & Javernick-Will Reference Alsamadani, Hallowell and Javernick-Will2013). Metrics commonly used for understanding bipartite networks include modularity, nestedness and connectance. They are used here in addition to survey data to evaluate and quantify makerspace health (Bascompte et al. Reference Bascompte, Jordano, Melián and Olesen2003; Ulrich, Almeida-Neto & Gotelli Reference Ulrich, Almeida-Neto and Gotelli2009; Heleno, Devoto & Pocock Reference Heleno, Devoto and Pocock2012; Matthews, Cottee-Jones & Whittaker Reference Matthews, Cottee-Jones and Whittaker2015). Here, we use an analogous definition of makerspace health to health in an ecosystem where there is a lot of interaction between actors, in this case, tools and students, and the system is robust to disturbance. Lots of interactions with tools generally means students are learning more. Nestedness has been used to predict the stability of bipartite networks to perturbations, for example, predicting the failure rate of global trading companies based on their roles in larger industrial networks (Bustos et al. Reference Bustos, Gomez, Hausmann and Hidalgo2012; Mariani et al. Reference Mariani, Ren, Bascompte and Tessone2019), finding that a drop in nestedness was a precursor to a company’s disappearance/replacement. Ecologists studying mutualistic networks in nature, such as plant–pollinator networks, use these metrics to understand network structure for conservation purposes (Bascompte et al. Reference Bascompte, Jordano, Melián and Olesen2003). These biological mutualistic networks’ resistance to disturbances has been found to relate to the levels of modularity and nestedness of their interaction architectures (Olesen et al. Reference Olesen, Bascompte, Dupont and Jordano2007; Martin et al. Reference Martin, Feit, Requier, Friberg, Jonsson, Bohan and Dumbrell2019). They are here extended to a bipartite makerspace network model to quantify students’ interactions with tools in the space and relate interaction patterns with makerspace health.
Three main research questions addressed in this study will allow makerspaces to be better prepared for future disturbances, both expected and unexpected, and maintain a consistent way of monitoring makerspace health:
RQ1: How are academic makerspaces and student usage patterns affected by large scale disruptions?
RQ2: Do network analysis metrics such as modularity, nestedness and connectance provide meaningful insights into makerspace health?
RQ3: What can makerspaces do to address poor makerspace health, especially when caused by external disruptions?
2. Background
2.1. Benefits of academic makerspaces
Makerspaces have become increasingly popular in recent years (Lou & Peek Reference Lou and Peek2016) and what began as a grassroots community-based movement is now prevalent in more formal applications, including K-12 schools (kindergarten to twelfth grade) and universities (Halverson & Sheridan Reference Halverson and Sheridan2014). While many college campuses already contain the individual elements of a makerspace – machine shops, collaborative workspaces, testing labs, etc., often they combine those elements into cohesive makerspaces (Wilczynski Reference Wilczynski2015).
A variety of empirical studies have shown that makerspaces provide immense benefits to the students who use them by giving the students the opportunity to learn both by doing and through others (Tomko et al. Reference Tomko, Alemán, Nagel, Newstetter and Linsey2023). This produces and strengthens cognitive, intrapersonal and interpersonal skills (Tomko et al. Reference Tomko, Alemán, Nagel, Newstetter and Linsey2023). A 5-year longitudinal study conducted at three university makerspaces found a strong positive correlation between student involvement in makerspaces and engineering design self-efficacy (Sawchuk et al. Reference Sawchuk, Hilton, Nagel and Linsey2019). This could be because highly motivated and confident students are more likely to become involved in makerspaces or because makerspaces improve students’ motivation and confidence. Additionally, students who participated in university makerspaces were found to be less anxious about performing engineering design-related tasks (Morocz et al. Reference Morocz, Levy, Forest, Nagel, Newstetter, Talley and Linsey2016), to have higher expectations of success (Hilton et al. Reference Hilton, Tomko, Murphy, Nagal and Linsey2018; Hilton et al. Reference Hilton, Talley, Smith, Nagel and Linsey2020) and to have higher GPAs in engineering courses (Hilton, Nagel & Linsey Reference Hilton, Nagel and Linsey2018). On top of this, requiring makerspace usage as part of an academic class increases student’s likelihood of voluntarily continuing to be involved within the space (Sawchuk et al. Reference Sawchuk, Hilton, Nagel and Linsey2019).
A study conducting interviews at six university makerspaces showed that makerspaces provide students with a wide array of affordances, including the opportunity to complete hands-on, iterative projects with real impact (Bouwma-Gearhart et al. Reference Bouwma-Gearhart, Ha Choi, Lenhart, Villanueva, Nadelson and Soto2021). Students speak of how makerspaces improved their communication, creativity, teamwork and engineering skills (Galaleldin et al. Reference Galaleldin, Bouchard, Anis and Lague2017; Bouwma-Gearhart et al. Reference Bouwma-Gearhart, Ha Choi, Lenhart, Villanueva, Nadelson and Soto2021; Tomko et al. Reference Tomko, Alemán, Nagel, Newstetter and Linsey2023). Innovation is fueled in makerspaces due to intrinsically motivated participants, unstructured activities and a diverse, multi-disciplinary culture (Farritor Reference Farritor2017). Makerspaces also provide students with an environment where it is permissible to experiment, and a sense of autonomy is encouraged (Nadelson et al. Reference Nadelson, Villanueva, Bouwma-Gearhart, Lanci, Youmans, Lenhart and Van Winkle2019; Bouwma-Gearhart et al. Reference Bouwma-Gearhart, Ha Choi, Lenhart, Villanueva, Nadelson and Soto2021).
Longo et al. notes the positive impact university makerspaces have on both the individual student and the university as a whole. According to a survey sent to engineering deans and chairs, makerspaces may help make engineering attractive to a diverse group of students and improve student retention in engineering (Longo et al. Reference Longo, Yoder and Geurra2017). Makerspaces have been highlighted as “hubs of community” (Taylor, Hurley & Connolly Reference Taylor, Hurley and Connolly2016) where makers gather together with like-minded individuals to enjoy simply making something new. Similarly, students note that makerspaces provide a sense of comfort and belonging as well as a location for social gathering where they can meet others with similar interests (Bouwma-Gearhart et al. Reference Bouwma-Gearhart, Ha Choi, Lenhart, Villanueva, Nadelson and Soto2021).
2.2. Barriers to entry in academic makerspaces
Despite the vast benefits available to those who use academic makerspaces, many students still face both real and perceived barriers that can make them hesitant to enter (or entirely prevent them from entering) such spaces. Common barriers to entry include lack of knowledge (Lewis Reference Lewis2015; Noel, Murphy & Jariwala Reference Noel, Murphy and Jariwala2016; Hunt, Goodner & Jay Reference Hunt, Goodner and Jay2019; Jennings et al. Reference Jennings, Coley, Boklage and Kellam2019), unfriendly or unknowledgeable staff (Jennings et al. Reference Jennings, Coley, Boklage and Kellam2019; Bravo & Breneman Reference Bravo and Breneman2022), an intimidating atmosphere (Lewis Reference Lewis2015; Noel et al. Reference Noel, Murphy and Jariwala2016; Lam et al. Reference Lam, Cruz, Kellam and Coley2019), unclear membership pathways (Whyte & Misquith Reference Whyte and Misquith2017; Smit & Fuchsberger Reference Smit and Fuchsberger2020; Bravo & Breneman Reference Bravo and Breneman2022) and a lack of information regarding equipment usage (Noel et al. Reference Noel, Murphy and Jariwala2016). Bravo et al. summarize other potential barriers such as cost, eligibility requirements, hours of operation, physical location, makerspace size and financial status of the user (Bravo & Breneman Reference Bravo and Breneman2022). All these factors should be carefully considered when running a makerspace, giving special attention to them during disruptions that may heighten their effect.
2.3. Effects of COVID-19 on college students and makerspaces
The COVID-19 pandemic presented a variety of hardships for some college students, including food insecurity, financial trouble, return to volatile home circumstances and added domestic responsibilities (Lederer et al. Reference Lederer, Hoban, Lipson, Zhou and Eisenberg2021). Difficulty in living arrangements was a large factor impacting student’s confidence in learning during this time (Bartolic et al. Reference Bartolic, Matzat, Tai, Burgess, Boud, Craig, Archibald, De Jaeger, Kaplan-Rakowski, Lutze-Mann, Polly, Roth, Heap, Agapito and Guppy2022). Students also missed out on typical collegiate experiences both inside and outside the classroom that have been shown to effect sense of belonging (Lederer et al. Reference Lederer, Hoban, Lipson, Zhou and Eisenberg2021) and thus social, psychological and academic outcomes (Hausmann, Schofield & Woods Reference Hausmann, Schofield and Woods2007; Lewis et al. Reference Lewis, Stout, Finkelstein, Pollock, Miyake, Cohen and Ito2017; Korpershoek et al. Reference Korpershoek, Canrinus, Fokkens-Bruinsma and de Boer2020). Social support is directly related to well-being, and COVID-19 forced students to change their typical methods of connecting (Saltzman, Hansel & Bordnick Reference Saltzman, Hansel and Bordnick2020).
The shutdown surrounding the COVID-19 pandemic also caused immense difficulty for makerspace administration. Makerspaces thrive off community, collaboration and hands-on experience, all of which were hard to generate during this time. Many professors were halfway through teaching courses that relied on makerspace usage and were forced to be creative and innovative as they sought to keep their students safe while minimizing the impact to education. Some worked with the makerspace staff to implement a use request system (Boklage, Carbonell & Andrews Reference Boklage, Carbonell and Andrews2022) or to provide kits students could use at home (Melo, March & Hirsh Reference Melo, March and Hirsh2021; Boklage et al. Reference Boklage, Carbonell and Andrews2022). Others shifted to increased emphasis on literature review and engineering analysis instead of physical prototyping (Boklage et al. Reference Boklage, Carbonell and Andrews2022). A unique approach implemented at one school was remote control of digital fabrication machines such as laser cutters, 3D printers and vinyl cutters (Kinnula et al. Reference Kinnula, Sánchez Milara, Norouzi, Sharma and Iivari2021). It was found that instructional mode did not change students’ interest and enjoyment of engineering, but it did decrease their sense of belonging and sense of practicality in engineering (Lewis et al. Reference Lewis, Hawkins, Tretter, Chan and Robinson2022), both of which are improved in academic makerspaces.
When students began returning to college campuses in Fall 2020, some makerspaces re-opened to students, but with very different guidelines and functionality. Many increased their cleaning protocols, enforcing rules such as daily cleaning times, workbenches for backpacks and wipeable covers on computer keyboards (Bill & Fayard Reference Bill and Fayard2021; Kinnula et al. Reference Kinnula, Sánchez Milara, Norouzi, Sharma and Iivari2021; Lieber et al. Reference Lieber, Suriano and Brateris2021). Universities also went to great efforts to space out students in makerspaces by adding occupancy limits, separating workbenches, using acrylic barriers, rearranging equipment and adding floor markings to direct traffic through the space (Bill & Fayard Reference Bill and Fayard2021; Lieber et al. Reference Lieber, Suriano and Brateris2021). Some started or continued to use hybrid training models, such as videos uploaded on the school’s learning management system (Bill & Fayard Reference Bill and Fayard2021; Kinnula et al. Reference Kinnula, Sánchez Milara, Norouzi, Sharma and Iivari2021). Additionally, many schools utilized sign-in and reservation systems so that students could reserve space to work ahead of time (Bill & Fayard Reference Bill and Fayard2021; Kinnula et al. Reference Kinnula, Sánchez Milara, Norouzi, Sharma and Iivari2021).
2.4. Network analysis as a method to study makerspaces
The implementation of network analysis for modeling academic makerspaces can provide unique insights connecting space structure and functioning, a viewpoint that cannot be obtained simply by survey analysis. Modeling the space as a network gives interested parties access to quantitative metrics and techniques that can provide useful information when making operational decisions, such as identifying critical actors. In the case of makerspaces, this might look like tools that should be given special attention, possibly ensuring multiples are purchased in case of required maintenance or high use. The current study here includes “hanging out” as a tool, with the goal of understanding the impact of organizing a makerspace’s tools in such a way that enables more casual/lower PPE (Personal Protective Equipment) zones where students can network with each other and develop communities. Prior work using network analysis and ecological metrics to analyze a makerspace has yielded valuable insights (Bascompte & Jordano Reference Bascompte and Jordano2007; Blair et al. Reference Blair, Banks, Linsey and Layton2021, Reference Blair, Banks, Hairtson, Linsey and Layton2022a,Reference Blair, Hairston, Banks, Linsey and Layton b).
Quantitative network metrics that are used to connect structure to function in bipartite networks include modularity, nestedness and connectance. Modularity provides an understanding of how networks are partitioned by identifying groups, or modules, of actors based on their interactions. Hub actors are those that are highly connected across the network, while specialized actors have only a few interactions and may be considered dangerously disconnected (Guimerà & Amaral Reference Guimerà and Amaral2005; Guimerà & Nunes Amaral Reference Guimerà and Nunes Amaral2005). Nestedness is a measure of structure, both how connected actors in a network are and where those connections are placed. Highly nested networks have “generalist” actors interacting with “specialist” actors that create a network resistant to change (Bascompte et al. Reference Bascompte, Jordano, Melián and Olesen2003; Ulrich et al. Reference Ulrich, Almeida-Neto and Gotelli2009; Matthews et al. Reference Matthews, Cottee-Jones and Whittaker2015; Mariani et al. Reference Mariani, Ren, Bascompte and Tessone2019). For makerspaces, this allows researchers to identify generalist and specialist tools and how they interact. A highly nested makerspace implies that most students will use generalist tools, some students will use generalist tools as well as more specialized tools and a few students will use almost all the tools (generalists as well as highly specialized) in the space. Connectance provides a picture of interaction levels in a network with respect to the total possible number of interactions that could be occurring (Heleno et al. Reference Heleno, Devoto and Pocock2012; Poisot & Gravel Reference Poisot and Gravel2014). Connectance of a makerspace represents the ratio of actual interactions between students and tools to the total possible number of interactions between students and tools (calculated as number of students multiplied by number of tools). Higher connectance (closer to one) means greater tool usage by more students (Heleno et al. Reference Heleno, Devoto and Pocock2012; Poisot & Gravel Reference Poisot and Gravel2014). A connectance value of 0 indicates no interactions exist within the space. High nestedness requires a highly connected network, although high connectance does not guarantee high nestedness (Fortuna et al. Reference Fortuna, Stouffer, Olesen, Jordano, Mouillot, Krasnov, Poulin and Bascompte2010).
3. Methods
3.1. Locations of research
Two large R1 university makerspaces, with very different purposes and operation, were examined as case studies (referred to as School A and School B). Table 1 summarizes the primary differences.
Table 1. Makerspace structure at School A versus School B

School A is a large, public research university in the Southwest United States, with roughly 30% of the undergraduate students enrolled in engineering majors. The makerspace is a 61,000 ft2 facility located inside a general engineering building and includes a full machine shop. Free membership is available for undergraduate engineering majors, and paid access is permitted on rare occasions for graduate students conducting research experiments. Eligible students may gain access to the design and build regions after completing an online orientation and passing a safety quiz. This allows them to use electronics benches, 3D printers, hand tools, project workspaces, CAD computers and some woodworking tools. Additional training is required to gain access to the fabrication space, which includes welding tools and metal fabrication equipment such as mills, lathes and waterjets. Undergraduate engineering students may also submit service requests to have a part fabricated by trained machinists. The makerspace is primarily staff-run, but some student workers are paid to help carry out fabrication requests and give tours. The facility may only be used for class and competition team purposes, but students are welcome to attend free workshops to learn how to use the tools regardless of class enrollment or club participation. Personal projects were previously allowed, but this was discontinued after COVID-19. Any person who enters any part of the space is required to wear safety glasses, closed-toed shoes and long pants that cover the shoelaces. Students are given a 3D print filament stipend but are otherwise expected to bring their own materials.
School B is a large, public research university in the Southeast United States, with roughly 47% of the undergraduate students enrolled in engineering majors. The 5,482 ft2 makerspace is in one of the mechanical engineering buildings but is open to any students, faculty or staff members. Adjacent to the makerspace is a 6,235 ft2 machining mall that contains lathes, mills, electric discharge machines (EDMs) and other similar equipment operated by machinists. The machining mall is unassociated with the makerspace but exists to fabricate parts for research purposes. They also provide equipment training on tools such as metal lathes and manual mills for students who are interested. The makerspace may be used for academic, research, club or personal purposes without cost, but they are not permitted to sell anything that they make within the space. The only entry requirement is that students sign a safety agreement. Most tools are available for general use when someone enters the space, but some of the more advanced machines including the mills, lathes, resin 3D printers, embroidery machine and circuit board plotter require advanced trainings prior to independent use. These advanced trainings can be given for walk-in users if there are qualified staff members available or scheduled using QR codes posted in the space. The makerspace is run by student volunteers who staff the space in exchange for after-hours access to the equipment. The students who are on staff teach new users how to operate tools that they are not familiar with and advise them on their projects. Users must bring their own wood or metal for subtractive manufacturing projects, but 3D printer filament, threaded fasteners, generic electronics components and craft consumables such as yarn or buttons are all made available for free. Additionally, a store is located outside the space where students may purchase commonly used materials such as 2x4’s, plywood and paint. To enter the wood or metal shops, students are required to wear safety glasses and closed-toed shoes and tie back long hair. Furthermore, they are not permitted to wear loose clothing. Safety glasses must be worn to operate soldering equipment.
Other makerspaces are available to students at both schools and it is important to recognize the possibility that students are using more than one (see Supplementary Materials for more information about the other makerspaces). At School A, there are two makerspaces available in the architecture building and one in the mechanical engineering building. At School B, there are makerspaces located in the electrical and computer engineering, aerospace engineering, material science and engineering, technology research and biomedical engineering buildings, as well as the library. However, the two makerspaces studied are the largest available on each campus and are more diverse in their capabilities.
3.2. COVID-19 restrictions
Due to COVID-19, conditions were not the same in the makerspaces across the different semesters. The restrictions at each university are summarized in Table 2, while the restrictions at each makerspace are summarized in Table 3.
Table 2. University-wide COVID-19 restrictions
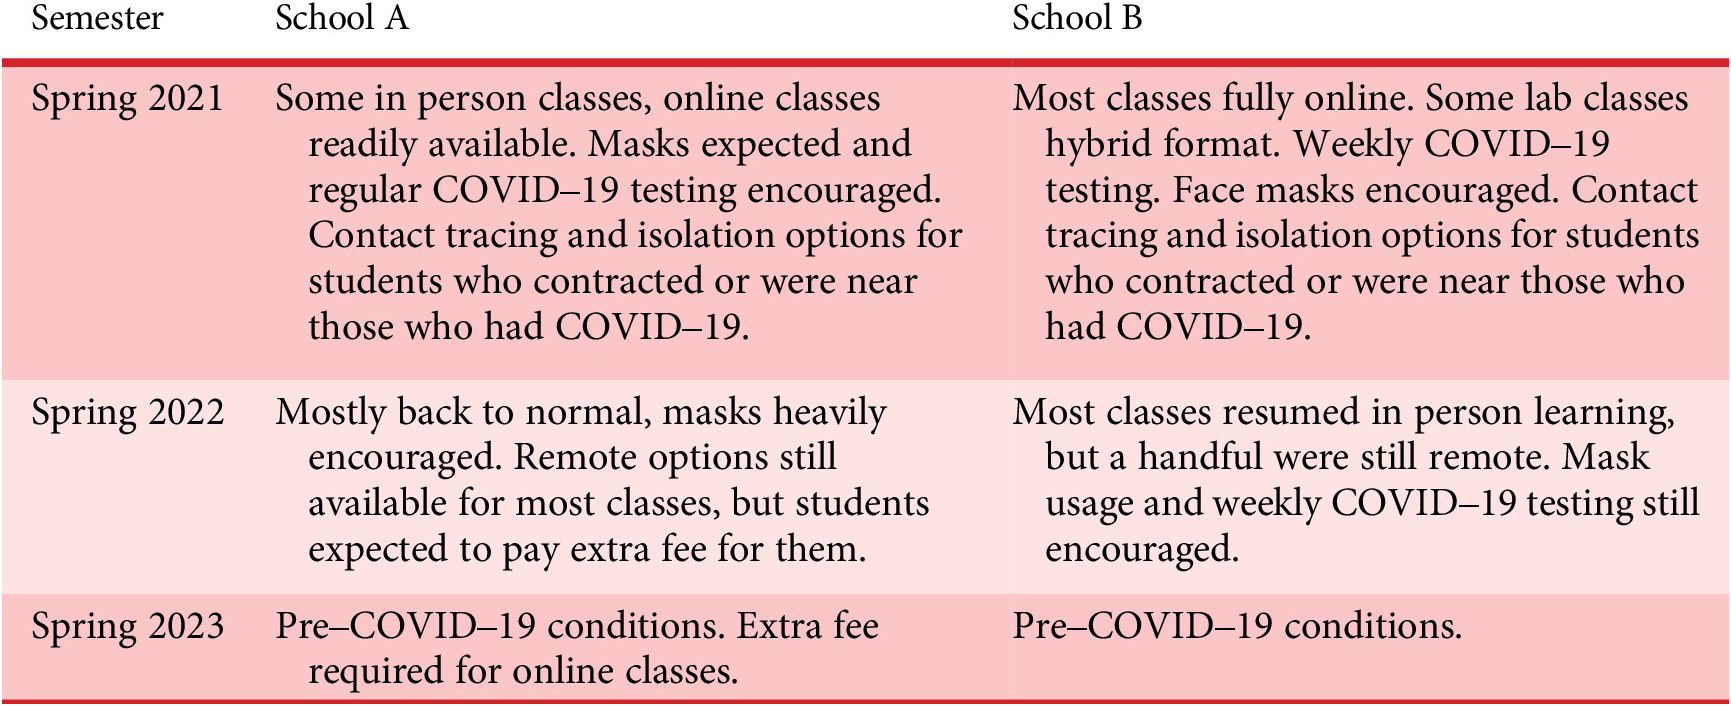
Table 3. Makerspace COVID-19 restrictions and protocols

3.3. Data collection
Data for this study were collected through a series of online surveys that asked students questions about tool usage, motivations for using the makerspace, prior makerspace involvement and demographics (Kaat Reference Kaat2023). For the tool usage section, students were first asked to select the tools that they had used from a list of general tool categories, such as wood tools or 3D printers. Based on the general tools they selected, survey logic was used to ask them additional questions about the specific tools they used in each of those general tool categories. For example, the general tool category of metal tools included the specific examples for School A of manual mill, CNC mill, manual lathe, CNC lathe, waterjet, drill press, bandsaw, electric discharge machine, surface grinder, injection molder, vacuum former, hydraulic press, metal shears, welding equipment and other (See Appendix, Table A1 for a complete list). While the general tool categories are the same at both universities, the specific tools available at each school vary. For this reason, most of the analysis deals only with the general tool categories, as these are comparable across all schools. Table 4 shows the tools unique to each university’s makerspace. Additionally, the specific tools listed on the survey varied somewhat from semester to semester as tools were added/removed from the space.
Table 4. Tools unique to each school

Survey recruitment looked different from semester to semester and between schools due to changes in operation over the semesters. More details on this can be seen in prior work (Banks Reference Banks2023). In Spring 2021, researchers at each school recruited survey participants in classes that either required students to use the space or required projects that allowed students to use the space. This was done through in-person announcements, virtual Zoom announcements (while classes were online during the pandemic) and written announcements sent through the school’s learning management system. At School A, students were recruited from classes in engineering graphics, materials and manufacturing; advanced computer-aided engineering, manufacturing processes, electrical engineering capstone design and mechanical engineering capstone design. At School B, students were recruited from courses in engineering graphics, sophomore mechanical engineering design and mechanical/interdisciplinary capstone design. Additionally, students who completed the entry/exit surveys described in prior studies (Banks Reference Banks2023), or those who signed into School A’s makerspace, were emailed the end-of-semester survey to complete if they were interested. Observational data were also used to validate that the students’ self-reported data were accurate (Banks Reference Banks2023).
In Spring 2022, students who used the makerspace at School A were once again emailed the survey. At School B, the sign-in system only asked students to tap their student ID cards and did not require students to fill out any sort of form. Therefore, undergraduate researchers stood outside the makerspace and asked students to sign up to complete the end-of-semester survey during the last 2 weeks of classes. Students were paid $1 for signing the consent form and agreeing to take the survey and $20 for the actual completion of the survey once it was sent out. The survey link was sent out to the same classes as before at School A and to mechanical/interdisciplinary capstone design students at School B. These recruitment procedures were repeated for both schools in Spring 2023.
This study was reviewed by both the Georgia Tech and Texas A&M IRB offices and found to be minimal risk research qualified for exemption status, GT Protocol H20174 and TAMU Protocol IRB2020-0454M.
3.4. Network analysis
Survey responses were used to populate a bipartite network modeling the interactions between “students” and “tools” (Yang & Zheng Reference Yang and Zheng2017; Blair et al. Reference Blair, Banks, Linsey and Layton2021) as shown in Figure 1. Within the network, a “1” indicates a student used a tool, while a “0” indicates the tool was not used. The bipartite network does not capture tool use frequency (Abrams Reference Abrams2018). More detail on the bipartite network generation process can be found in other work (Yang & Zheng Reference Yang and Zheng2017).

Figure 1. Process used to model student–tool interactions in a makerspace as a bipartite network. Panel (a) shows the interactions between students and tools as gathered in the survey, panel (b) depicts a bipartite direction graph form, and panel (c) shows the final matrix representation. Figure modified from Blair et al. (Reference Blair, Crose, Linsey and Layton2023a).
Modularity, nestedness and connectance metrics were calculated via the MATLAB package BiMat (Flores et al. Reference Flores, Poisot, Valverde and Weitz2016). The network was optimized using the Newman/Leading Eigenvector method (Newman Reference Newman2006) where modules are created based on groups of students and tools that have minimal interactions outside their group. Module assignments are rearranged until the maximum modularity value, calculated using Eq. (1), is reached.
 $ {Q}_b $
is the modularity value,
$ {Q}_b $
is the modularity value,
 $ L $
is the total number of interactions possible between students and tools,
$ L $
is the total number of interactions possible between students and tools,
 $ {B}_{ij} $
is the bipartite adjacency matrix and
$ {B}_{ij} $
is the bipartite adjacency matrix and
 $ {k}_i $
and
$ {k}_i $
and
 $ {d}_j $
are the number of interactions for each individual tool and student, respectively. Modularity ranges from 0 to 1 with 1 indicating a perfectly modular space. High modularity in a makerspace represents students who are primarily using specific tool groups instead of a variety of tools:
$ {d}_j $
are the number of interactions for each individual tool and student, respectively. Modularity ranges from 0 to 1 with 1 indicating a perfectly modular space. High modularity in a makerspace represents students who are primarily using specific tool groups instead of a variety of tools:
 $$ {Q}_b=\frac{1}{L}\sum \limits_{ij}\left({B}_{ij}-\frac{k_i{d}_j}{L}\right)\delta \left({g}_i,{j}_j\right). $$
Once modules were assigned, connectivity (z) and participation (p) values were calculated for each member of the network using Eqs (2) and (3). These values quantify how connected a tool is to the other actors in a network and are described in more detail in other work (Blair et al. Reference Blair, Banks, Hairtson, Linsey and Layton2022a, Reference Blair, Crose, Linsey and Layton2023b). Each actor is modeled as a node with between module links and within module links. In Eq. (2),
 $ {k}_i $
is the number of links of node
$ {k}_i $
is the number of links of node
 $ i $
to other actors in its own module,
$ i $
to other actors in its own module,
 $ {k}_{si} $
is the average number of links of each node in the module and
$ {k}_{si} $
is the average number of links of each node in the module and
 $ {\sigma}_{k_{si}} $
is the standard deviation of
$ {\sigma}_{k_{si}} $
is the standard deviation of
 $ {k}_{si} $
. In Eq. (3),
$ {k}_{si} $
. In Eq. (3),
 $ {k}_{is} $
is the number of links that node
$ {k}_{is} $
is the number of links that node
 $ i $
has with other nodes in the module,
$ i $
has with other nodes in the module,
 $ s $
while
$ s $
while
 $ {k}_i $
is the same as in Eq. (2) (Guimerà & Amaral Reference Guimerà and Amaral2005):
$ {k}_i $
is the same as in Eq. (2) (Guimerà & Amaral Reference Guimerà and Amaral2005):
 $$ {z}_i=\frac{k_i-{k}_{si}}{\sigma_{k_{si}}}, $$
 $$ {p}_i=1-\sum \limits_{s=1}^{N_M}{\left(\frac{k_{is}}{k_i}\right)}^2. $$
The p- and z-values can be used to determine the role that each actor has within a network. Cartographical regions defined by Guimerà & Amaral (Reference Guimerà and Amaral2005), shown in Figure 2, define the role of an actor (in this case tools) in the network’s functioning, determined by plotting the p- and z-values.
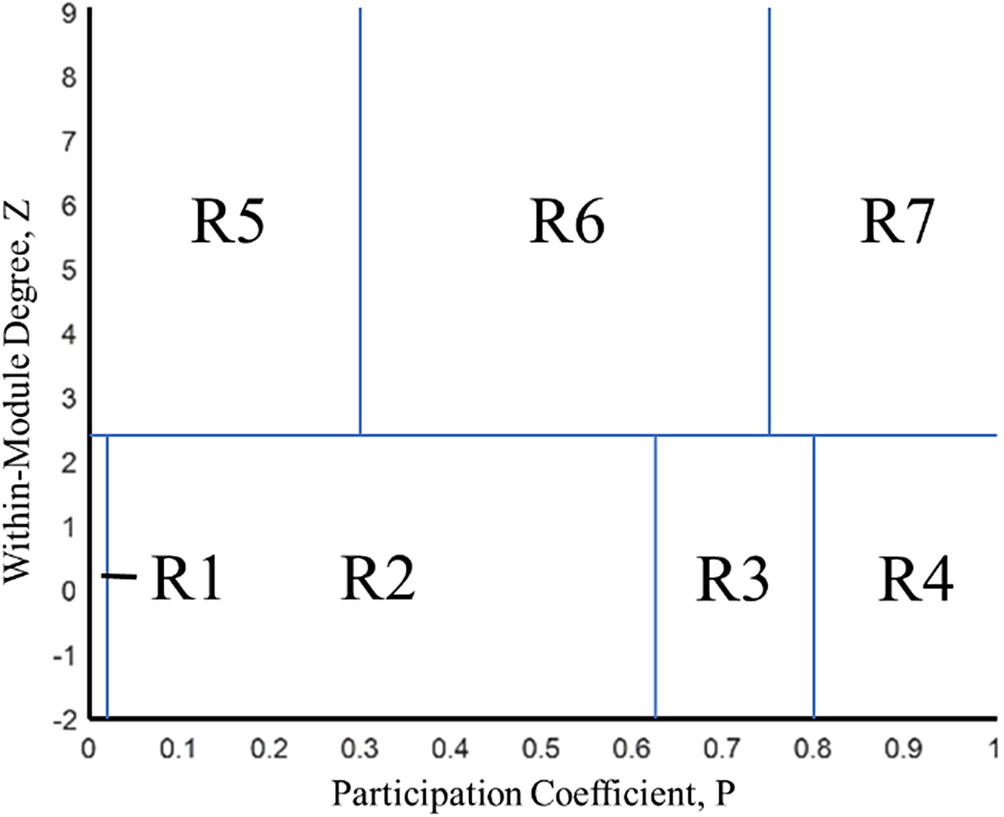
Figure 2. Regions of a p–z plot generated by a modularity analysis, modified from Guimerà & Amaral (Reference Guimerà, Mossa, Turtschi and Amaral2005), Guimerà, Sales-Pardo & Amaral (Reference Guimerà, Sales-Pardo and Amaral2007) and Blair et al. (Reference Blair, Banks, Hairtson, Linsey and Layton2022a). Node regions include – R1: Ultra peripheral (tools only used in conjunction with others in the same module); R2: Peripheral (tools mostly used with others in the same module); R3: Non-hub connectors (tools in combination with many, and at most half, others in different models); R4: Non-hub kinless (tools used evenly with tools across all modules); R5: Provincial hubs (tools used in conjunction with others making them critical to their own group); R6: Connector hubs (tools used in conjunction with others both within and outside own module); R7: Kinless hubs (tools used in conjunction with others across the space and therefore cannot be assigned a module).
Equations (4) and (5) summarize the nestedness calculation using the nestedness based on overlap and decreasing fill (NODF) method (Ulrich et al. Reference Ulrich, Almeida-Neto and Gotelli2009; Matthews et al. Reference Matthews, Cottee-Jones and Whittaker2015). A nestedness value of 1 describes a perfectly nested network, while a nestedness value of 0 describes a non-nested network.
 $ {M}_{ij} $
is the nestedness of the row pair,
$ {M}_{ij} $
is the nestedness of the row pair,
 $ {n}_{ij} $
is the number of ones that match between row
$ {n}_{ij} $
is the number of ones that match between row
 $ i $
and
$ i $
and
 $ j $
and
$ j $
and
 $ {k}_i $
and
$ {k}_i $
and
 $ {k}_j $
are the number of one’s found in row
$ {k}_j $
are the number of one’s found in row
 $ i $
and
$ i $
and
 $ j $
, respectively. The first expression of Eq. (4) is used if the matrix is not arranged in decreasing fill (meaning that the number of 1 s in the matrix in any row and column decreases from top to bottom/left to right). This results in a nestedness value of 0. Otherwise, the second expression of Eq. (4) is used. This process is repeated for all row pairs and all column pairs. Equation (5) combines each individual column and row NODF values to produce a final normalized value. Here,
$ j $
, respectively. The first expression of Eq. (4) is used if the matrix is not arranged in decreasing fill (meaning that the number of 1 s in the matrix in any row and column decreases from top to bottom/left to right). This results in a nestedness value of 0. Otherwise, the second expression of Eq. (4) is used. This process is repeated for all row pairs and all column pairs. Equation (5) combines each individual column and row NODF values to produce a final normalized value. Here,
 $ m $
and
$ m $
and
 $ n $
are the total numbers of rows and columns in the network, respectively:
$ n $
are the total numbers of rows and columns in the network, respectively:
 $$ {M}_{ij}=\left\{\begin{array}{c}0, if\;c\le {k}_j,\\ {}\frac{n_{ij}}{\min \hskip0.35em \left({k}_i,{k}_j\right)}, otherwise,\end{array}\right. $$
 $$ {N}_{NODF}=\frac{\Sigma_{ij}{M}_{ij} row+{\Sigma}_{ij}{M}_{ij} col}{\frac{m\left(m-1\right)}{2}+\frac{n\left(n-1\right)}{2}}. $$
Connectance, calculated using Eq. (6), is a measure of the actual interactions within a network (
 $ L $
) out of the total number of potential interactions in a network. The number of potential interactions is measured based on the number of students,
$ L $
) out of the total number of potential interactions in a network. The number of potential interactions is measured based on the number of students,
 $ {N}_{rows} $
and the number of tools,
$ {N}_{rows} $
and the number of tools,
 $ {N}_{columns} $
. When students use more tools within a space, the connectance value is higher. This metric clarifies the variety of tools students use each semester and can identify causes of usage drops in combination with nestedness and survey results:
$ {N}_{columns} $
. When students use more tools within a space, the connectance value is higher. This metric clarifies the variety of tools students use each semester and can identify causes of usage drops in combination with nestedness and survey results:
 $$ C=\frac{L}{N_{rows}{N}_{columns}}. $$
4. Results and discussion
4.1. Survey results
Figure 3 shows student motivations for using the makerspaces. At School A, at least 70% of students used the space for class each semester and between 5% and 20% of students used the space for personal projects. Given that the purpose of School A’s makerspace is to support undergraduate engineering courses and personal projects are not permitted, this is no surprise. It is clear, the students are using the space for personal projects anyway and this is an important need since it provides additional opportunities for learning. At School B, between 63% and 74% of students used the space for class each semester and between 36% and 61% of students use the space for personal projects. The gap between class and personal project usage continues to decrease at School B, moving from 27% in Spring 2021 to 16% in Spring 2022 and finally to 8% in Spring 2023. This is likely due to more students using the space for personal projects as COVID-19 restrictions subsided.

Figure 3. Usage type by semester, School A vs School B.
Makerspace usage was quantified in multiple ways. First, the number of hours students spent in a makerspace in a normal week was compared across semesters and is presented in Figure 4. At both schools, usage was very low in Spring 2021, with 65% of students at School A and 46% of students at School B not using the space at all or using it less than 1 h in an average week. In Spring 2022 and Spring 2023, usage increases drastically, with the most common number of hours being 3–5 h per week. Despite many students still using the makerspaces during COVID-19, most limited the amount of their exposure within the space. This may be due to university-imposed restrictions or students’ fear of illness. Figure 5 compares the median response given for hours spent by students who used the space for class compared to those who did not. Until Spring 2023, class usage is always higher than non-class usage.
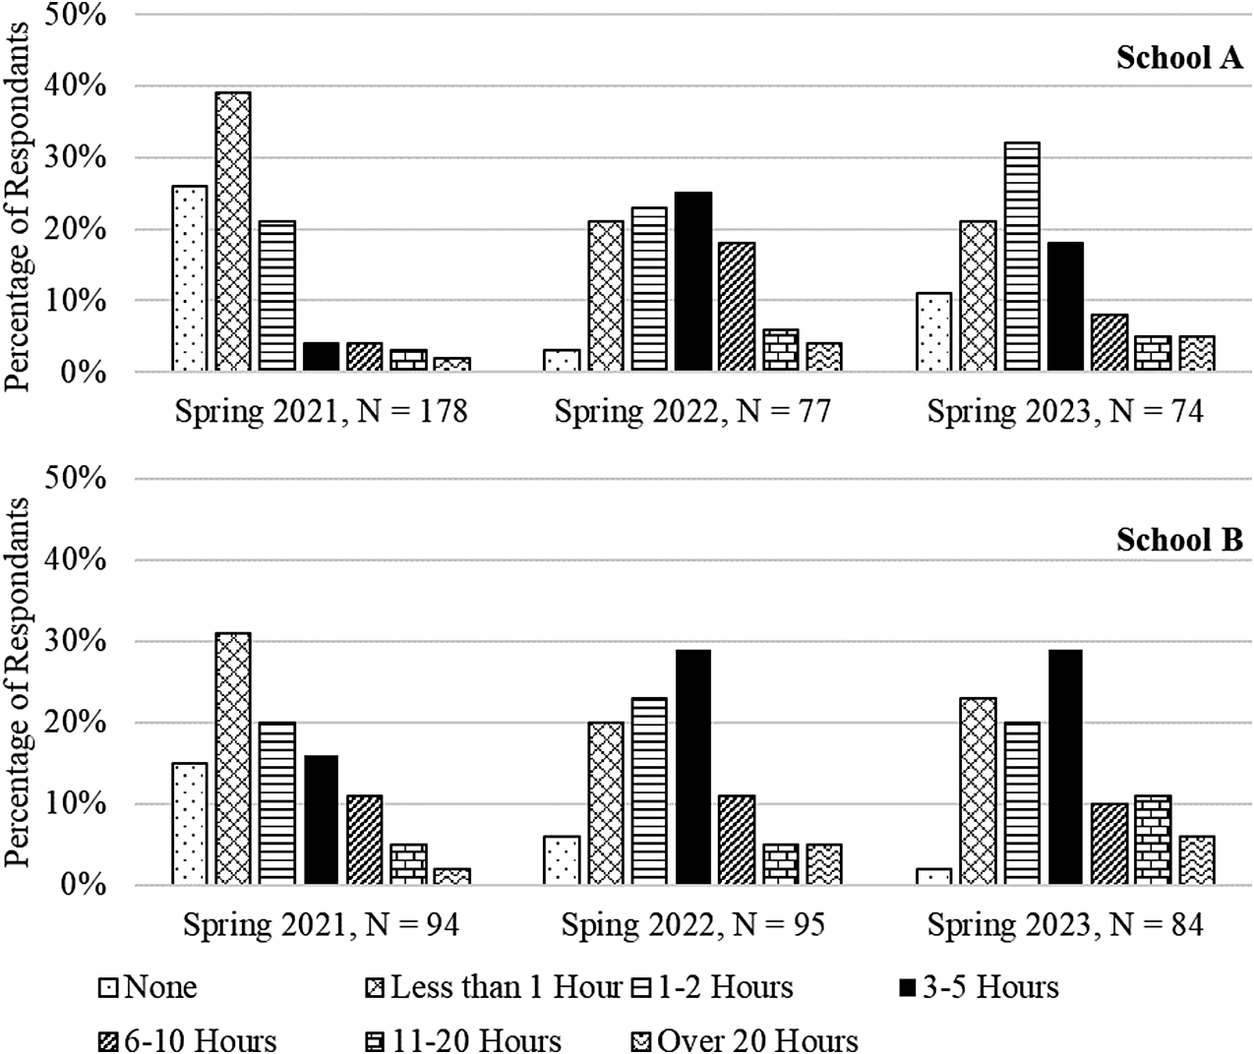
Figure 4. Hours spent in makerspace per week, School A (top) vs School B (bottom).

Figure 5. Median hours spent in School B’s makerspace per week, class vs no class.
Figure 6 shows the mean and median number of tools used by students at each makerspace. The specific tool responses were used to generate this plot and any tool that wasn’t on all three surveys was removed from the count. School A’s survey had 73 tools and School B’s had 62 tools. Usage was found again to have increased when COVID-19 restrictions were removed, with higher overall usage at School B. It is interesting to note that at School B, the mean is much higher than School A, but the medians are similar. This indicates that some users at School B engage with a much larger number of tools, but for the typical student usage is similar at the schools. This could be due to the allowance for personal projects at School B, which encourages the use of other tools and tools not explicitly covered in classes. Figure 7 shows the mean and median number of tools used for students who used the space for class vs those who did not at School B. Class usage remains more consistent due to the requirements associated with it, while non-class usage drops during COVID-19. However, in Spring 2023, the number of students who used the space for non-class activities is higher, showing that personal projects and other similar activities are important for driving usage.

Figure 6. Mean and median number of tools used by students at School A and School B.

Figure 7. Mean and median number of tools used at School B by students who used the space for class vs those who did not.
Figures 8 and 9 show the percentage of students who used the general tool groups at each university, respectively. Like prior figures, Spring 2021 had decreased usage for both schools. At School A, percentage tool usage was highest in Spring 2022 for most tool categories except for 3D printers and metal tools, which are both tools that are heavily used for classes at this school. At School B, laser cutter usage decreased in Spring 2023 due to several of the laser cutters undergoing maintenance. Otherwise, Spring 2021 had the lower usage percentage for all other tools. Figure 10 shows the percentage difference in tool usage between Spring 2021 and Spring 2022. At both schools, the 3D printer and the laser cutter had very small changes across the semesters. On the other hand, metal tools and giving/receiving help had large changes. Metal tools may be due to differences in professors assigning projects during COVID-19. At School B, little change is seen for workstations and social activities. This is likely attributed to the space being open for students to study and work on projects despite the pandemic. With many other facilities around campus being closed and students tired of studying in their dorm rooms, the makerspace presented a welcoming environment.

Figure 8. Tool category usage across semesters, School A.
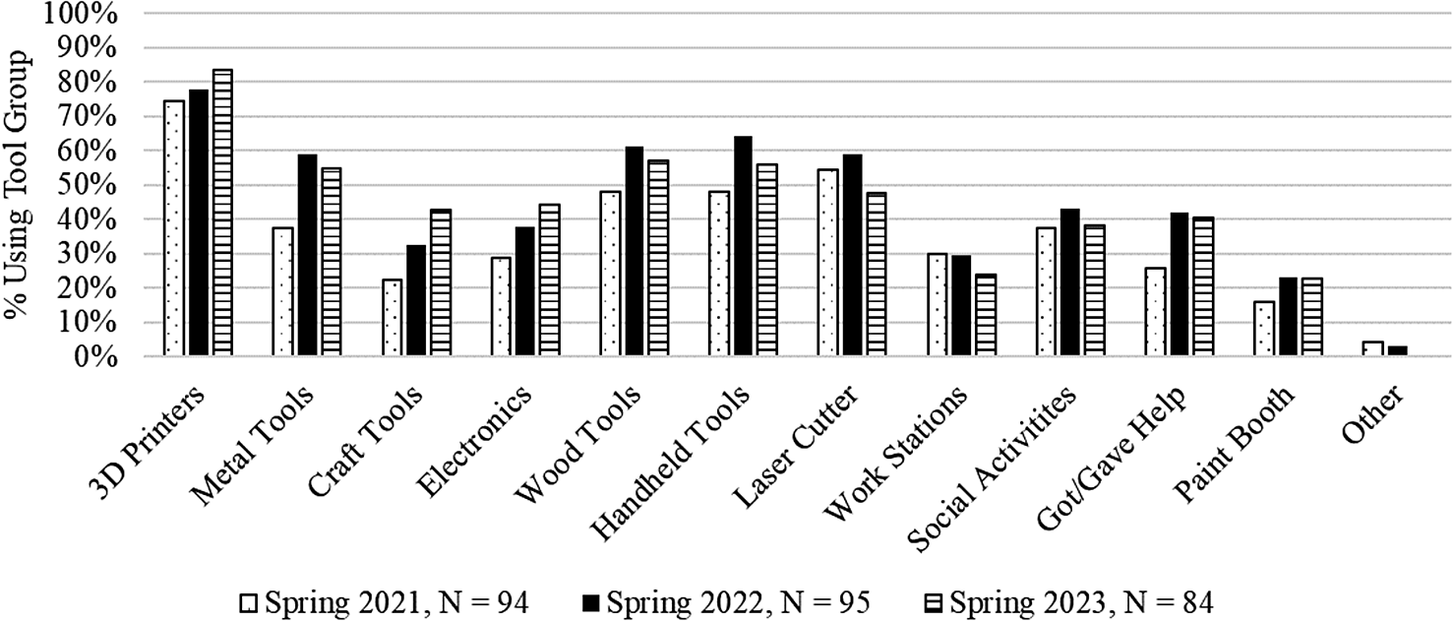
Figure 9. Tool category usage across semesters, School B.

Figure 10. Percent change in tool category usage across semesters, School B.
An open-ended survey question asked, “If you used the space less this semester compared to previous semesters, why?” (Figures 11 and 12). The answers fall into five categories by two raters with 85% agreement: “Remote Learning” was for students who discussed enrollment in online classes only or not being physically on campus, and “COVID-19 restrictions” was for any other COVID-19-related response. Not surprisingly, we see students cite COVID-19 restrictions frequently in Spring 2021, further validating that COVID-19 reduced makerspace use. “No need” was a common answer in later semesters at School A, reflecting its class focus.

Figure 11. Motivations for reduced usage, 3 spring semesters at School A.

Figure 12. Motivations for reduced usage, 3 spring semesters at School B.
One complaint of multiple students was the cryptic restrictions in place during the height of the COVID-19 pandemic. One student stated, “COVID-19 protocols seemed harder to understand and adapt to,” while another said they used the space less because of the “confusing website and training.” This concern was also noted by administration at other makerspaces (Bill & Fayard Reference Bill and Fayard2021). During a scenario such as COVID-19, makerspace staff have little say over restrictions in place. Even so, it is still imperative that they make it clear to users what the expectations are for entrance or membership and that there are no implicit rules (Smit & Fuchsberger Reference Smit and Fuchsberger2020; Bravo & Breneman Reference Bravo and Breneman2022). During a period when entrance requirements are changing rapidly, it becomes increasingly important that new guidelines are communicated. This leaves all involved feeling safe and as though they belong.
4.2. Network analysis results
The data from each semester can also be further explored using the p–z plot from Figure 2 to understand the impact of COVID-19 disturbances on the role of tools in the space. The across network participation, p, and within-module degree, z, together describe how the tools were used in conjunction with others in the makerspaces each semester. Looking at Figure 13, we can see that some tools shift out of a hub-tool role and some shift into it, while some specialized tools (smaller p-values) change their role in the space as well. Tools in regions more to the bottom left (see Figure 2) tend to be those that have more restrictions/skills required for their use. Similar to what is seen in biological ecosystems, where specialized species are the first to be impacted by a disturbance, specialized tools usage was more affected by COVID-19 restrictions. This is seen by a drop in connectivity, for example, hand tools, social activities and got/gave help all saw their across network participation be lower during COVID-19 restrictions (Spring 2021). On the other hand, tools with higher both p- and z-values, such as the 3D printer or the laser cutter, are identified as kinless hub tools at School B – meaning that they are used in conjunction with everything else in the space and can therefore be described as more general tools. Their usage across the space remains high despite the restrictions as well as after restrictions are lifted. The kinless hub tools are likely some of the more important tools for the space and likely should be some of the first tools for a makerspace and located in central, easy to access locations when possible.

Figure 13. p–z plots for Schools A (top) and B (bottom), Spring 2021 (high COVID-19 restrictions, left (Blair et al. Reference Blair, Banks, Hairtson, Linsey and Layton2022a)) versus Spring 2022 (post-COVID-19 restrictions, right). The location of the tools corresponds to the descriptions in Figure 2.
Figure 14 summarizes the network metrics for each semester at the two schools. Nestedness (Eq. (5)) provides the clearest potential network health metric due to prior work, based on the findings that highly nested networks are resistant to change (Bascompte et al. Reference Bascompte, Jordano, Melián and Olesen2003; Ulrich et al. Reference Ulrich, Almeida-Neto and Gotelli2009; Matthews et al. Reference Matthews, Cottee-Jones and Whittaker2015; Mariani et al. Reference Mariani, Ren, Bascompte and Tessone2019). At School A, we see nestedness rise substantially after Spring 2021 when COVID-19 restrictions were lessened or removed (Blair et al. Reference Blair, Crose, Linsey and Layton2023a). While no quantitative data are available from Spring 2019, it is speculated that nestedness pre-COVID-19 would have been at least as high as in Spring 2023 due to the lack of COVID-19-related restrictions. At School B, nestedness remains high during all three semesters, indicating that the makerspace operations have created a space that is more resilient to disruptions, such as the COVID-19 restrictions, than School A’s space. This is also further supported by the Figure 13 results, showing that the tools at School B saw less of a shift between Spring 2021 and 2022 than those at School A. The tools at School B also had higher overall connections both with other tools in similar modules (higher z-values) and with links to tools across the space being more uniform (higher p-values).

Figure 14. Nestedness, connectance and modularity metrics for Schools A and B across three spring semesters (2021, 2022 and 2023) (Blair et al. Reference Blair, Crose, Linsey and Layton2023a).
Connectance (Eq. (6)) represents the number of actual interactions compared to the total possible number of interactions between students and tools (a value of 1 would mean every student using the space used every tool in the space) and therefore represents tool usage within the makerspace. At both schools, usage or connectance is lower in Spring 2021. Connectance limits the maximum nestedness that can be achieved in a network (Blair et al. Reference Blair, Hairston, Banks, Linsey and Laytonaccepted). Thus, the lower connectance at School A, meaning fewer student–tool interactions, than what is seen at School B across all three semesters prevents School A from getting to a higher and more resilient nested structure. This suggests that there may be policies in place at School A limiting the number of tools in the space being used by students. Identifying these and modifying them would open up the opportunity for School A to improve nestedness, although it does not guarantee a higher value (Blair et al. Reference Blair, Crose, Linsey and Layton2023a).
Modularity (Eq. (1)) represents how patterns among interactions can group actors in a network. Networks cannot be both highly modular and highly nested, although they can simultaneously have low modularity and low nestedness (Blair et al. Reference Blair, Hairston, Banks, Linsey and Laytonin review). Generally, though, if a network has a low nestedness, it will be more modular. The results here show that School A has a higher modularity and lower nestedness in both Spring 2021 and Spring 2023 than School B. A more modular network structure has been linked to lower network resilience to unexpected disturbances (i.e., disturbances that do not purposely attack critical actors) (Bascompte et al. Reference Bascompte, Jordano, Melián and Olesen2003; Ulrich et al. Reference Ulrich, Almeida-Neto and Gotelli2009; Matthews et al. Reference Matthews, Cottee-Jones and Whittaker2015; Mariani et al. Reference Mariani, Ren, Bascompte and Tessone2019). The higher modularity of the makerspace at School A is similar to the lower nestedness, partially a result of the lower number of tools students using the makerspace indicated that they used on average (i.e., lower connectance). The low modularity of School B across all three semesters is partially related to the higher connectance of students and tools despite COVID-19 restrictions.
Overall, the findings from the network models address the research question that network analysis metrics can provide meaningful insights into makerspace health. Consistent with the findings from ecological networks for these two makerspaces, high nestedness does indicate networks that are more robust. The metrics change as restrictions are lifted from the spaces. Future work needs to compare more spaces and changes within individual spaces.
4.3. Limitations
A key limitation of this work is the lack of pre-COVID-19 data. While pilot data were collected in Fall 2019 (Banks Reference Banks2023) prior to the start of the pandemic, the survey questions used were not directly comparable. Makerspace staff have stated that makerspace usage seems “back to normal” following COVID-19 restrictions, but this is based fully on qualitative observation and there is no concrete pre-COVID-19 data to back it up.
Another limitation is that the study’s participant makeup changed from semester to semester and from school to school, making it challenging to fully compare. While the percentage of students of different demographics remained generally similar, some statistically significant differences are still present despite using similar recruitment processes each semester.
Finally, network analysis on its own provides no insight into the reasons why a makerspace is modular, nested or connected. While the open-ended survey questions and knowledge of the restrictions occurring at each makerspace provide some knowledge of this, more work could be done to understand the underlying reasons.
5. Conclusion
An online survey consisting of questions about makerspace involvement, tool usage and demographics was issued to makerspace users at two university makerspaces in three spring semesters spanning during and after the COVID-19 pandemic. The survey data were analyzed for metrics of frequency, tools used and motivations for using the space. Additionally, qualitative questions asked students to elaborate on if and why they used the space less than other semesters. Network analysis, on the other hand, provided overall metrics that were comparable between semesters, even when the number of users or the number of tools were changing. Metrics of modularity, nestedness and connectance were used to better gauge student–tool interactions within the space.
Academic makerspaces and their usage was notably impacted by COVID-19 (RQ1). It was found that the makerspace health and student tool usage declined substantially in Spring 2021 but then improved again in Spring 2022 and Spring 2023. The decline was clearly seen across a variety of metrics including visit frequency, tool usage, nestedness and connectance (RQ2). While both makerspaces were hurt by the restrictions, School B saw less decline in usage and nestedness and a faster recovery than School A. We speculate that this is due to the student-run, less restricted atmosphere of School B’s makerspace. Factors such as allowing personal projects and not closing workspaces/study areas may prove very helpful to makerspaces in general for minimizing the impact of external disruptions (RQ3).
While COVID-19 was clearly a large disruption, it was found that these analysis techniques can be used to identify and address other underlying issues. A similar principle to regular health “well-visits” can be applied to academic makerspaces. Each semester data can be collected on which tools students are using and nestedness can be measured noting when it decreases, likely indicating a disruption. Instead of waiting until the space is noticeably struggling, routine check-ups and maintaining healthy habits are beneficial to maintaining long-term makerspace health and catching problems that arise such as harmful restrictions, problematic staff members and other barriers to entry before they fully develop. Additionally, these metrics give makerspace staff insight into the most popular and most valuable tools that can also be used to support curriculum and boost involvement.
Supplementary material
The supplementary material for this article can be found at http://doi.org/10.1017/dsj.2024.11.
Acknowledgments
The authors want to thank all students who completed the survey and as well as the faculty and staff who support the makerspaces where analysis was conducted.
Financial support
This work was made possible through the support of the National Science Foundation under grants 2013505 and 2013547. Any opinions, findings and conclusions found in this article do not necessarily reflect the views of the National Science Foundation and its employees.
Appendix
Table A1. General tool categories and corresponding specific tools


 Open access