1 Introduction
1.1 Design decisions, design defects and missed requirements
The design of complex systems involves activities such as sizing subsystems and components, selecting configurations, and determining possible design solutions and implementations. Throughout, the process requires decisions (Hazelrigg Reference Hazelrigg1998) that determine what needs to be analyzed, considered and determined. We call these design decisions. Design decisions define requirements, create concepts, form specifications from requirements, shape the final configuration and physical form, and define production and testing (Saad et al. Reference Saad, Al-Ashaab, Maksimovic, Zhu, Shehab, Ewers and Kassam2013) and lifecycle/operating principles. A design research question of interest is the relative importance of design decisions made early versus late in the design process (Ulrich & Scott Reference Ulrich and Scott1998; Ullman Reference Ullman2015).
One way to study relative decision importance of is to consider the relative impact of incorrect decisions made. An incorrect decision is observable in terms of the corrective actions required to fix the problem. We define a design defect as a poor design decision made creating an attribute not desired in the design, which must either be fixed (decision undone) or accepted as a permanent non-compliance denigrating the produced design. Design defects come in form at different levels of abstraction, from high level missed requirement (e.g., insufficient flying distance range), to engineering sizing deficiencies (e.g., insufficient battery size) or unspecified design features (e.g., insufficient fillet radius) and inherent requirements that are not explicitly stated.
An engineering design process can be described in a requirements compliance framework; in this view, the process is a sequence of defining technical requirements and in turn developing and engineering concepts to meet the requirements, and then finally verifying and validating the design meets the requirements (VDI 1993; Clausing Reference Clausing1994; Otto & Kristin Reference Otto and Kristin2001). In this context, design decisions, when not met, can be tracked for impact based on traditional effort tracking against requirements within program management tools.
Therefore, we define missed requirements as design defects on managed requirements. Missed requirements are the important design defects with such impact that they require program management tracking during development. We propose to examine the importance of design decisions by studying managed requirements in industrial development programs and compare their relative timing and impact of missed requirements. Note that these requirements based approach includes the large early design decisions such as the decision on the concept selected. If the concept selected decision was not corrected and must be re-decided, it was due to an inadequacy in missed information needed early at the point when the concept was selected.
For more complex systems, this includes defining a network of requirements and managing their multiple interactions (Clarkson & Eckert Reference Clarkson and Eckert2010; Eckert, Isaksson & Earl Reference Eckert, Isaksson and Earl2012; Ladyman, Lambert & Wiesner Reference Ladyman, Lambert and Wiesner2013). Requirements are statements that describe targeted functionality, e.g., minimum range, minimum payload, etc. (Otto & Kristin Reference Otto and Kristin2001). Constraints on the other hand, are the physical limits based upon the chosen design implementation, e.g., maximum propeller tip speed when using propellers, or stress limits of chosen materials (Otto & Kristin Reference Otto and Kristin2001). When developing new systems, it can be unclear how these multiple requirements and constraints impact one another. These interactions may not be uncovered until late in development during testing (Clarkson & Eckert Reference Clarkson and Eckert2010), when it is realized the requirements and constraints are inconsistent. The consequence can be iterations to resolve these inconsistencies and longer development time (Keller et al. Reference Keller, Eger, Eckert and Clarkson2005; Clarkson & Eckert Reference Clarkson and Eckert2010).
The aerospace and defense industry in particular, has a history of late deliveries, cost overruns and missed requirements (Obaid et al. Reference Obaid, David, Mark and Frances2005; Mark et al. Reference Mark, Robert, Shelia and Obaid2006; Bernard, Eric & Archag Reference Bernard, Eric and Archag2015). On average, the typical procurement process for a new defensive system takes nine (9) years with an average delay of 21 months (Charette Reference Charette2008). As such, there is constant schedule pressure to deliver the product (system) on time and within cost. However, this time pressure is not necessarily the root cause of late deliveries; Chong et al. (Reference Chong, Van Eerde, Chai and Rutte2011), showed that time pressure can have a positive or a negative impact and is highly dependent on team level dynamics.
On the other hand, complex systems can have many nested interactions and hierarchical relations between requirements (Crawley et al. Reference Crawley, De Weck, Magee, Moses, Seering, Schindall and Whitney2004). These interactions and relations can introduce development time-lagged dependencies amongst requirements, and early concept phase decisions are typically made assuming other requirements can be met. The outcome of these assumptions will not be known until later in the program. This uncertainty can result in missed requirements, leading to in-service performance deficiencies (Keller et al. Reference Keller, Eger, Eckert and Clarkson2005). Late deliveries, peculiar behaviors in certain operating conditions, and outright failures in performance are some of the explicit symptoms of missed requirements (Bernard et al. Reference Bernard, Eric and Archag2015).
While it is known that complex programs exhibit cost and schedule overruns, the relationship amongst inconsistent requirements and when they are defined is less established. Requirements are often noted to have been inconsistent, but it is less reported whether these are inconsistencies between early-defined system-level requirements, inconsistencies between later-defined component requirements, or inconsistencies between early-defined system requirements and later-defined requirements, as an evolving system. These statements highlight the importance of this work as it provides clarification of how much more important early design decisions are by providing justifications for added investments in early design processes, methods and tools.
1.2 Related research
A well-established 80–20 rule has been noted where product design accounts for 80% of the manufacturing cost, and has been studied extensively (Ulrich & Scott Reference Ulrich and Scott1998; Otto & Kristin Reference Otto and Kristin2001). The eventual cost committal accounts for manufacturing cost including material, labor, sourced components and other production overheads. This also includes the testing and certification costs. It generally does not include life cycle costs such as maintenance and repair. The 80–20 rule is also supported by Ullman (Reference Ullman2015) who studied copier machines and argued that as high as 75% manufacturing cost savings is committed during the conceptual design phase, and further that design freedom decreases as the knowledge of the design problem increases. To a lesser extent, industrial standards such as S-3000L (Aerospace Industries Association 2009) use a similar premise as the basis to calculate opportunity for life cycle cost savings, although not explicitly stated.
Specific case studies demonstrating the 80–20 rule are less reported. In a product archaeology research study of coffee makers, Ulrich & Scott (Reference Ulrich and Scott1993, Reference Ulrich and Scott1998) confirmed the 80–20 ratio as the design to manufacturing cost contributors, and found it could be made lower by adopting design for manufacturing and assembly methods (Geoffrey Reference Geoffrey1994). Standards on the cost impact of design for manufacture also provide useful guidelines to reduce developmental cycles and discuss the importance of early design decisions (Aerospace Industries Association 2009). In a study of space systems development costs, NASA reports defects not found until operations carry 50 times more cost than defects found in the early concept phase (NASA 2016). In a meta-study of multiple defense systems, the RAND corporation found the cost of changing a requirement escalate over time in a program (Obaid et al. Reference Obaid, David, Mark and Frances2005; Mark et al. Reference Mark, Robert, Shelia and Obaid2006; Bernard et al. Reference Bernard, Eric and Archag2015) highlights that early decisions cost more. Software development process research also reports a similar phenomenon as those in electro-mechanical systems. The National Institute of Standards observed that the longer the time of the discovery of a bug from its creation, the greater the cost impact (Tassey Reference Tassey2002). Boehm reports bugs found in operation carry 10 times more cost than defects found early in the coding phase (Boehm & Papaccio Reference Boehm and Papaccio1988; Boehm & Basili Reference Boehm and Basili2001). Hamada (Reference Hamada1996) reported that with work done at Ricoh, the cost of fixing a design defect was $35 in design compared to $690,000 in field service. All these studies support that design defects discovered late cost more to fix, due to the costs of changing fixed assets such as tooling and repairing multiple units in operation.
Almefelt, Berglund & Nilsson (Reference Almefelt, Berglund and Nilsson2006) found use of requirements management tools can significantly reduce requirements’ errors. The likelihood of requirements compliance can be improved by using formalized processes like the VDI 2211 process or V-model for development to manage requirement changes (VDI 1993). The United States Department of Defense (US DoD) implemented use of Engineering Change Requests (ECRs) and configuration management protocols (Department of Defense 2001) to ensure the changes to design after Critical Design Review (CDR) do not affect the intended function of engineered defense systems. Capers & Lipton (Reference Capers and Lipton1993) reported that the choice of integration and testing processes can greatly impact the performance of a system. This was illustrated in their reported Hubble Space Telescope case study, where failure to adequately test requirements caused expensive repairs.
While such requirements management systems help reduce design errors and help in their mitigation, understanding the root causes of missed requirements and their impact is less understood. De Weck, Olivier & Eckert (Reference Olivier and Eckert2007) studied the impact of various uncertainties on requirements management. Uncertainties can range from being stochastic in nature, such as fabrication or field-use variations, and those that are epistemic in nature, such as the unknown behavior response in the use of immature technologies. They note the lack of knowledge on the contextual background of the design, corporation, usage, market and politico-socio elements can lead to requirements being missed.
Overall, there are multitude interpretations and discussions of the 80–20 rule in the literature. This work seeks to clarify where in the early design stage that 80 percent cost committal is valid, from concept, preliminary, detailed or the verification design phases. Specifically, in terms of monetary resources, time or developmental work activities, we seek to understand the cost impact of decision from the various development process phases.
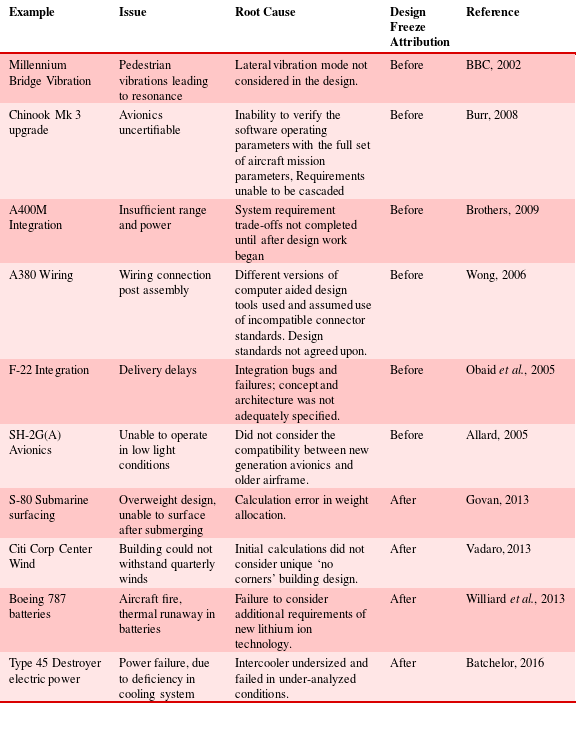
Table 1. Examples of complex systems design defects
1.3 Examples of design decisions and consequences in the literature
The impact of design decisions has had a number of negative consequences, including performance failures, cost overruns and late delivery problems. As background to the industrial case study work presented here, we first also studied the recent literature for examples of particular failures due to design defects in complex systems. A sample of 10 case studies of design defects publicized in the literature are shown in Table 1. While these examples may have had multiple problems and incurred very high program costs, here we isolated the cost impact of an individual defect and studied that individual design defect’s cost and delay impact alone. We examined the cost and schedule overrun and scrutinized for the published issue and self-stated primary root cause. For example, A380 the wiring design defect was discovered late in aircraft final assembly. This led to issues such as liquidity damage from delivery delays (2 years), recertification after compatibility was established and other production rework cost. This single design defect resulted in 18.5% of the total program cost. Table 1 lists examples, issue and causes, and attributes whether the root cause is before (early design) or after (late design) design freeze. Figures 1 and 2 summarize the impact on cost and schedule overruns of the one design defect alone. These publicized design defects all have the same characteristic of not being detected until late. Further, from Figures 1 and 2, it is also observable that the earlier the design defect was attributed, the higher the cost of rework.
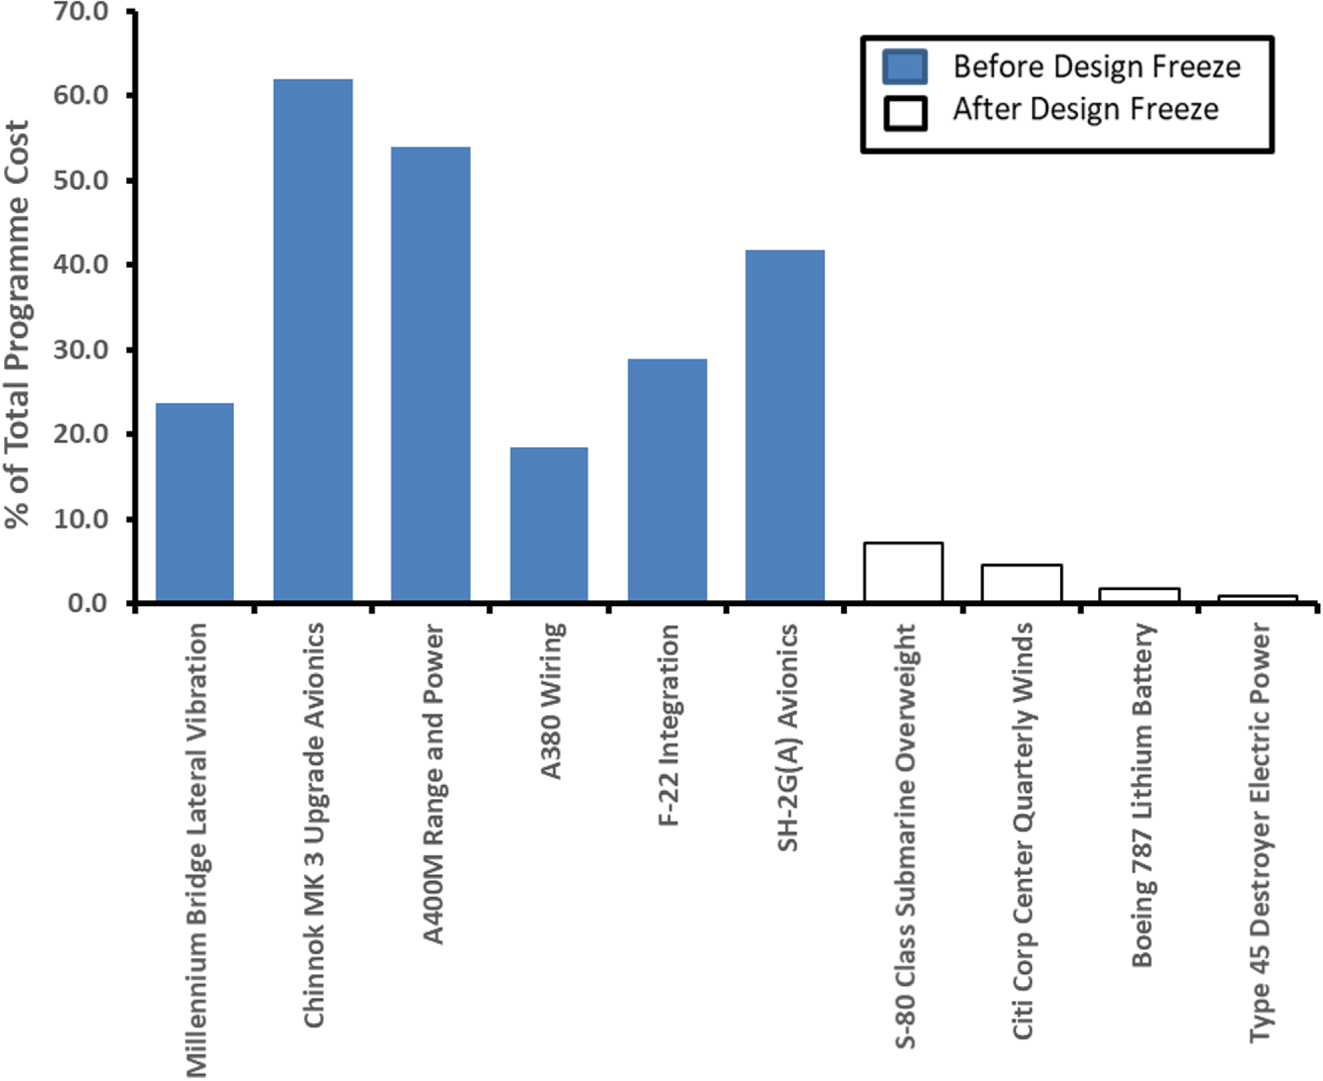
Figure 1. Cost impact of missed requirements.
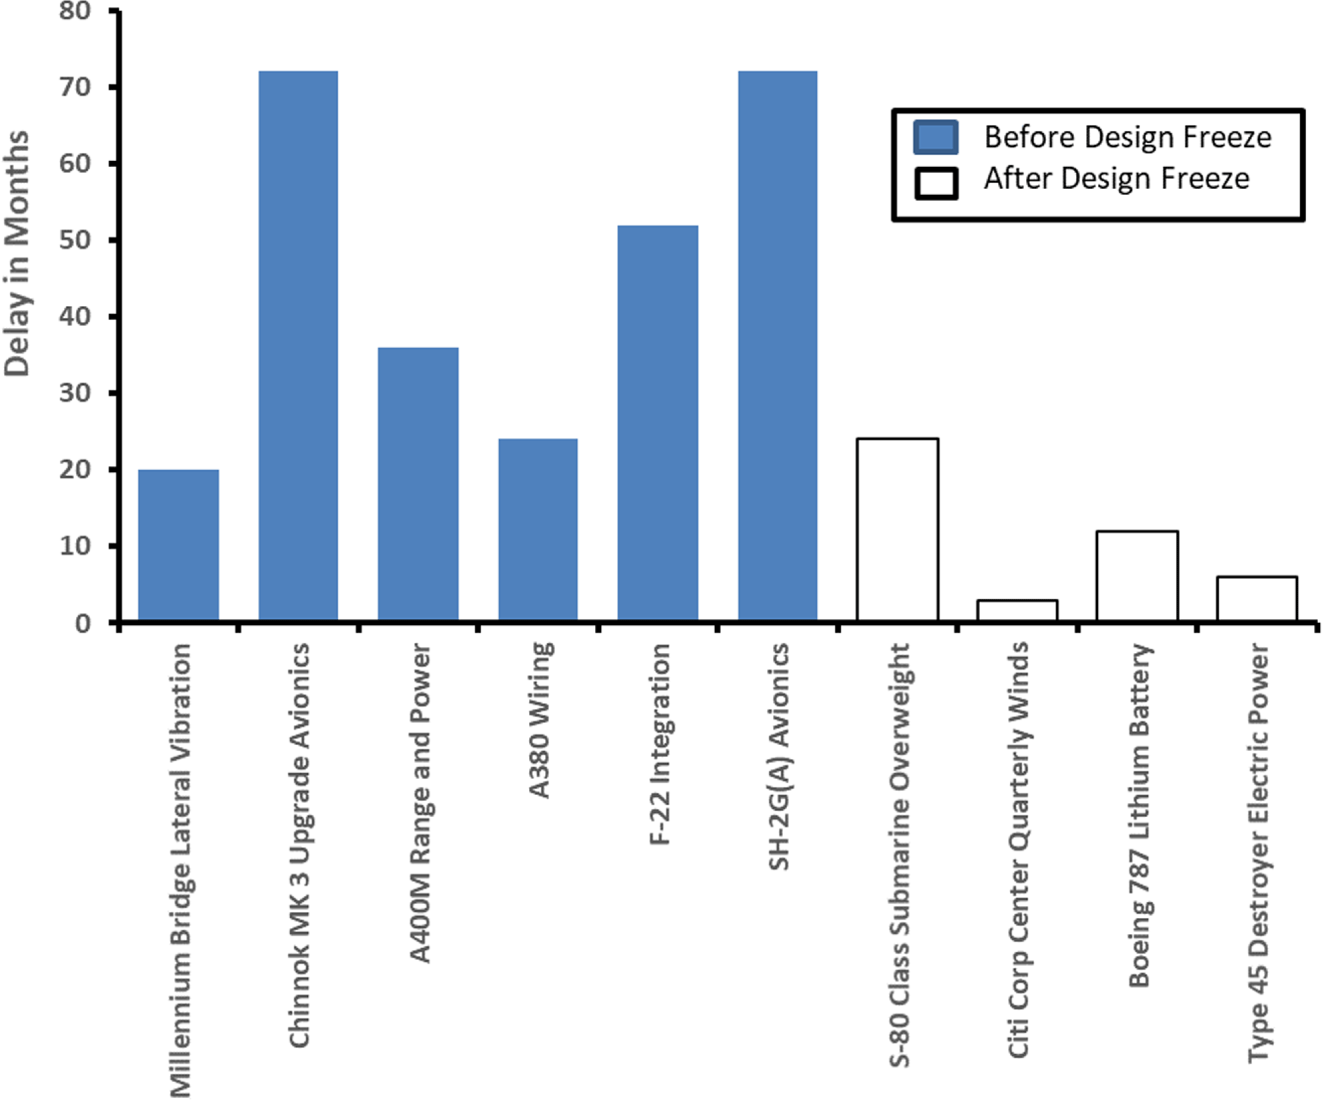
Figure 2. Schedule impact of missed requirements.
In this sample, all of the requirements changes made occurred late in their programs. Beyond the higher cost impact of changing a requirement late in a program, these results further show the cost of changing a requirement based on when the requirement was defined. From the figures, we can see that there is a clear indication that early/phase missed requirements have a distinctively higher cost than late/phase missed requirements.
The publicized design defect examples reviewed in Table 1 included analysis on their missed requirements. Analyzing these findings, in Table 2 we summarize the list of missed-requirement root causes, as self-reported within the works. The root causes include inadequate trade-off analysis of requirements, inadequate reviews, budget and time pressure, and immature technology or industrial base. Yet, the relative occurrence and impact of these root causes is less reported.
Given this, we next present a study of the root causes of missed requirements in the development process and their impact on development cost through rework activities. This is a longitudinal study over several years at the industrial development at a large aerospace firm responsible for developing and delivering UAVs.
Table 2. Self-identified root causes of missed requirements

1.4 Objective
An empirical perspective was applied to quantify and study why requirements are missed in the development of complex systems. While the results shown in Table 1 remain anecdotal evidence from publicized cases, it also creates a basis of hypotheses for root causes. We seek to understand if missed requirements occur more often or not in the early phase of design, as separated before and after concept freeze.
Hypothesis 1: Design decisions made earlier in development carry a higher probability of being incorrect than decisions made later in development.
Given that a missed requirement occurs, the cost impact can be different between early and late phase requirement misses. We seek to understand if early phase decisions cost more or less to fix than late phase decisions.
Hypothesis 2: There is a distinctively higher cost to rectify design requirements originating early in development than later.
From the literature, Table 2 lists several possible root causes of missed requirements. A third research question concerns the root cause of missed requirements.
Hypothesis 3: The most frequent root cause of missed requirements in complex systems development is the difficulty in trading off requirements.
The three research hypotheses will be tested by studying the available project documentation in the corporate setting, including the requirements documentation found in design reports and gate reviews documents, their time history, the Engineering Change Request (ECR) logs, the Failure Reporting System (FRACAS), and finally with Kaizen event workshops with the engineers discussing the problems and tracing their causes. The starting point of the analysis is an individual design defect as either an ECR, a FRACAS event, or a changed requirement in the gate reviews. Each event’s relevant requirement was traced through the requirements documentation for the associated root cause inconsistency, and when those requirements were set. The cost impact can be determined through the chain of activities required to rework the design.
Beyond this, interviews were also conducted with the stakeholders to enhance understanding of the origin of the missed requirements and mitigation strategies. Finally, we will provide our recommendations and conclusions for theoretical contributions and design practice.
2 Study and analysis approach
2.1 Study background: design process at an industrial defense corporation
2.1.1 Corporate design process
With the background information and motivation, we now study a global aerospace company with turnkey expertise in aerospace systems development and modifications. The company’s design process follows a stage gate design process (Cooper Reference Cooper1990) as shown in Figure 3, incorporating system engineering processes (VDI 1993; Department of Defense 2001). Design reviews and decision points are consistent with the DOD 5000-2P (Department of Defense 2001, 2015) systems development process, which is required of industrial defense companies. As an aerospace company, the design certification process conforms to the industrial standards as established by MIL-HDBK-516 (Department of Defense 2001) and STAGNAG-4671 (North Atlantic Treaty Organization 2009).

Figure 3. Overview of the corporate case study product development process, complete with segments, phases, gate reviews, and underlying program tasks (containing activities).
The corporate design process includes all necessary aircraft design program tasks as per industry practice (Anderson Reference Anderson2004), structured accordingly to DOD 5000-2P phases and complete with design technical reviews (Department of Defense 2001). Each developmental phase has its set of systems engineering and product development activities as summarized into program tasks in Figure 3. Activities are gated by design reviews in the following order; systems requirements review (SRR), preliminary design review (PDR), critical design review (CDR), production go ahead (PGA).
The description of the development process in Figure 3 further highlights the concept freeze decision made at the SRR gate review, so we can consider activities before and after this key milestone. To highlight this distinction, as shown in the top row of Figure 3 we introduce the concept of a program segment, where we divide our study scope into four ‘segments’: before the concept is frozen (Before Concept Freeze, BCF), after the concept is frozen (After Concept Freeze, ACF), after the design is frozen (After Design Freeze, ADF) and after the production go ahead (After Production Go Ahead, APGA). This segmentation divides the development activities at useful breakpoints from a research perspective. The activities before BCF are concept level activities; after BCF, the concept is frozen, and it is then embodied and designed. After ADF, all design work is deemed finished, the design is tested to ensure compliance, and the manufacturing process is developed. After APGA, the initial builds off the production line are expected to meet performance requirements.
2.2 Data sources used in the study
For the basis of our analysis, two major programs were studied at the aerospace firm over a seven-year period. The effort represented an average of 20 person-years/annum of equivalent effort. These programs studied were the major UAV programs at the company.
2.2.1 Corporate product development documentation
Four independent sources of information within the company were used for this study, as shown in Figure 4. First, the corporate design process manual was used as a basis to structure the design processes (Figure 3). Then, information was sought on discussion of missed and changing requirements. This occurred in several document sets, depending on program phase.

Figure 4. Data sources used in the study.
For very late detection of missed requirements, the FRACAS contained the relevant information. For missed requirements detected after design freeze but before service, the ECR system contains the relevant information. For missed or evolving requirements before design freeze, gate review documentation provided information on the state of the requirements at each design review. Design reports were also used at the company for status of requirements up to design freeze.
For missed requirements detected after service, the FRACAS documented the prototype testing and in-service failures. An example of FRACAS is reporting of control departure of a payload gimbal in flight. Each design defect would have an outcome (or combination) of either drawing changes, recertification or becomes a permanent non-compliance.
For missed requirements detected after design freeze, the ECRs were the main documentation used and studied. The ECR logs the missed-requirement changes and associated necessary configuration changes to the design. An example of an ECR would be the design proposal of enlarging the tail cone area of an UAV to allow for greater airflow.
For missed requirements detected before design freeze, the considered missed requirements were those that failed a gate review. An example would be the design proposal is likely to have excessive weight in the judgement of the gate review committee.
2.2.2 Interviews
After assimilating the timeline and occurrence rate of missed requirements, refined confirmation of the cause was developed through formalized discussions with engineers using Kaizen type workshops. The key objective of the interviews was to confirm and clarify the root cause aircraft systems and development process activities as identified from the documentation review. In this format, engineers were asked general why-type questions that invoked the perspectives from both managers and working engineers. This added depth to the identification of root cause systems and originating activities.
The interviews were carried out with the eight engineers and two program managers that executed the development programs. Each of the interviewees has more than three years of experience working in aerospace development programs and has deep expertise in their respective fields. The combination of both interviews and documentation provided the necessary empirical basis to understand missed requirements and design decision defects in the development of a new product.
2.3 Analysis approach
Four major steps were taken to determine the root causes of missed requirements, as shown in Figure 5.

Figure 5. Analysis methodology.
2.3.1 Step 1: Clarify the sequence of development activities and collect design defect data
To define the development process as above for the two specific programs, the project Gantt charts of the corporate design process were studied, from segments, phases, tasks to activities. All task elements in the program schedule Gantt charts were abstracted to the level of the activities show in Figure 3.
Additionally, the missed-requirement design defects were listed from Gate review, ECR and FRACAS documentation. Each design defect was assigned an ID number and identified with the activity at which it was first detected.
2.3.2 Step 2: Identify root cause activity of each ECR
Next, a root cause analysis was conducted to trace systems engineering element from the onset of the design defect (through ECR and FRACAS) to the root systems engineering element. Each design defect was back-traced to the root cause through Kaizen event interviews. This was done starting with the design defect observation detection activity, and back-tracking through the chain of program activities. At each such antecedent activity, the particular analysis, selection, test or other action was highlighted. Further back-tracing was done, until identifying the point at which the incorrect decision was made. This activity where the incorrect decision arose is the root cause activity. Such specific analysis of each activity that cannot be readily extracted explicitly from documentation and have to be accomplished manually.
2.3.3 Step 3: List necessary activities to fix each ECR
For each root cause requirement, the compliance-driven corporate development process standard work also defines the activities which must be reworked to ensure the requirement and its cascaded effects are completed. Correcting a design defect generally requires reworking of interlinked activities in the development process. The interlinked activities form a chain that begins from where the design defect was detected to the root cause activity.
2.3.4 Step 4: Assess activity decisions for program impact
Given steps 1 to 3, we next derive and assess the cost of rework to a program due to design defects. With this, we can assess the statistical significance of the root causes attributed to the four different program segments BCF, ACF, ADF, APGA described in Figure 3.
To derive the cost of rework, first consider the case of no rework. Assuming there are no design defects throughout the development process, the total cost of a program is simply the sum of individual costs,
 $$\begin{eqnarray}E[\text{Total}~\text{Cost}]=\mathop{\sum }_{\text{activity}\,j}^{N}W_{j},\end{eqnarray}$$
where
![]() $W_{j}$
is the work cost required to complete activity
$W_{j}$
is the work cost required to complete activity
![]() $j$
. If design defects occur, however, then rework effort is added to the cost. At any activity, though, it is uncertain if a design defect will happen and thereby incur rework costs. The total expected cost becomes an uncertain quantity,
$j$
. If design defects occur, however, then rework effort is added to the cost. At any activity, though, it is uncertain if a design defect will happen and thereby incur rework costs. The total expected cost becomes an uncertain quantity,
 $$\begin{eqnarray}E[\text{Total}~\text{Cost}]=\mathop{\sum }_{\text{activity}~j}^{N}(W_{j}+R_{j}\text{Pr}_{j}),\end{eqnarray}$$
where
![]() $R_{j}$
is the sum of rework activities needed if activity
$R_{j}$
is the sum of rework activities needed if activity
![]() $j$
must be reworked, and
$j$
must be reworked, and
![]() $\text{Pr}_{j}$
is the probability of a design defect in activity
$\text{Pr}_{j}$
is the probability of a design defect in activity
![]() $j$
. Note the rework required for a design defect originating at activity
$j$
. Note the rework required for a design defect originating at activity
![]() $j$
may involve more activities than activity
$j$
may involve more activities than activity
![]() $j$
alone, depending on when the design defect was detected.
$j$
alone, depending on when the design defect was detected.
While Eq. (2) is the basis for the analysis, it breaks costs out by activity. In Eq. (2) the quantities
![]() $W_{j}$
and
$W_{j}$
and
![]() $R_{j}$
can be easily tabulated from the standard work and project documents. It is known how long each activity takes, and it is known what must be reworked if a design defect arises at each and every activity. However, the likelihood of a design defect
$R_{j}$
can be easily tabulated from the standard work and project documents. It is known how long each activity takes, and it is known what must be reworked if a design defect arises at each and every activity. However, the likelihood of a design defect
![]() $\text{Pr}_{j}$
arising at any activity
$\text{Pr}_{j}$
arising at any activity
![]() $j$
is not so easily determined. Data was insufficiently significant at the activity level to calculate
$j$
is not so easily determined. Data was insufficiently significant at the activity level to calculate
![]() $\text{Pr}_{j}$
. Instead, we compute the probability of a design defect over each program segment, discussed next.
$\text{Pr}_{j}$
. Instead, we compute the probability of a design defect over each program segment, discussed next.
2.3.5 Step 5: Compute impact of each program segment
We next determine the contribution of each program segment to total expected cost of a program. Data on work, rework and likelihood of design defects is available at this level of resolution.
To consider the rework costs by program segment, we compute average costs and probability of rework for the activities within a program segment. First, we determine the segment average values of
![]() $\text{Pr}_{i}$
,
$\text{Pr}_{i}$
,
![]() $\bar{W}_{i}$
and
$\bar{W}_{i}$
and
![]() $\bar{M}_{i}$
. The probability
$\bar{M}_{i}$
. The probability
![]() $\text{Pr}_{i}$
of a design defect occurring within a segment
$\text{Pr}_{i}$
of a design defect occurring within a segment
![]() $i$
is the occurrence rate of defective activities within a segment:
$i$
is the occurrence rate of defective activities within a segment:
 $$\begin{eqnarray}\text{Pr}_{i}=\frac{n_{i,\text{defects}}}{n_{i}},\end{eqnarray}$$
where
![]() $n_{i,\text{defects}}$
is the number of activities with a defect arising within the segment
$n_{i,\text{defects}}$
is the number of activities with a defect arising within the segment
![]() $i$
, and
$i$
, and
![]() $n_{i}$
is the number of activities within the segment
$n_{i}$
is the number of activities within the segment
![]() $i$
.
$i$
.
Note the data available from the 7 person-years of project data has sufficient occurrence rates at the segment level, but not at the activity level. At the activity level, many activities have zero defect counts and so were not statistically significant. At the segment level, all segments had over five occurrences typically deemed necessary for significance.
Similarly, the segment average rework rate
![]() $\bar{M}_{i}$
is an interesting statistic for comparison of segments:
$\bar{M}_{i}$
is an interesting statistic for comparison of segments:
 $$\begin{eqnarray}\bar{M}_{i}=\frac{1}{n_{i,\text{defects}}}\mathop{\sum }_{\substack{ j\in \text{segment}~i}}R_{j},\end{eqnarray}$$
where
![]() $n_{i,\text{defects}}$
is the number of activities with a defect arising within the segment
$n_{i,\text{defects}}$
is the number of activities with a defect arising within the segment
![]() $i$
, and
$i$
, and
![]() $R_{j}$
is the activity rework cost multiplier for activity
$R_{j}$
is the activity rework cost multiplier for activity
![]() $j$
. Similarly, the segment average work cost
$j$
. Similarly, the segment average work cost
![]() $\bar{W}_{i}$
is
$\bar{W}_{i}$
is
 $$\begin{eqnarray}\bar{W}_{i}=\frac{1}{n_{i}}\mathop{\sum }_{\substack{ j\in \text{segment}~i}}W_{j},\end{eqnarray}$$
where
![]() $n_{i}$
is the number of activities within the segment
$n_{i}$
is the number of activities within the segment
![]() $i$
, and
$i$
, and
![]() $W_{j}$
is the cost of activity
$W_{j}$
is the cost of activity
![]() $j$
.
$j$
.
With these segment level equations, Eq. (2) for the expected program total cost
![]() $E$
[Total Cost] we can compute the expected cost
$E$
[Total Cost] we can compute the expected cost
![]() $E[\text{Cost}_{i}]$
of a program segment
$E[\text{Cost}_{i}]$
of a program segment
![]() $i$
as;
$i$
as;
 $$\begin{eqnarray}E[\text{Cost}_{i}]=n_{i}\bar{W}_{i}+n_{i}\bar{M}_{i}\bar{W}_{i}\text{Pr}_{i},\end{eqnarray}$$
where
![]() $n_{i}$
is the number of activities in segment
$n_{i}$
is the number of activities in segment
![]() $i$
,
$i$
,
![]() $\bar{W}_{i}$
is the average activity cost in segment
$\bar{W}_{i}$
is the average activity cost in segment
![]() $i$
,
$i$
,
![]() $\bar{M}_{i}$
is the average rework rate in segment
$\bar{M}_{i}$
is the average rework rate in segment
![]() $i$
(Eq. (4)) and
$i$
(Eq. (4)) and
![]() $\text{Pr}_{i}$
is the average probability of reworking an activity in segment
$\text{Pr}_{i}$
is the average probability of reworking an activity in segment
![]() $i$
. Note that all quantities in Eq. (6) can be tallied from the available project data. Equation (6) is the form used and computed in the paper.
$i$
. Note that all quantities in Eq. (6) can be tallied from the available project data. Equation (6) is the form used and computed in the paper.
Finally, we calculate the percentage cost contribution of rework of each segment,
 $E[\text{Cost}_{i,\%}]$
as a fraction of all the segments;
 $$\begin{eqnarray}E[Cost_{i,\%}]=\frac{E[\text{Cost}_{i}]}{E[\text{Total}~\text{Cost}]}(100),\end{eqnarray}$$
where
![]() $E[\text{Cost}_{i}]$
is the total expected cost of segment
$E[\text{Cost}_{i}]$
is the total expected cost of segment
![]() $i$
(Eq. (6)), and
$i$
(Eq. (6)), and
![]() $E$
[Total Cost] is the total expected cost of the program (the sum of Eq. (6) over all segments
$E$
[Total Cost] is the total expected cost of the program (the sum of Eq. (6) over all segments
![]() $i$
).
$i$
).
3 Findings: Occurrence and impact of decisions
3.1 Activities and design defects
In step 1, we listed the design defects from the program data sources (Figure 4). Overall, out of 211 total system-level requirements, a total of 58 system-level design defect missed requirements occurred from the two major product development programs. Note there could be multiple misses over time for a particular requirement; for example, the endurance requirement changed at each gate review and after the final flight test.
Any design defect found is quantified with an engineering target specification for the rework activities to meet, so that the design would be made compliant to the desired specifications. For example, a particular avionics module may have had an over-heating problem when the operating temperature rose to
![]() $55~^{\circ }\text{C}$
in test where the required operating limit was 50 degrees Celsius. The ECR proposed relocating the air scoop location to increase airflow to the cooling system such that the avionics module maintained a temperature range between 40 and 50 degrees Celsius. The root cause was traced to inadequate heat load analysis from the modeling and simulation design activity. By tracking these design rework measures, we could understand which subsystem was associated with the design defect.
$55~^{\circ }\text{C}$
in test where the required operating limit was 50 degrees Celsius. The ECR proposed relocating the air scoop location to increase airflow to the cooling system such that the avionics module maintained a temperature range between 40 and 50 degrees Celsius. The root cause was traced to inadequate heat load analysis from the modeling and simulation design activity. By tracking these design rework measures, we could understand which subsystem was associated with the design defect.
In total, 264 ECRs, FRACAS, gate review and design reports were reviewed. The breakdown of the 58 design defects by subsystem is shown in Figure 6 and the breakdown by data source is shown in Table 3. Most of the design defects are attributed to the novel structure and avionics, which was expected as most of the design activities are concentrated on these systems. The electrical and mechanical systems were traditional designs available from vendors. The breakout in Figure 6 also indicates most of the design defects were on the in-house activities, consistent with that found elsewhere (Obaid et al. Reference Obaid, David, Mark and Frances2005). The engineering novelty was concentrated in these structure and avionics systems developed in-house. 66% of the design defects were from ECR and FRACAS data sources, which is an indication that most design defects were discovered late in the development process.
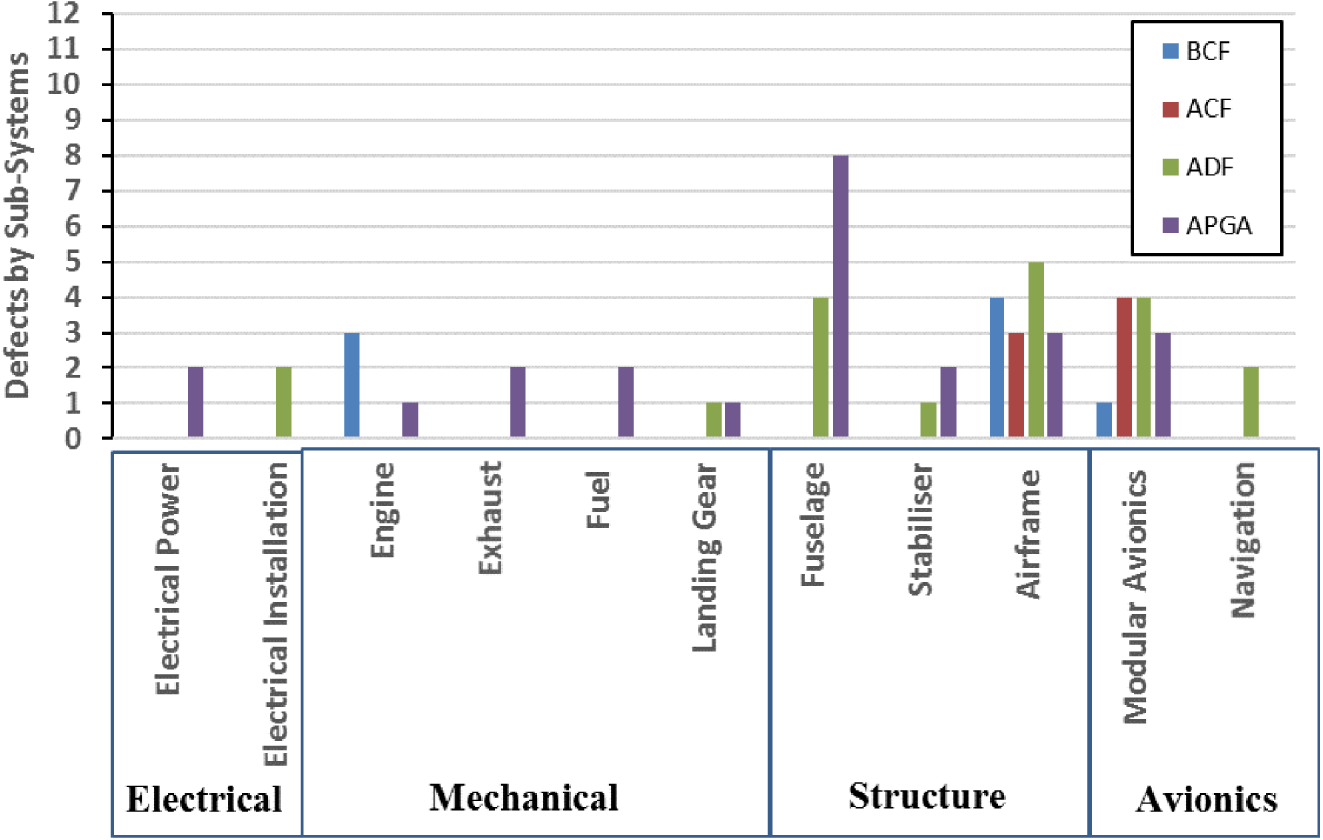
Figure 6. Breakdown of design defects detected by subsystem.

Figure 7. Breakdown of design defects by activity where detected.
Table 3. Data source breakdown

Next, the breakout by activity is shown in Figure 7. We found that eight of the design defects were detected before concept freeze, seven before design freeze, 19 after design freeze during testing, and 24 arose only once in field service. Of the 19 design defects detected during testing, 13 of them were not identified until final flight testing began. This result indicates that at least 13 of the 211 total requirements, required system-level testing activities to determine consistency. Overall, 6% of the total system requirements could not be determined prior to final flight testing in the development process used at this company.
Next in step 2 (Figure 4), we trace each design defect to its root cause activity. Each design defect was followed regressively back through the design process Gantt chart, and included analysis of the design review documentation and design reports associated with each activity. From this information, we are able to isolate the onset activity for each design defect. This is plotted as the dark bars in Figure 8 for the 58 total design defects.
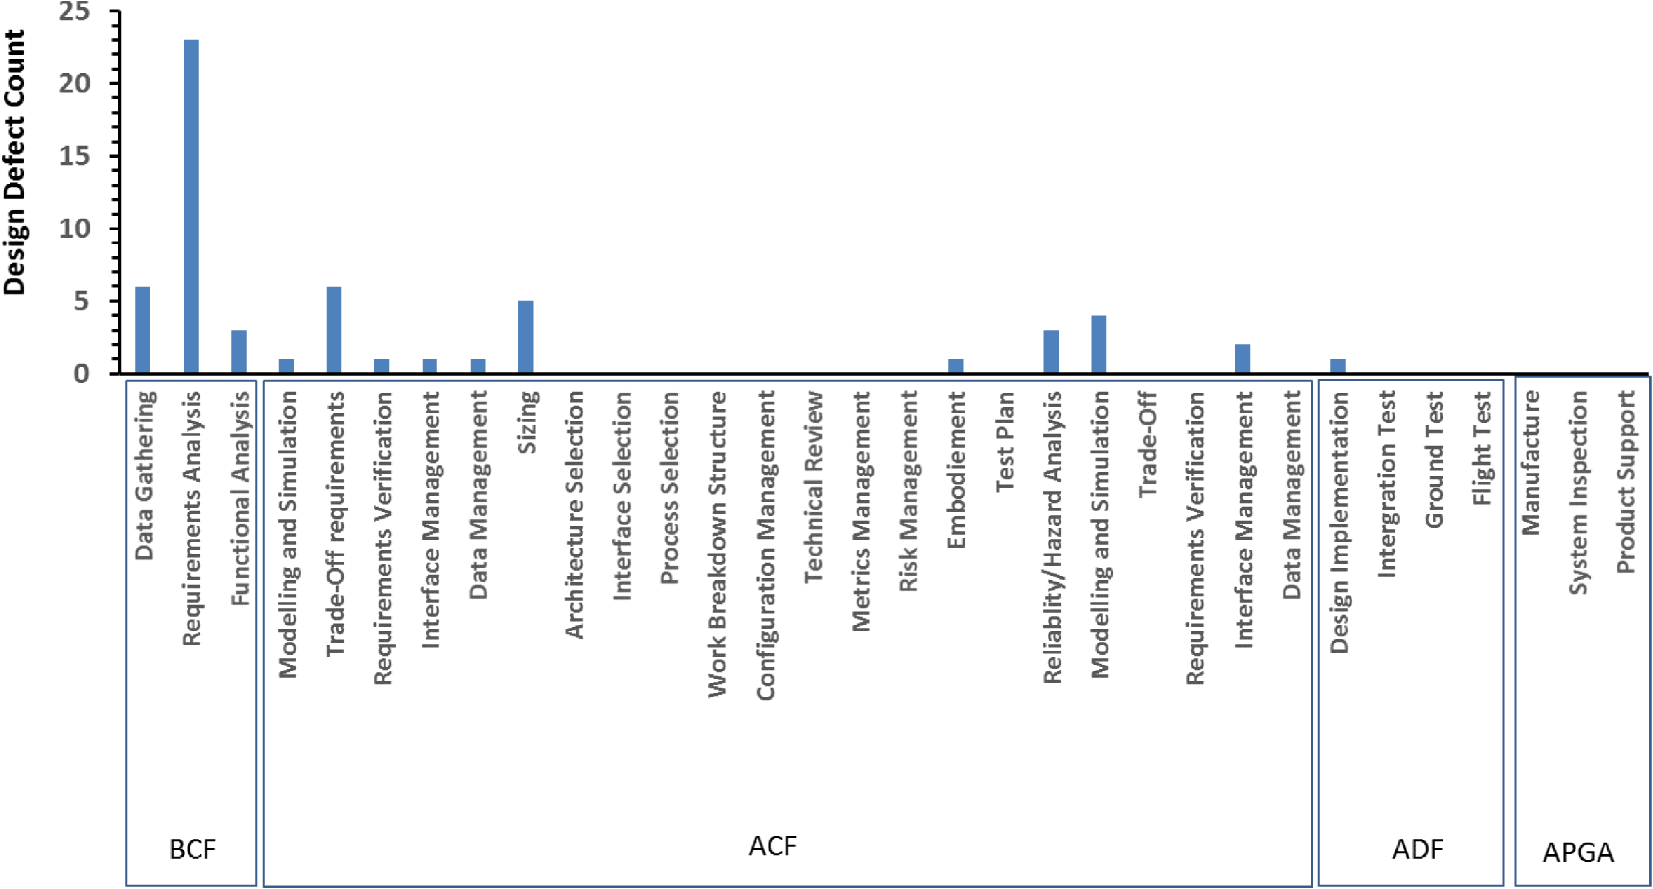
Figure 8. Breakdown of design defects root cause activity.
To ensure that the design defects are adequately categorized to its root program segment and subsystem, an inter-rater agreement measure was carried out. The design defect root cause analysis was repeated twice using two engineers on the projects, for all 58 design defects. The Cohen’s Kappa was 0.81 for the root cause activity identification (Figure 8) and 0.90 for the root cause subsystem identification (Figure 6). Both results show a good agreement for the categorization of root cause program.
Studying Figures 7 and 8, conclusions can be further drawn. At 23 design defects, the dominant root cause of design defects is attributed to the requirements analysis, which occurs in the early concept phase BCF program segment. This is the point in the program when requirement targets for the design are defined, and requires estimation of subsystem capabilities and their mutual impact. This result follows and confirms others who have noted the difficulty and impact of requirements definition (Almefelt et al. Reference Almefelt, Berglund and Nilsson2006). The BCF segment had more than half of the design defects as root cause (32 total), and the remainder were in the ACF and ADF design program segments (25 and 1 total). No root cause design defects arose in the testing or operation phases, as expected.
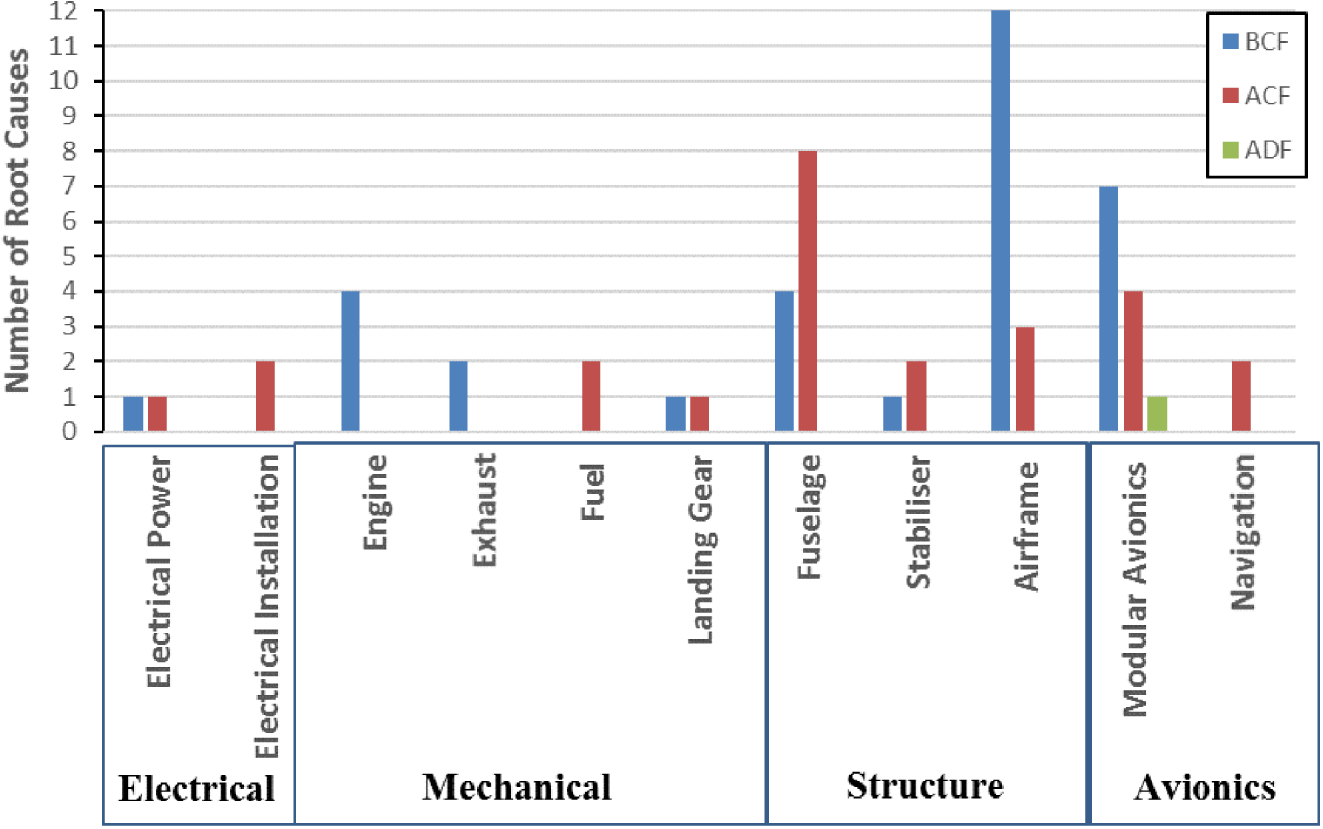
Figure 9. Breakdown of design defect root causes by subsystem.
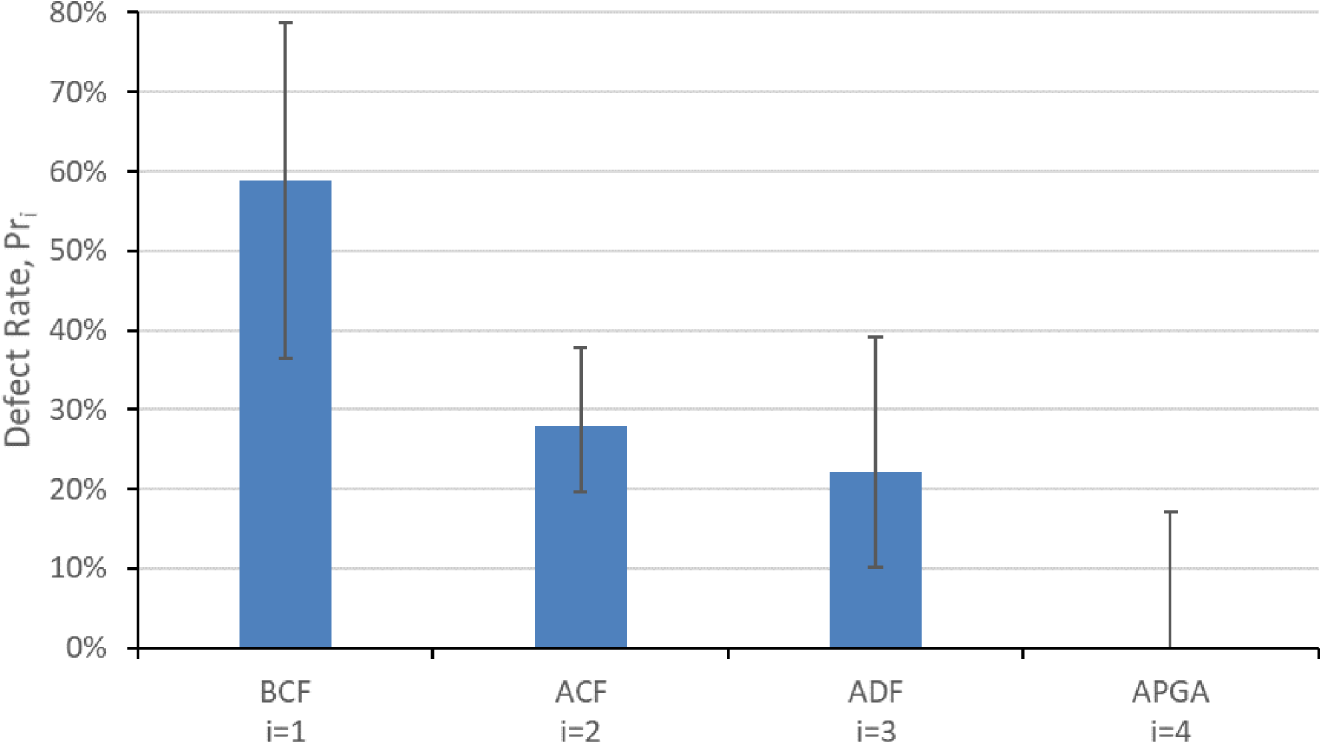
Figure 10. Occurrence rate of root cause of design defects by program segment.
In addition to identifying the root cause activity, the root cause subsystem was also identified. This is shown in Figure 9. Notice the airframe had the most root cause design defects, which was due to its novel construction which was a major objective of the design concept. Conventional electrical and mechanical systems were used which the design team had extensive previous experience.
The count of activities and number of design defects is shown in Table 4, and the occurrence rate graphed in Figure 10. Notice the likelihood of a mistaken decision culminating in a missed requirement is much higher for early phase design decisions. The likelihood a decision made in the early BCF segment was computed as 59%, a very high rate, significantly different from the latter segments. This result holds for this company using their particular development process. Note the 95% confidence intervals were rather large given the small sample sizes (Table 4), but the concept phase versus later phases result remains significant.
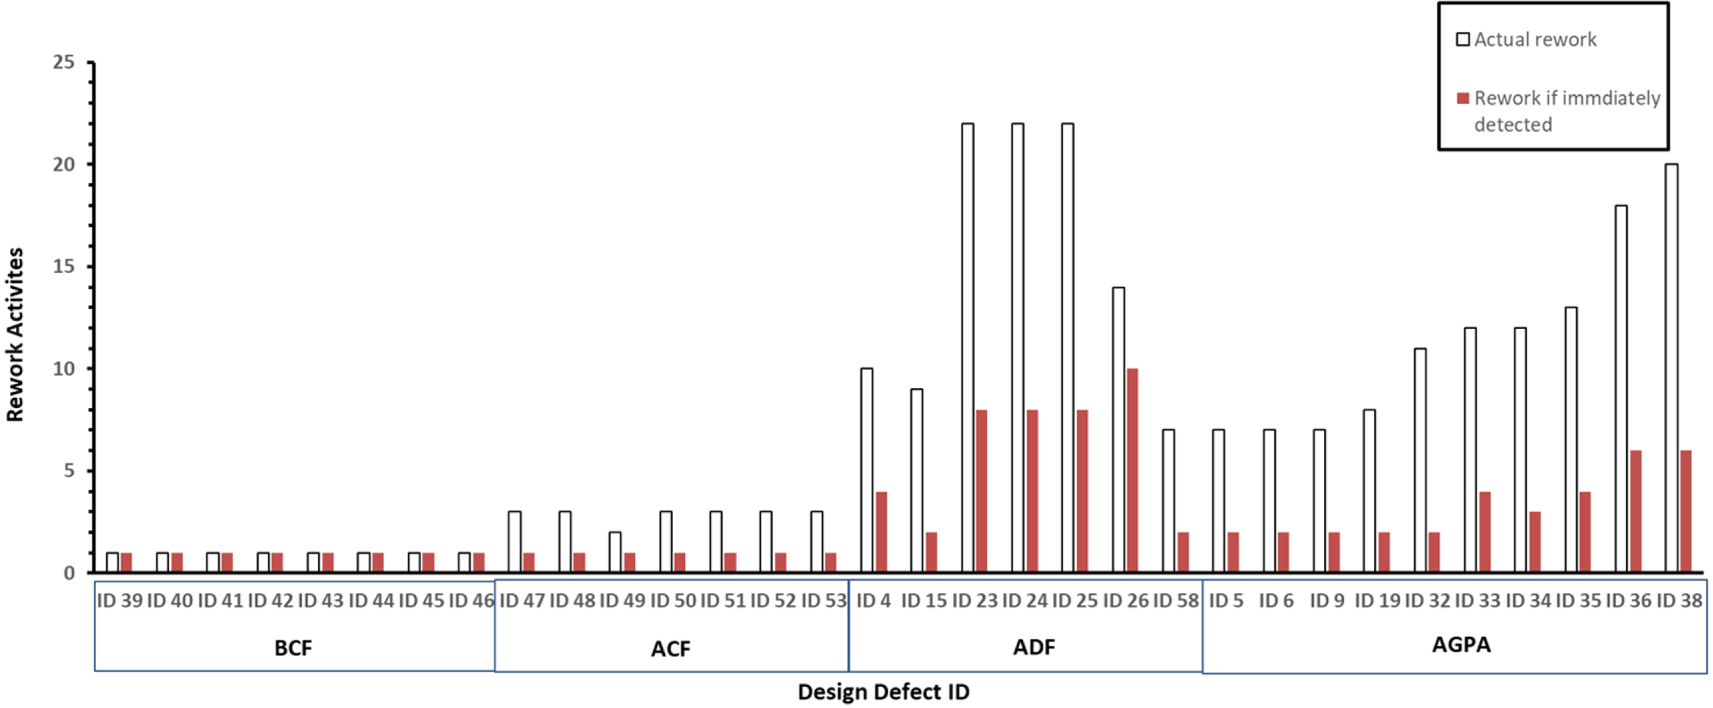
Figure 11. High rework activities for defects originating BCF.
Table 4. Design defect occurrence rates

3.2 Impact analysis
Following the next step 3 outlined in Figure 5, we next analyzed for the rework activities needed to fix each design defect. This allows for a comparison of impact. When doing this rework assessment of each design defect, a second point of comparison was computed. For each design defect, not only was the actual rework determined, but we also computed the difference in rework activities needed if the defect had been discovered immediately after it was detected.
These results are shown in Figure 11 for the concept segment BCF design defects (32 total) and in Figure 12 for the program segment ACF defects (25 total). One comparison to consider is the difference in count of rework activities needed between the concept phase and design phase defects. That is the comparison of rework activity counts (graph vertical axis height) between Figures 11 and 12. As can be seen, concept phase defects require more rework. A second comparison to consider is the difference in actual rework required and the theoretical rework that would have been required if the defect were immediately detected. In each graph, this is the difference in white and dark vertical bars for each activity.
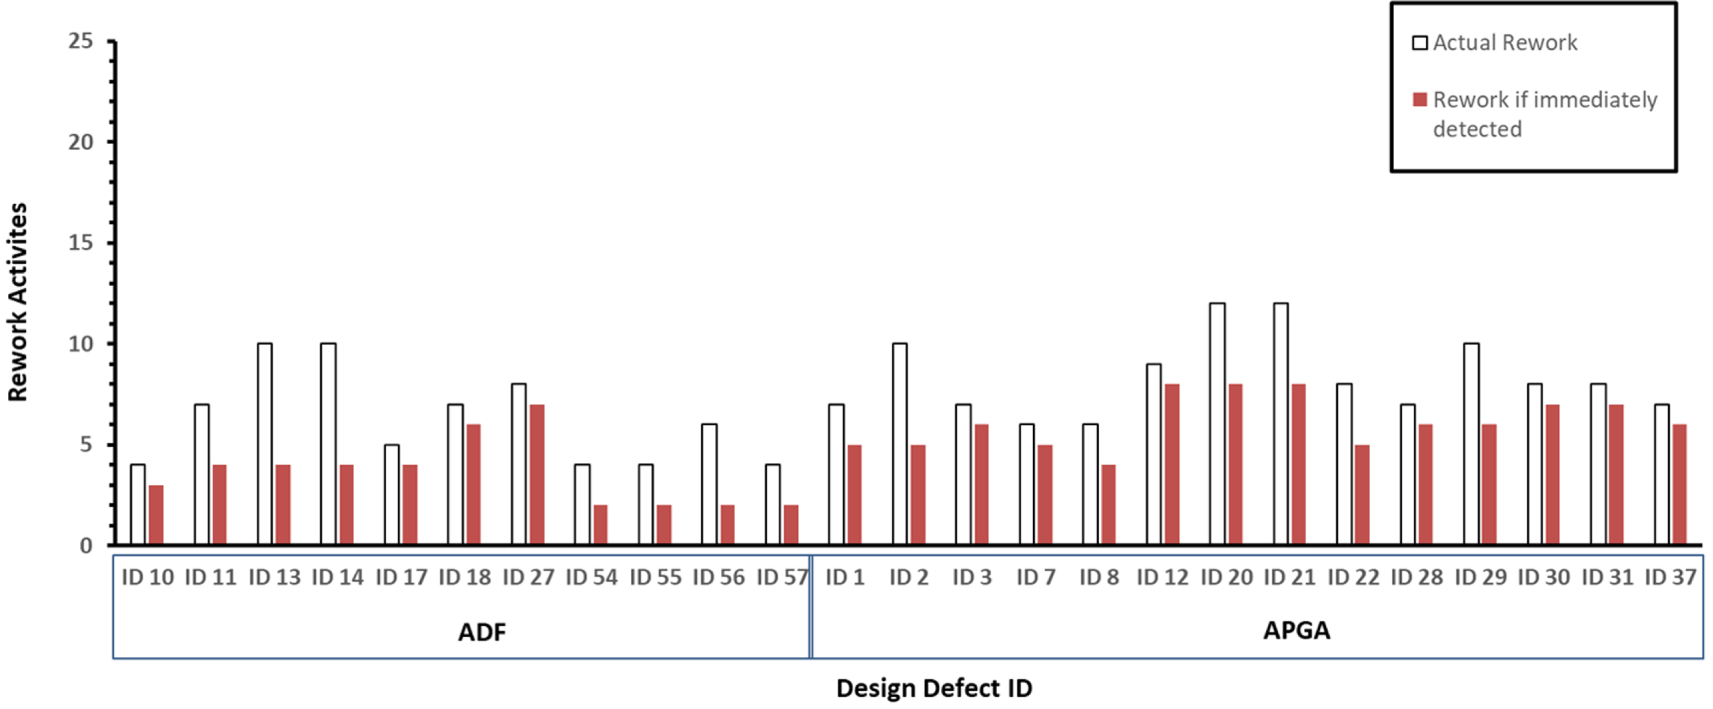
Figure 12. Lower rework activities for defects originating ACF.
An observation of Figures 11 and 12 shows that it is costlier in terms of rework activities to resolve design defects originating from the BCF program segment, as more rework activities have to be executed. This is shown in Figure 13, which considers the increased rework needed for concept phase design defects that are discovered later. Also, the rework activity would always be substantially less if it were to be discovered immediately at the point of occurrence. This is all consistent with observations of impact of defects determined late versus early reported elsewhere (Tassey Reference Tassey2002). We here build on those works in our analysis of root cause occurrence.
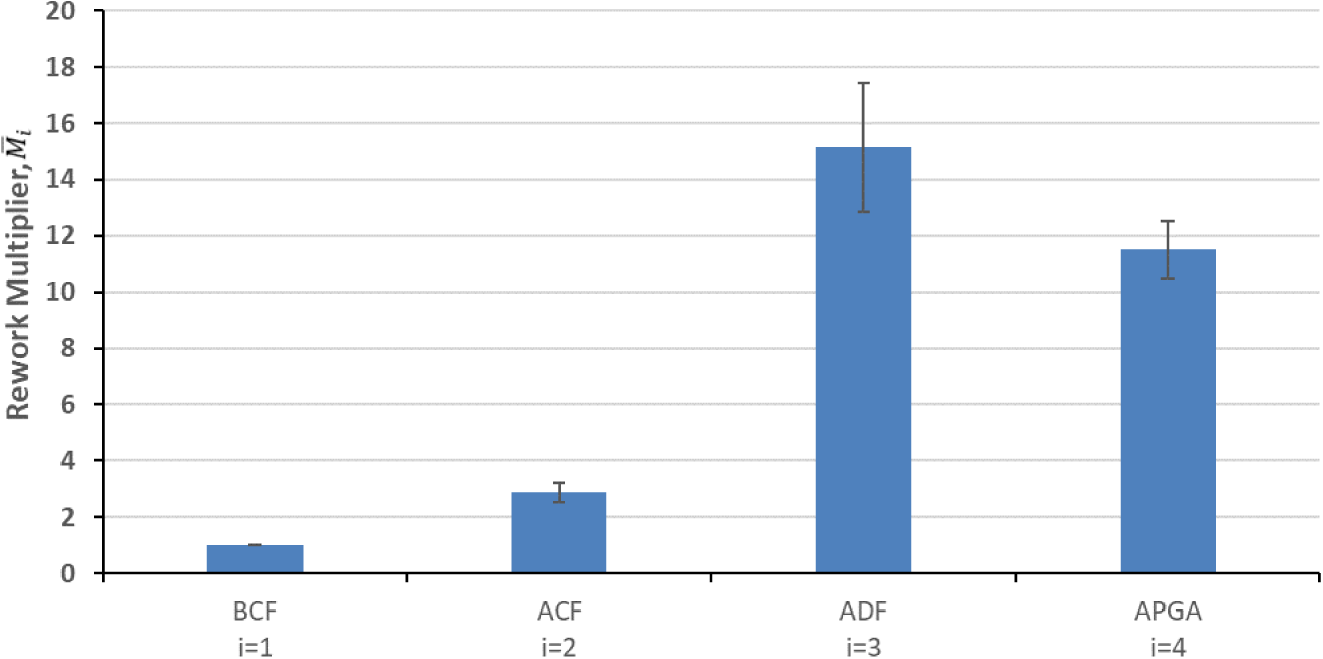
Figure 13. Average rework multiplier for when a BCF design defect is detected.
The average rate of increase in percentage of rework activities between the BCF and ACF program segments is as illustrated in Figure 13. It is observed that a statistically significant average of 13.0, or 13 times more activities were required for this company to fix a concept phase design defect not detected until after system-level testing and in-service. This statement is now quantified for this data set. A similar analysis shows a multiplier of 15.1 for the ADF program segment, and 2.9 for the ACF program segment.
This compares with earlier from Boehm & Papaccio (Reference Boehm and Papaccio1988), Boehm & Basili (Reference Boehm and Basili2001), who found a multiplier of 50 for the BCF segment, and with NASA who found a multiplier of 29-1000X for spacecraft systems (NASA 2016). Our results differ from previous in that the last column of BCF defects detected very late while in the APGA segment (in-field operation) had a lower multiplier than defects found during testing (Figure 13). This is because in our case, such defects were not actually fixed; instead usually the defect was interrogated and requirements revised and the issue accepted as a non-compliance and operations modified. Therefore, the actual rework activities simply involved issuing the non-compliance and so were less.
Table 5. Contribution of work and potential rework attributed to each program segment

Next, we apply Eq. (2) and compute the contributions of each segment to expected cost. As a percent, this is in the last column of Table 5, as graphed in Figure 14. The results show that, for this company using their development process, 86% of cost was determined by design before design freeze. Within that, 34% had been determined before concept freeze. These results were statistically significant at 95% confidence (Figure 14).

Figure 14. Cost contributions of each program segment.
3.3 Confirming results through interviews
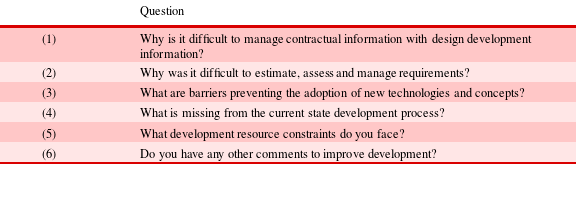
After this analysis, interview sessions were conducted to confirm the results and ensure that the interviewee’s responses were complete, thorough, and meaningful. Six question categories were interactively asked in a recursive 5-why’s approach (Ohno Reference Ohno1988) as shown in Table 6.
Table 6. Question categories to understand design defects
The responses in the interviews were then holistically coded (Saldana Reference Saldana2015), and two (2) coders were used to conduct an inter-rater agreement measure. The resulting Cohen’s Kappa was 0.80, indicating good agreement. Typical responses are shown in Table 7; where the responses provided for better understanding of the root cause activity and subsystem.
Table 7. Typical interview responses

These interview statements were then categorized into eight interview categories and the number of interview responses against these categories was summed across the interviews, as shown in the second column of Table 8.
Table 8. Interview response agreement with design defect analysis
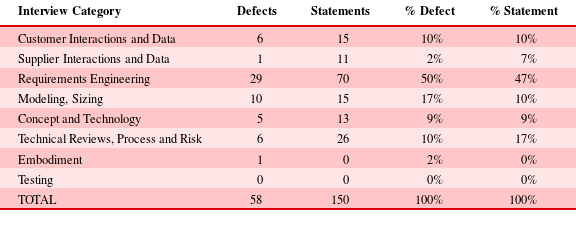
To relate the interview responses to the previous activity quantification, the 58 design defects (Figure 7) were also grouped into eight categories. This is shown in the third column of Table 8. The relative percentage of design defects and interview statements is shown in Table 8, and a Chi squared test indicates the two agree with p-value
![]() ${<}0.002$
. This agreement indicates the earlier quantified analysis is supported by the engineers’ perceptions.
${<}0.002$
. This agreement indicates the earlier quantified analysis is supported by the engineers’ perceptions.
4 Discussion: Impact of early phase decisions
4.1 Reviewing the evidence gathered
We have shown from ECR, FRACAS and gate reviews that there is indeed a distinctively higher number of corrective activities required to rectify missed design requirements originating from before a design concept is frozen. H1 and H2 are therefore supported.
For H3, our data has shown that 25 of the 58 (most frequent) missed requirements are attributed to concept phase requirements analysis. The interviews with engineers also reaffirmed that requirement changes could be better managed with better understanding of requirements trade-off and definition during conceptual design. Hence, H3 is supported.
4.2 Limitations
This is a longitudinal study at one large company, limited to the tools, methods, experience and processes used to develop new products. The high impact root cause of requirements management may not hold true at other firms should they have a means to establish requirements targets early. However, other studies echo our results here (Almefelt et al. Reference Almefelt, Berglund and Nilsson2006). Therefore, if the company were to invest in improved conceptual design stage methods and tools, perhaps the error rate could be reduced. There is an incentive to do so, since 86% of the rework cost committed is determined before design freeze. Nonetheless, this study is typical of an aerospace firm today.
The second limitation is our findings with relation to the 80–20 rule. Based on the evidence, this validation can only hold for new product development in a mid-sized aerospace-level system complexity. This may or may not extend to very large-scale systems and may not extend to small-scale individual projects. Further investigations are needed.
Another limitation is the consideration of the means to mitigate design defects and their effectiveness. In the literature, we find at least two distinct approaches used to address concept phase design defects. One path is to build prototypes and a second is to analyze concepts using modeling and simulation. Both provide improved estimates of expected as-delivered system-level requirement outcomes at different configurations and sizes.
The first approach to mitigate design defects is through the use of physical prototypes and empirical testing of many concepts early in the conceptual design stage (Camburn et al. Reference Camburn, Dunlap, Kuhr, Viswanathan, Linsey, Jensen, Crawford, Otto and Wood2013; Camburn et al. 2014; Dunlap et al. Reference Dunlap, Hamon, Camburn, Crawford, Jensen, Green, Otto and Wood2014; Camburn et al. Reference Camburn, Jensen, Crawford, Otto and Wood2015a ,Reference Camburn, Dunlap, Gurjar, Hamon, Green, Jensen, Crawford, Otto and Wood b ,Reference Camburn, Sng, Perez, Otto, Wood, Jensen and Crawford c ). They provide the designers with information on whether the conceptual design is sound. This applies the design philosophy ‘Fail fast, fail often’ (Ullman Reference Ullman2015) and the concept of a ‘minimum viable product’ (Ries Reference Ries2011) to provide rapid assurance of system-level requirements. A difficulty with prototyping can be the build time and cost of highly complex technology, e.g., jet engines, high performance aircraft, long range strategic submarines, etc.
A second approach to mitigating design defects also often used is model-based analysis of preliminary concepts (Agte, Shougarian & De Reference Agte, Shougarian and De Weck2012). Models can be used to provide rapid assessment and trade-off analysis of different requirements. This applies the philosophies ‘Emphasize the key set of issues’ (Almefelt et al. Reference Almefelt, Berglund and Nilsson2006) and ‘get it right the first time’ (Thomke Reference Thomke1998) to provide rapid assurance of system-level requirements. A difficultly with modeling can be the effort needed to build high fidelity models and also model error (Kenway & Martins Reference Kenway and Martins2014; Huang et al. Reference Huang, Xu, Zhang and Chen2015).
Finally, for the analysis approach used, another limiting factor is that the data originates from the design defect documentation and the case is built around correction activities on these design defects. This does not address whether some requirements are close to the threshold of failing. What is detectable is the rework activities required as a result of design defects.
5 Conclusions
Overall, this work showed the impact and occurrence rates of design defects. Our results would suggest that by assessing requirement change impact early, a design team could develop a forward perspective and plan strategies to mitigate or correct their impact. This indicates research is needed to establish formalized systems that can incorporate and manage not just design requirements but also their margins and mitigation strategies early and throughout development. This should be easily complemented with current product development processes to aid in the enhancement of design practitioners. These views are also supported by the work of Almefelt & Andersson (Reference Almefelt and Andersson2004), Bergsjö, Almefelt & Malmqvist (Reference Bergsjö, Almefelt and Malmqvist2010), Bertoni, Bertoni & Isaksson (Reference Bertoni, Bertoni and Isaksson2016).
Our work showed that design defects occur equally before and after the conceptual design freeze. However, the design activities required to correct design defects arising before concept freeze are 13 times higher than after. This then translates into design decisions carrying 86% of total work plus potential rework costs. As such, the anecdotal 80–20 rule of design development cost is validated, that the 80 percent cost committal stems from before the design freezes for complex systems. We also found that the majority of the design defects originating from before concept freeze is attributed to requirement analysis. Consequently, we found that difficulty ensuring consistency and trading off requirements was the highest occurring root cause of design defects.
Acknowledgments
This work has been funded and supported by the Economic Development Board of Singapore under the Industrial Partnership Programme. The authors would also like to thank the SUTD-MIT International Design Centre (IDC, idc.sutd/edu/sg) for financial and intellectual support. Any opinions, findings, or recommendations are those of the authors and do not necessarily reflect the views of the supporters.


