Published online by Cambridge University Press: 10 November 2009

1 John Courtney has provided a much needed comprehensive review of the evolution of national party conventions in Canada in The Selection of National Party Leaders in Canada (Toronto: Macmillan, 1973)Google Scholar. Among other general works on the convention process, see Smiley, D. V., “The National Party Leadership Convention in Canada: A Preliminary Analysis,” this JOURNAL 1 (1968), 373–97Google Scholar; Punnett, R. M., “Selection of Party Leaders: A Canadian Example,” Journal of Commonwealth Political Studies 1 (1970), 54–69CrossRefGoogle Scholar; and Baar, Carl, “Party Organization, Convention Organization and Leadership Selection in Canada and the United States” (paper presented to the annual meeting of the American Political Science Association,Los Angeles, 1970)Google Scholar. A number of studies of particular conventions are also of value in assessing the pattern of development of the leadership selection process in Canada. In addition to Courtney's discussion of a number of conventions, see Lederle, John, “The Liberal Convention of 1893,” Canadian Journal of Economics and Political Science 16 (1950), 42–52CrossRefGoogle Scholar; Lederle, John, “The Liberal Convention of 1919 and the Selection of Mackenzie King,” Dalhousie Review 27 (1947), 85–92Google Scholar; Williams, John R., “The Selection of Arthur Meighen as Conservative Party Leader,” Canadian Journal of Economics and Political Science 17 (1951), 234–37CrossRefGoogle Scholar: and LeDuc, Lawrence, “Party Decision Making: Some Empirical Observations on the Leadership Selection Process,” this Journal 4 (1971), 97–118Google Scholar. Biographical sources also provide useful information regarding specific conventions. See especially Ward, Norman (ed.), A Party Politician: The Memoirs of Chubby Power (Toronto: Macmillan, 1966)Google Scholar, and Willison, J. S., Sir Wilfrid Laurier and the Liberal Party: A Political History (Toronto: Morang, 1903)Google Scholar. Among the more important journalistic accounts of the two conventions which form the subject matter of this paper, see Peacock, Donald, Journey to Power (Toronto: Ryerson, 1968)Google Scholar, and Brown, Patrick, Chodos, Robert and Murphy, Rae, Winners and Losers (Toronto: Lorimer, 1976)Google Scholar.
2 Courtney, Selection, 21–30.
3 Ibid., 59–73. See also Lederle, “The Liberal Convention,” 85–88.
4 Courtney, Selection, 66–68.
5 Ibid., 77.
6 Arthur Meighen was selected as leader in 1941 by a meeting of the party executive, parliamentary caucus, and defeated candidates, the only exception to the selection of leaders by party conventions. Meighen, defeated in a by-election, served only until the election of Bracken at a party convention in 1942.
7 Peter Regenstreif attributes this tendency in Liberal conventions prior to 1968 to the general absence of functioning, widely representative constituency organizations which could not be controlled by the local member. Peter Regenstreif, “The Liberal Party of Canada: A Political Analysis” (unpublished doctoral dissertation, Cornell University, 1963), 204–05. See also the recollections of Senator Power with reference to the 1948 and 1958 Liberal conventions in Norman Ward (ed.), A Party Politician, 371–72.
8 Regenstreif, “The Liberal Party,” 205–06.
9 Ibid., 391–95.
10 Smiley, “The National Party Leadership Convention,” 375.
11 Ibid., 375–78.
12 The data on the Conservative convention of 1976 are from a mail survey of delegates conducted by Robert Krause immediately following that convention. The initial sample was composed of 600 delegates whose names were drawn randomly from a list stratified by delegate classification (constituency, ex officio, and so forth). Of the 600 questionnaires mailed, 306 usable replies were received, providing an overall return rate of 51 per cent. Ontario delegates were systematically oversampled in the survey to permit comparison with a provincial sample, and an appropriate corrective weighting procedure was employed to maintain a representative national sample, the effective size of which is 260. Weighted N's are shown in all tables.
First-ballot supporters of Clark and Stevens are slightly overrepresented in the total distribution, while supporters of Wagner, Mulroney, and Nowlan are slightly underrepresented. Overall, however, the sample approximates the distribution of first-ballot votes within acceptable statistical limits as measured by a goodness of fit test (X2) which is not significant at the .05 level. Variations by region and delegate classification are likewise not significant.
The 1968 Liberal data are from a survey of 305 delegates conducted by Lawrence LeDuc following the Liberal convention. A description of this study may be found in LeDuc, “Party Decision Making.”
Copies of both the French and English questionnaires employed in these two studies may be obtained from the co-authors.
13 See the comparison of procedures between Canadian and American conventions in Carl Baar, “Party Organization.”
14 In the 1968 Liberal sample, only 9 per cent of the delegates indicated any type of binding pre-convention commitment. LeDuc, “Party Decision Making,” 102.
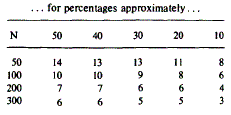
15 As in any survey, considerations of sampling error should be borne in mind in interpreting data reported here. This is particularly important in working with small samples from finite populations. The following table of 95 per cent confidence limits is appropriate for use with the two surveys reported here…. for percentages approximately…

16 Some supporters of Paul Martin, for example, in the 1968 Liberal sample mentioned “past service,” while supporters of candidates such as Turner, Kierans, or Greene were among those mentioning cabinet positions. See LeDuc. “Party Decision Making,” 100–01.
17 In the 1968 Liberal sample, only 7 per cent of those supporting Greene on the first ballot and 23 percent of those supporting MacEachen were voting “true preference.” Fifty-nine per cent of the first-ballot MacEachen voters mentioned regional loyalty as the reason for their vote, while 25 per cent of those supporting Greene said that they were voting for him because of his performance at the convention. LeDuc, “Party Decision Making,” 102.
18 Gallup surveys, for example, consistently find a large minority of “undecided” voters, even late in an election campaign. In a post-election survey of the 1974 electorate, 61 percent indicated that they had decided how to vote six weeks or more before the election, while 19 per cent were still undecided in the final week of the campaign. See Clarke, Harold, Jenson, Jane, LeDuc, Lawrence and Pammett, Jon, Political Choice in Canada (Toronto: McGraw-Hill Ryerson, 1978)Google Scholar, chap. 9. Among 1976 Conservative delegates, the conventional wisdom was that there were many “undecided” going into the convention. Brown et al.. Winners and Losers. 36.
19 In Australia, an increasing number of constituencies in recent elections have been decided on second preferences. For a general discussion of Australian elections and voting behaviour, see Rydon, Joan, “The Electoral System,” in Mayer, H. and Nelson, H. (eds.), Australia Politics: A Fourth Reader (Melbourne: Chesire, 1976), 402–14Google Scholar. See also Aitkin, Donald and Kahn, Michael, “Australia: Class Politics in the New World,” in Rose, Richard (ed.), Electoral Behaviour: A Comparative Handbook (New York: Free Press, 1974), 437–80Google Scholar.
20 A more detailed analysis of ballot switching in the Liberal convention of 1968 may be found in LeDuc, “Party Decision Making,” 107–09. For a more general discussion of the Winters candidacy and its relationship to some of the others, see Peacock, Journey to Power, 299–301.
21 Brown et al., Winners and Losers, 60.
22 A Spearman coefficient computed between the ranking of candidates according to “true preference” (Table 3) and amount of “slippage” (Table 7) for the Conservative convention of 1976 was .73; for 1968 Liberal candidates a comparable coefficient of .91 is obtained.
23 The 1968 Liberal survey shows Trudeau gaining 22 percent of Greene's first-ballot support, 57 per cent of Kierans, 35 per cent of MacEachen's, 35 percent of Martin's. and 3 per cent of Turner's. Hellyer held 89 per cent of his first-ballot support on the second ballot. LeDuc, “Party Decision Making,” 108.
24 The 1968 survey estimates that Trudeau obtained 60 per cent of the votes of those delegates who would have preferred Sharp on the first ballot, and 80 per cent of the same group on the final ballot. LeDuc, “Party Decision Making,” 105.
25 On the final ballot, Turner was able to hold only 67 per cent of his third-ballot support according to the 1968 survey, while Trudeau gained 25 per cent of these votes and Winters 9 per cent. Turner did, however, gain a scattering of votes from Hellyer supporters on the final ballot. LeDuc, “Party Decision Making,” 108.
26 Brown et al., Winners and Losers, 21.
27 See the ideological array of Figure 2. By region and political experience, the Sharp supporters were closer to those of Winters than to Trudeau. There was no statistically significant difference in terms of socioeconomic status (from previously unpublished data).
28 Brown et al., Winners and Losers, 123–24.
29 See the reforms proposed by Smiley, “The National Party Leadership Convention,” 395–98. Courtney also discusses the possible implications for bargaining and persuasion of the proposed adjournment between ballots. Selection, 211–12.
30 Brown et al., Winners and Losers, 11–12.
31 Delegates in the sample were not asked to define the terms “left” and “right,” but were categorized in terms of their self-identification on an ideological continuum. Only 5 per cent of the delegates sampled were unable or unwilling to classify themselves on the continuum.
32 Political experience (measured in years) is employed here rather than age because it appears more directly relevant to cleavages within the party. Because age and political experience are highly correlated, the choice of either of these variables in most multivariate analyses precludes a control for the other. However, age, political experience, and other related variables can be examined separately and the distinction between these results is of some relevance to our subsequent analysis. Political experience and age are treated in our analysis as interval scales for most purposes and as dichotomies for tabular analysis. Both are dichotomized in terms of the mean scores for the entire sample, 38 years of age and 12.6 years political experience.
33 Representation at the Conservative leadership convention of 1976 was determined by the following formula. Each federal constituency association elected six delegates, of whom at least one was to be a woman and two were to be under the age of 30. The constituency associations of the party thus sent 1,584 delegates to the convention, or 60 per cent of the total number of eligible delegates (2,582). Other representative delegate categories were ex officio delegates (privy councillors, senators. MPs, defeated candidates, MLAs or provincial leaders, national executive, treasury committee, national policy and advisory committee), delegates-at-large, elected delegates-at-large (elected by the provincial associations) and post-secondary Progressive Conservative youth clubs.
34 A more detailed analysis of patterns of participation among 1968 Liberal delegates may be found in Lawrence LeDuc, “Liberal Convention Delegates: A Case Study in Participation and Recruitment,” in H. Clarke and R. Price (eds.). Recruitment and Leadership Selection in Canada (forthcoming).
35 For most delegates who reported that they had held a party office. the office held was a position on a constituency executive. Fifty-one percent of the 1968 Liberal delegates and 56 percent of the 1976 Conservatives reported that they had held a position on a federal or provincial constituency executive.
36 These patterns are evident from Table 7 even though the percentages are computed within regions. Clark, for example, drew 42 per cent of his total first-ballot vote from among the western delegates in our sample.
37 The same observation has been made regarding the candidacies of Turner and Winters in the Liberal convention of 1968. Both had family ties in a region of the country other than their home region. Winters’ strength in the Maritimes may have been partially attributable to regionalism. See LeDuc, “Party Decision Making,” 111–13.
38 According to the 1968 survey of Liberal delegates, Trudeau gained 61 per cent of the first ballot among Quebec delegates, 23 per cent in Ontario, 30 per cent in the Maritimes, and 33 per cent in the West. LeDuc, “Party Decision Making,” 112.
39 See, for example, the analysis of the 1967 Conservative and the 1968 Liberal conventions by Lele, J., Perlin, G., AND Thorburn, H., “The National Party Convention,” in Thorbum, H. (ed.), Parly Politics in Canada (3rd ed.; Toronto: Prentice-Hall, 1972), 106–19Google Scholar.
40 Forty-one per cent of the 1968 Liberal delegates and 45 per cent of the 1976 Conservative delegates sampled indicated that they felt the ideological classifications were “important” to most delegates.
41 Fraser, for example, appears to have been a candidate with a very unclear ideological image in the Conservative convention in 1976 while Kierans was such a candidate in the Liberal convention in 1968.
42 Wagner, for example, received 66 per cent of his first-ballot votes from that group of delegates who placed themselves on the right of the party while Clark's first-ballot support was made up only of 20 per cent from this group.
43 Courtney, Selection, 253–59.
44 Statement at a press conference the day after the convention, The Globe and Mail (Toronto), April 8, 1968, I.
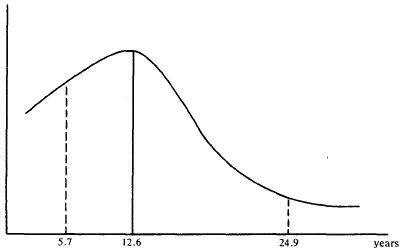
45 The comparable percentage among 1968 Liberal delegates was 19 per cent. See LeDuc, “Party Decision Making,” 116. The nature of the distribution of political experience among Conservative delegates in 1976 may be seen in the dispersion of delegates around the mean of 12.6 years. When the variable is dichotomized at the mean, 64 percent of the total sample falls below, while only 36 percent is above the mean. Within the lower grouping, the mean political experience is 5.7 years, while that for the group above the overall mean is an impressive 24.9 years.

46 There is only a very slight tendency for delegates who classify themselves as right of centre to be concentrated in the West or in any other single region, and the relationship is not a significant one.

“Newcomers” to the party, however, do exhibit a tendency to classify themselves to the left-centre of the political spectrum as evidenced by the statistically significant relationship between ideological self-classification and political experience. Stated in percentage terms, 57 per cent of those delegates who were above the mean of 12.6 years' political experience classified themselves to the “right” of the spectrum, while only 46 per cent of those who were below the mean did so. Francophone delegates from Quebec exhibited slightly higher levels of political experience (mean = 14.6 years) than did anglophones (12.1 years), but the overall relationship of political experience to region is not significant.
47 Courtney, Selection, 253–59.
48 All variables in the regression are dummy variables, with the exception of political experience.
49 Smiley, “The National Party Leadership Convention,” 395. Courtney, Selection. 206–07.