Computed tomography perfusion (CTP) is increasingly being used in the setting of acute ischemic stroke (AIS). Several studies have demonstrated good inter-observer agreement for Alberta Stroke Program Early (computed tomography) CT score (ASPECTS) on a non-contrast CT (NCCT) headReference Coutts, Demchuk and Barber 1 and CTP parameters.Reference Hopyan, Ciarallo, Dowlatshahi and Howard 2 , Reference Kloska, Nabavi and Gaus 3 However, all of these studies focused on determining the inter-observer agreement for individual ASPECTS or individual CTP parametersReference Finlayson, John and Yeung 4 and none examined the inter-observer agreement in prediction of final infarct volume from the appearances on the first scan. The aim of the current study was to compare the prognostic utility of, and inter-observer variation between, baseline appearances on NCCT (using ASPECTS) and on CTP (time-to-peak [TTP], cerebral blood flow [CBF] and cerebral blood volume [CBV] parameters) for predicting final infarct volume. We also assessed the impact of training on the interpretation of these images.
MATERIALS AND METHODS
Patient selection
We retrospectively reviewed the images of consecutive patients presenting to the emergency department of a regional stroke center under code stroke designation within 4.5 hours of symptom onset between April 1st and August 31st, 2012. Exclusion criteria were intracranial hemorrhage or contraindications to contrast material. Patients were also excluded when there were no follow up studies. Patient demographics and clinical characteristics at the time of presentation were captured in a prospective registry.Reference Phillips, Eskes and Gubitz 5 This study is part of ongoing quality improvement work approved by the Capital Health Research Ethics Board.
Imaging parameters
The CT stroke protocol included NCCT and CTP imaging including CBF, CBV and TTP maps. The images acquisition was performed as described previously.Reference Langlands, Shankar, Simpkin, Christian and Phillips 6 , Reference Shankar and Vandorpe 7 All patients underwent a 9.6-cm-coverage brain CTP protocol (80 kV, 100 mAs, 128×0.6 mm collimation, 9.6-cm scan volume in the z-axis by using an adaptive spiral scanning technique [“shuttle mode”], CT dose index of 122.64 mGy), with 17 scans every 1.5 seconds followed by five scans every three seconds and another five scans every 15 seconds, resulting in a total scanning time of 115.50 seconds on the 128-section dual-energy CT scanner (Sensation Definition; Siemens Healthcare, Erlangen, Germany). A total of 40 mL of non-ionic iodinated contrast media (iopamidol, Isovue-370; Bracco Diagnostic, Vaughan, Ontario, Canada) was injected at a rate of five mL/s, followed by a saline flush of 40-mL sodium chloride at five mL/s and a start delay of four seconds. Two sets of axial images with a section thickness of 1.5 mm for the CTA analysis and five mm for the perfusion analysis were reconstructed without overlap and sent to the picture archiving and communication system (PACS). Sagittal and coronal multi-planar and maximum-intensity-projection images from the CTA data were reconstructed and sent to the PACS. Follow-up imaging used in this study was non-contrast CT images (5-mm-thick sections obtained on either a 128-section dual-energy or 64-section CT scanner; Siemens Health Care) or diffusion-weighted magnetic resonance (MR) sequence (five-mm-thick sections obtained by a General Electric 1.5T MR imaging system).
Perfusion analysis was performed with the delay-insensitive vendor-supplied Neuro-VPCT software (Siemens Health Care), by using the semiautomatic deconvolution algorithm Auto Stroke. Gray-scale and color-coded perfusion parameter maps for CBF, CBV, and TTP were stored in a DICOM format.
Image Analysis
A fellowship trained neuroradiologist, a stroke neurologist with more than 20 years experience and a medical student without previous training or experience in CT interpretation, aware of the side of symptoms (right, left or uncertain) but blinded to other clinical details reviewed the baseline NCCT scans and CTP maps of CBF, CBV and TTP and afterwards the follow-up CT or magnetic resonance imaging (MRI). The three CTP maps were examined at the same time with the knowledge that these maps were from the same patient. The baseline and follow-up scans were reviewed separately to prevent the first scan being interpreted in retrospect from the appearances on the second scan. Each reader outlined the ischemic lesion area on the available images using the freeform mark up tool available on the PACS work station. The lesion volumes measured on the CBF, CBV and TTP maps were then correlated with the final infarct volume measured on the follow-up NCCT or MRI.
Statistical Analysis
Demographic data were expressed as the mean ± standard deviation (SD) and as proportions for categorical variables. Cohen's Kappa statistic (Fleiss-Cuzick extension) was used for the agreement between readers on the presence of AIS. Sensitivity and specificity were used to describe how often the scans were considered to show evidence of AIS by individual readers. 95% confidence intervals are presented using the exact binomial distribution. All volumetric measurements were first transformed using a cube root transformation. Intra-class correlation coefficient (ICC) was used as a measure of agreement between readers of the baseline ASPECTS, CTP maps of CBF, CBV and TTP and final infarct volume. A two way model was used to measure absolute agreement in the three ratings.Reference Shrout and Fleiss 8 The association between the baseline CTP parameters and the final infarct volume was examined using the Pearson correlation coefficient (r-square). Analyses were conducted in SAS version 9.3 (Cary, NC). Intraclass correlation coefficients (ICC) were produced in MedCalc Statistical Software version 12.7.7 (MedCalc Software bvba, Ostend, Belgium; http://www.medcalc.org; 2013).
RESULTS
Eighty four patients had CTP studies for suspected AIS during the study period. Of these, four patients were excluded because the images were technically suboptimal and 42 patients were excluded because they did not have follow up imaging, which was needed to assess final infarct volume. These 42 CTP studies were used for the training of the medical student over a two-week period by the neuroradiologist. The neurologist received no formal training.
Of the 38 patients included in the final analyses, 47% had partial or total middle cerebral artery territory stroke syndromes, 13.2% had posterior circulation infarcts, 13.2% lacunar infarcts, 7.9% transient ischemic attack and rest 18.4% were considered normal. 9 Mean age was 69 yrs (SD±14) and 53% were men. Mean time to initial imaging from symptom onset was 1.51±0.4 hours and mean time between the initial and follow-up scans was 41.2±33.8 hours. Of the 38 patients, 19 (50%) received no treatment, 16 (42%) intravenous (IV) recombinant tissue plasminogen activator (rt-tpa), 2 (5%) IV plus intra arterial mechanical thrombectomy and 1(2.6%) intra arterial mechanical thrombectomy only. For follow up, CT head was performed in 16 patients and MR head was performed in 22 patients.
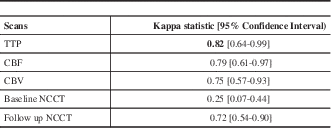
At the end of the study, 10 CTP and follow-up NCCT studies were considered normal by consensus among all the readers. All studies were then used to run the Kappa statistics to assess the agreement between readers on how often they found evidence of AIS on the NCCT and CTP studies (Table 1). Among all the CT parameters, TTP showed very good inter-observer agreement whereas CBF and CBV showed good inter-observer agreement.
Table 1 Inter-reader agreement for the presence of acute ischemic stroke on the CT perfusion scan and follow-up non-contrast CT.

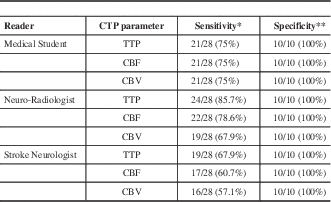
The sensitivity and specificity of CTP parameter for the detection of AIS by each reader are shown in Table 2. Specificity for absence of AIS was very high across all CTP parameters for all readers.
Table 2 Sensitivity and specificity of CTP parameters for detection of AIS by each reader.

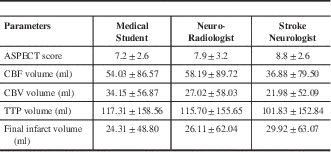
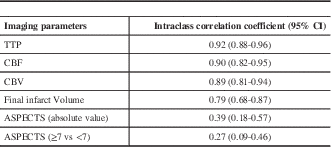
The mean and standard deviation of the ASPECT score; volume of ischemic tissue with CT perfusion parameters and final infarct volume are shown in Table 3. between the three readers for all the CT parameters are illustrated in Table 4. There was very good agreement among all readers for all the three perfusion parameters. There was good agreement for final infarct volume and only fair agreement for ASPECTS.
Table 3 The mean and standard deviation of the ASPECT (Alberta Stroke Program Early CT) score; volume of ischemic tissue with CT perfusion parameters and final infarct volume.

CBF- Cerebral Blood Flow; CBV- Cerebral Blood Volume; TTP- Time-To-Peak
Table 4 Intra-class correlation coefficient for all the imaging parameters between the three readers.

Cerebral blood volume was the best predictor of the final infarct volume followed by CBF and TTP (Table 5). The correlation coefficients indicate that the neuroradiologist was best at predicting final infarct volume from the initial CTP study followed by the medical student and stroke neurologist (Table 5). The correlation coefficient for CBV for the neuroradiologist was 0.95.
Table 5 Correlation (Spearman) between CTP parameters and final infarct volume.

Discussion
The present study demonstrated good to very good inter-observer agreement and very high specificity for all the CTP parameters (CBF, CBV and TTP) for detecting ischemia on the perfusion maps in patients presenting with AIS. There was very good inter-observer agreement between all readers for measurement of lesion volume on all the CTP parameters and only fair inter-observer agreement for ASPECTS. The maximum inter-observer agreement was seen for the TTP maps, possibly because TTP is the most sensitive parameter to detect ischemia. In ischemia, the prolonged TTP is significantly separate from normal TTP for both grey and white matter, whereas both CBF and CBV have a wide range of values that differ between grey and white matter. Similar results were obtained by Agrawal et alReference Agarwal, Jones and Alawneh 9 who found near perfect inter-observer agreement for interpretation of TTP. Computed tomography perfusion is a reliable, accessible and practical imaging modality that improves confidence in reaching the appropriate diagnosis. Agrawal et al also found that CTP strengthened the decisions regarding the administration of thrombolytic therapyReference Barber, Demchuk, Zhang and Buchan 10 but this was not examined in our study.
The ASPECTS derived from the initial NCCT has been shown to correlate inversely with the severity of stroke on the National Institutes of Health Stroke Scale and to predict functional outcome and symptomatic intracerebral haemorrhage.Reference Barber, Demchuk, Zhang and Buchan 10 We found that the inter-observer agreement for ASPECTS was only fair (ICC 0.39). The original ASPECTS article by Barber et alReference Barber, Demchuk, Zhang and Buchan 10 reported substantial to near-perfect agreement for ASPECTS dichotomized at 7, with kappa ranging from 0.71 to 0.89. However, another study by Mak et alReference Mak, Yau and Khong 11 demonstrated a kappa of 0.34 (fair), with a strikingly low 42% rate of observed agreement. Gupta et alReference Gupta, Schaefer and Chaudhry 12 reported only a moderate level of reliability (kappa 0.53) for dichotomized ASPECTS in the setting of proximal occlusions. We believe that the significant variability in the reported inter-reader reliability limits the utility of ASPECTS. Moreover ASPECTS is a weak predictor of final infarct volume.
We found CBV to be the best predictor of the final infarct volume. Similar findings were reported by Agarwal et al.Reference Barber, Demchuk, Zhang and Buchan 10 A CBV of below 2 mL/100 g has been described as an optimal threshold for defining the infarct core.Reference Wintermark, Flanders and Velthuis 13 However it is important to assess the appropriateness of the time density curve in CTP studies. Reversal of CTP-derived CBV lesion has been described in patients where there is truncation of TDC during the acute stroke phase.Reference d’Esterre, Aviv and Lee 14 Some authors have attempted to compare the diffusion weighted images (DWI) on MRI with CBV for prediction of final infarct volume or core of the infarct.Reference González 15
However it is important to recognize that these imaging modalities depict different pathophysiological processes.
The findings on DWI are obvious because of the high contrast to noise ratio.Reference González 15 The high noise level of CT perfusion and lower contrast to noise ratio demands some level of experience in reading these images. Our study showed that the neuro-radiologist's interpretation of the CTP images best predicted final infarct volume. The correlation coefficient of 0.94 for the neuroradiologist underlines the potential of the CTP parameters in experienced hands. The performance of the medical student demonstrates the value of focused training in the interpretation of CTP images. These findings may have implications for the wider dissemination of CTP techniques in routine clinical practice where the majority of scans are interpreted by physicians without special training in neuroradiology. Despite subtle differences between the readers, there was very good inter-observer reliability for all the CTP maps as opposed to that for the ASPECTS. So we agree with other authorsReference Lin, Do and Ong 16 that CTP significantly improves the diagnostic sensitivity and accuracy for AIS.
The main limitation of our study is the small sample size. We did not apply the ASPECTS to the CTP images as described by Finlayson et alReference Finlayson, John and Yeung 4 An important limitation of our study was lack of evidence of recanalization after thrombolytic therapy, since a vessel imaging after thrombolytic treatment is not part of our institutional imaging protocol. We analyzed the inter-observer agreement but we did not analyze the intra-observer agreement in our study. We did not have data available for National Institute of Health Stroke Scale. Simultaneous evaluation of perfusion parameters may have resulted in the higher sensitivity of perfusion parameters in the detection of ischemia. But this reflects that routine clinical scenario where all perfusion parameters are assessed simultaneously. We had a mixture of CT and MRI as follow up imaging which are different in sensitivity to pick up small ischemic area in the brain.
In conclusion, the CBV defect on the baseline CTP scan correlated best with the final infarct volume and there was a very good inter-observer agreement for all the CTP maps for the prediction of final infarct volume despite the wide variation in the experience of the readers.
Disclosures
Jai Jai Shiva Shankar, Steve Doucette, and Stephen Phillips do not have anything to disclose.
Gavin Langlands has the following disclosure: University of Aberdeen, Medical student, John Dobbie Memorial Prize.
Acknowledgements
Gavin Langlands was supported by the John Dobbie Memorial Prize from the University of Aberdeen, Scotland.
The paper was presented in ASNR 2013 meeting in SanDiego, USA.


