Introduction
In part due to the U.S. Supreme Court's decision in Citizens United v. FEC, some politicians, interest groups, academics, and activist investors are pressuring firms whose stock is publicly traded in the United States to disclose all of their political spending and receive permission from shareholders before making such expenditures. The pressure for greater transparency and shareholder oversight has taken many forms, including legislation,Footnote 1 disclosure ratings,Footnote 2 shareholder resolutions,Footnote 3 lawsuits,Footnote 4 and a petition for SEC regulation.Footnote 5 Some proponents of a stricter regulatory regime view corporate political spending as risky, opaque, and harmful to shareholder value. According to this view, mandatory disclosure and shareholder approval of political spending will reduce risk and increase firm value. In this study, we provide evidence to the contrary and show that mandatory disclosure and shareholder approval policies could, in fact, increase return volatility and reduce firm value.
There are three interrelated arguments for why corporate political spending harms firm value and increases volatility: activism, agency concerns, and moral hazard. Specifically, some proponents of a stricter regulatory regime view corporate political spending as risky because (a) it draws unwanted attention from activists, creating reputational, legal liability, and business strategy misalignment risksFootnote 6 and a potential loss in value for the politically active firm, (b) managers may use the firm's political spending to pursue a political agenda at odds with the interests of the firm, reducing firm value and potentially exposing the firm to activist criticism,Footnote 7 and (c) it may lead to moral hazard, encouraging managers to take excessive risks in the belief that they will be protected by the government in the event that the bet goes bad.Footnote 8
By constraining managers’ ability to use corporate funds for political purposes, disclosure and shareholder approval would seem to be policies that offer many benefits with few costs. Yet, there are several reasons to think that these policies will not be beneficial to shareholders. One, the release of proprietary information about a firm's political strategy creates a roadmap for its competitors and hostile interest groups to attack the firm, creating the potential for negative media coverage, reputational risks, and business disruption for the politically active firms.
Second, managers fearful of reputational harms arising from such disclosures may spend less money on political activities due to concerns about the appearance of seeking “favors” from government and to prevent an attack by hostile interest groups, leading to an increased risk of unfavorable regulatory or legislative changes. Such disclosures may also reduce the marginal benefits of rent seeking if politicians become wary of appearing to grant favors to politically connected firms. This may benefit society as a whole, but it nonetheless may hurt shareholders (the focus of our paper), especially if not all firms cease rent seeking as a result of disclosure or shareholder approval.
Third, shareholder approval could expose a publicly traded firm to greater regulatory risk if it reduces the firm's flexibility and agility in responding to a proposed regulatory change vis-à-vis privately held firms and other interest groups, or if the fear of losing a shareholder vote dissuades managers from spending money on political activities. More generally, firms use political spending to manage political risk and reduce their sensitivity to political uncertainty.
To be sure, these dangers will be mitigated to the extent that firms can substitute other forms of political activity, such as increased lobbying, for campaign spending. But, as Albuquerque et al. (Reference Albuquerque, Lei, Rocholl and Zhang2017) show in the context of the U.S. case, campaign finance rules affect the strategic environment for corporations, and different sorts of political activity are rarely perfect substitutes. Ultimately, the net effect of disclosure and approval of political spending on shareholder value and risk is an empirical question.
In this paper, we utilize a quasi-natural experiment to examine whether greater shareholder oversight of political spending does, in fact, increase value, as proxied by Tobin's Q and by abnormal returns, and reduce risk, as proxied by return volatility. Using the surprising Neill Committee Report (NCR) that led ultimately to the passage of the United Kingdom's Political Parties, Elections and Referendums Act 2000 (PPERA), which mandated shareholder approval as well as greater and more centralized disclosure of political contributions, we implement a differences-in-differences methodology and find little evidence that the report reduced volatility or increased value for politically active firms.
In fact, our results point in the opposite direction. Using a differences-in-differences methodology combined with propensity score matching and quantile regressions, as well as an abnormal returns analysis around the date of the NCR's release, we find no consistent evidence that shareholders benefitted from these mandates. Instead, we find that in the months after the NCR's release, higher-risk politically active firms suffered an increase in risk, as proxied by stock price volatility, hurting precisely the firms that such rules are thought to help. Moreover, this effect eventually filtered down to the entire distribution of politically active firms. Further, while there was no immediate effect of the NCR on returns, the longer-run effect was a decrease in firm value of 3–5 percent for firms that were contributing to UK political parties prior to its release.
This paper contributes to the literature on political connections, contributions, and lobbyingFootnote 9 by providing evidence that calls into question the claim that mandatory disclosure and shareholder approval of corporate political spending reduce risk and increase firm value. Our results suggest that disclosure and shareholder approval may do more harm to firms than good, and we theorize that this is because these policies have the potential to short-circuit both offensive and defensive political strategies.
Our paper also contributes to the literature on shareholder rights and corporate governance. The existing literature has typically focused on shareholder activism related to executive compensation;Footnote 10 approval of board members and mergers;Footnote 11 and the role of shareholder voting, proxy contests, institutional investors, and proxy advisors.Footnote 12 Our paper highlights the potential costs of mandated shareholder approval of political activity. Our evidence is consistent with Karpoff and Rice (Reference Karpoff and Rice1989), who suggest that managers facing frequent shareholder votes might spend a lot of time campaigning and end up compromising the firm's long-term interests. Similarly, Yermack (Reference Yermack2010) argues that voting on social issues can create negative publicity for a firm's business practices, resulting in greater scrutiny by regulators and lawyers. Matsusaka and Ozbas (Reference Matsusaka and Ozbas2017) show how shareholder approval rights have limited benefit (if any) for shareholder value, and how managers might react to shareholder proposal rights by moving firm policies away from those that pursue profit maximization.
Our paper also relates to work by Baloria et al. (Reference Baloria, Klassen and Wiedmann.d.) and Werner (Reference Werner2017), who study shareholder activism on corporate political spending in the United States. Baloria et al. (Reference Baloria, Klassen and Wiedmann.d.) show that even if a shareholder proposal for political spending disclosure fails or is withdrawn, firms often shift their disclosure policies because of the activist activity, and investors react negatively to these changes. Werner (Reference Werner2017) uses a natural experiment—the inadvertent disclosure of corporate political spending—and finds that these disclosures negatively affected the returns of those firms that were already the target of shareholder resolutions regarding political spending disclosure, but increased the returns of other politically active firms (which presumably were not as vulnerable to activists).
Finally, we contribute to the literature on corporate disclosure. The case for disclosure typically centers on information asymmetries and conflicts of interest between managers and investors.Footnote 13 Our findings are in line with empirical papers that find negative effects of disclosure due to the transmission of proprietary information to competitors;Footnote 14 increased litigation risk;Footnote 15 and reputational and political costs arising from non-shareholders taking actions that adversely affect the firms.Footnote 16
There are, as with any study, limits to the scope of our findings. First, the NCR and PPERA included other provisions, such as the establishment of an election commission and a cap on the amount a political party can spend in an election cycle. It is possible that these restrictions may have influenced the stock market or influenced contribution behavior, but these are less directly relevant to the corporation than disclosure and shareholder approval. In addition, the UK's Committee on Standards in Public Life singled out disclosure and shareholder approval in characterizing the PPERA as “the most fundamental overhaul of election rules funding since 1883” and argued that these two provisions were responsible for the decline in corporate giving in the 2000s.Footnote 17 This gives us confidence that shareholder approval and disclosure are the most important aspects of the NCR and PPERA for corporations. However, our study's design does not enable us to disentangle whether disclosure or shareholder approval is driving our findings, nor does it enable us to determine which of the mechanisms described earlier (e.g., reputational fears, activist threats) are driving the results. For instance, because we do not have access to data on lobbying by UK firms, we cannot assess which politically active firms were best positioned to deal with the changes wrought by the NCR and PPERA.
Second, our results do not speak to other possible benefits and costs associated with these policies that may influence their overall desirability for society. For instance, investors taken together may be better off with mandated disclosure if the policy prevents firms from seeking advantages in the political sector through rent seeking. A social welfare analysis in this paper would be complicated, however, as one would have to account for many other aspects of the law, including that it affected public but not private firms. Moreover, one would have to consider the effects on the electoral process and speech rights. Our focus is in this paper is squarely on the claims by corporate governance scholars and others that these policies benefit firms and shareholders.
The paper proceeds as follows. First, we provide background information on the 1998 release of the NCR, which led to the passage of the PPERA in 2000. Then, we describe the construction of our dataset and our methodology, including how we handle the methodological challenges of checking for parallel trends, addressing potential selection bias, and accounting for potential confounding events. Next, we present our findings, including several robustness checks, and conclude by discussing the implications of our findings for corporate governance.
The Neill Committee Report and the Political Parties, Elections, and Referendums Act 2000
Before 2000, the campaign finance activities of political parties in the United Kingdom were lightly regulated, and parties were not required to report the sources of their funds. Even though political parties were not required to make their donor lists public, the UK's Companies Act 1985 required covered companies to disclose political contributions over £200 in their annual Directors’ Report. The Companies Act also required corporations to disclose contribution amounts and recipient names.Footnote 18 Fisher (Reference Fisher1994) examined contributions to the Conservative Party in the year 1991–92 and found that of the top four thousand companies ranked by revenue, 242 made political contributions. The mean of those contributions was £16,085, and the median was £5,000.
In late 1997, Bernie Ecclestone donated £1 million to the Labour Party, allegedly to influence the proposed ban on tobacco advertising in Formula 1 racing. In response, the Labour-controlled government returned the money to Ecclestone and asked the Committee on Standards in Public Life (the Neill Committee) to study party financing activities.Footnote 19 The committee proposed a set of strong reforms in British party financing activities in October 1998 in the Neill Committee Report. According to journalistic and scholarly accounts, some aspects of the report were leaked, but when the report was released, observers expressed surprise regarding how far it went.Footnote 20 Fisher (Reference Fisher2002, 392) wrote, “Given the abject failure of previous attempts to reform party finance during the last twenty-five years, the radicalism and comprehensiveness of the report caused genuine surprise.” Despite fears that Labour would be hurt by the new rules, leaders relented and the proposals eventually became part of the Political Parties, Elections and Referendums Act 2000.
Fisher (Reference Fisher2001) places the reforms of the PPERA into six categories: Electoral Commission, Donations, Campaign Spending, Third Parties, State Funding, and Referendums. The reforms include a cap on party spending and the creation of an electoral commission. Of the many provisions, the strengthening of disclosure requirements, as well as the requirement that publicly listed companies in the United Kingdom seek shareholder approval before making political contributions, stand out as the two most directly relevant to corporations. Indeed, at least two government reports issued after the PPERA's enactment singled out one or both of these provisions as constraining corporations.Footnote 21
On disclosure, the act expanded the definition of political contributions and provided a single source for the public to obtain contribution-related information for UK-incorporated firms in a standardized format—information that was already available, but scattered in the annual reports of the companies. In addition, a publicly listed firm now had to seek shareholder consent before exceeding £5,000 in political contributions in a given year.
The PPERA's effect on contribution behavior: Suggestive evidence
Confounding events (news related to the 2001 national election and the UK fuel protests of 2000) near the enactment of the PPERA, and the fact that its passage was expected, make identification challenging. However, because the NCR was exogenous to corporate risk taking and the stringency of its recommendations were surprising, we can treat the NCR as a quasi-natural experiment and analyze its effects on the riskiness and value of UK-listed firms. First, however, we provide some suggestive evidence regarding the PPERA's impact on firm behavior.
Table 1 reports that of the ninety-five firms that contributed between 1992 and 1998 (the NCR was released in October 1998) and which are present in our data for at least part of the period 2001–6, only two continued to contribute after the PPERA, while ninety-three stopped contributing.Footnote 22 These findings are consistent with those in Torres-Spelliscy (Reference Torres-Spelliscy, Jalilvand and Malliaris2012, 415–16), who finds that spending by twenty-eight UK firms that had previously given at least £50,000 to the parties dropped precipitously in the wake of PPERA. In another study, Torres-Spelliscy and Fogel (Reference Torres-Spelliscy and Fogel2011, 558–59) find that forty-nine companies that made political expenditures in the 1990s stopped giving entirely after 2000, and they suggest that the new rules “exerted pressure on listed [publicly traded] companies to refrain from funding political parties.” These authors also theorize that publicly traded firms may be disadvantaged by this law relative to privately held firms; they find that contributions by privately held companies “rose dramatically” in the wake of PPERA relative to contributions by publicly traded firms (2011, 558–59).
Table 1: Contributions to political parties by publicly traded firms before the NCR and after the PPERA

Note: The sample consists of firms that are present in 1997 and for at least part of the period from 2001 to 2006. Because some firms are no longer in existence and/or in the Datastream database in the post-PPERA time period, the number of firms is smaller than in subsequent tables. The pre-NCR period is defined as 1992–98 and the post-PPERA period is defined as 2001–6.
The Committee on Standards in Public Life in 2010 and 2011 also noted the impact of the PPERA on corporate behavior. In 2010, the committee wrote, “[d]onations from public companies have also apparently declined since the introduction in 2000 of the requirement for transparency and prior shareholder approval.”Footnote 23 In 2011, it wrote, “Donations from public companies have been small since prior shareholder approval became a requirement in 2001.”Footnote 24
This period also coincided with a transfer in control of government from the Conservatives to Labour. While the ratio of Labour to Conservative contributions of at least £5,000 by publicly traded firms increased after the shift, this is secondary to the reduction in the number of total donations overall by publicly traded companies.Footnote 25 We leave for future research the question of how the PPERA changed the contribution behavior of specific firms and altered party finance. For our purposes, it is sufficient to establish the plausibility that the law did have such an effect. We turn now to the main analysis.
Data and methodology
The initial sample of publicly listed firms in the United Kingdom is drawn from Datastream for the period October 1996 to December 2002. Financial data and stock prices are also from Datastream. The Labour Research Department (LRD) generously provided us with data on contributions to UK political parties. We supplemented the LRD data by checking the annual reports of publicly listed firms in the United Kingdom.
We use three measures of risk. The first is total risk, defined as the annualized volatility of daily stock returns. The second is systematic risk, defined as the annualized volatility of daily expected returns, estimated from the Fama-French three-factor model, which builds on the traditional capital asset pricing model (CAPM).Footnote 26 Following Gregory et al. (Reference Gregory, Tharyan and Christidis2013), the factors used in this study are constructed using UK data. The third is idiosyncratic or firm-specific risk, defined as the annualized volatility of the residuals from the Fama-French three-factor model.
Measuring risk
Total risk (the variance of daily stock returns) for the stock of firm i in month T is computed using the following equation:
R iTt is the daily return of the stock on day t in month T, n is the number of return observations for the stock in month T, and R iTavg is the average of daily returns of the stock in month T.
To compute systematic and idiosyncratic risk, first we estimate the Fama-French three-factor model to predict expected returns:
where T represents month, t represents day, and i represents the stock of firm i. R iTt is the daily return of the stock, RM Tt − rf Tt is the return of the market portfolio minus the risk-free rate, SMB is the difference between the return of a portfolio of small stocks and that of a portfolio of large stocks, and HML is the difference between the return of a portfolio of high book-to-market stocks and that of a portfolio of small book-to-market stocks. Following Fu (Reference Fu2009), the idiosyncratic risk of a stock is computed as the variance of the regression residuals from equation (2). The systematic risk of a stock is computed as the variance of the predicted return, where the predicted return is computed from equation (2) as α iT + β iT(RM Tt − rf Tt) + γ iTSMB Tt + δ iTHML Tt. Estimates of these one-day variances are obtained for each month using daily trading data for that month. We annualize the daily variance estimate calculated for each month by multiplying it by 252 (the number of trading days in a year).
Under the traditional CAPM model, all investors diversify idiosyncratic risk by holding the market portfolio. Consequently, only systematic risk is priced in equilibrium and any change in idiosyncratic risk should not affect shareholder value. However, in reality, managers are not diversified because their human capital is tied to the firm, so idiosyncratic risk affects their decisions, which, in turn, could affect firm value. Moreover, Heaton and Lucas (Reference Heaton and Lucas2000) and Moskowitz and Vissing-Jørgensen (Reference Moskowitz and Vissing-Jørgensen2002) find that investors hold large amounts of idiosyncratic risk in the form of human capital and private equity. Goyal and Santa-Clara (Reference Goyal and Santa-Clara2003) argue that because of this, the relevant measure of risk for many investors is total risk and not systematic risk. Since systematic, idiosyncratic, and total risk may all be relevant for investors, we estimate the effects of the NCR's release on all three measures.
Statistical model for examining the effects of the NCR on risk
To test for the effects of the NCR's release on risk, we use differences-in-differences regressionsFootnote 27 and exploit the fact that a proposed or actual change in campaign finance law primarily affects politically active firms. The differences-in-differences approach allows us to isolate the effect of these events (assuming that there were no confounding events around the same date, an issue we return to later). Our regression specification is
where Log(Riskit) is the natural logarithm of firm risk for firm i in year-month t. The methodology is similar to the one used by Low (Reference Low2009) to examine whether managers’ risk-taking behavior increases after an exogenous change in takeover protection case law in Delaware.
In the model, Politically Active it is equal to 1 if the firm contributed to a UK political party prior to the NCR's release (defined as calendar years 1992–98), and 0 otherwise. Post it is equal to 1 if the year-month is after the event, and 0 otherwise. Results for the risk and value analyses are substantively similar if we measure political activity using contribution amounts rather than indicator variables.
X it represents the control variables. Since managers have the ability to affect risk through leverage, capital expenditures, and research and development expenditures,Footnote 28 we control for the contemporaneous values of these firm policy variables. Leverage is defined as the book value of debt over the book value of assets. Capital Expenditures is defined as capital expenditures scaled by the book value of assets. R&D Expenditures is defined as expenditures on research and development scaled by the book value of assets. We also control for Log(Size), defined as the log of the book value of assets; ROA (profitability), defined as earnings before interest, taxes, depreciation, and amortization (EBITDA) divided by the book value of assets; and Market-to-book, which measures growth opportunities and is defined as the market value of equity over the book value of equity. All financial data is winsorized at the 1st and 99th percentiles.
We also account for firm fixed effects, which control for unobserved cross-sectional heterogeneity across firms, and year-month fixed effects, which control for market-wide fluctuations in volatility. Since the specifications include time and firm fixed effects, the non-interacted Post it and Politically Active it dummy variables drop out of the model. The coefficient of interest in the model is β, which approximates the percentage change in risk for politically active firms caused by proposed disclosure and shareholder approval regulations. We cluster standard errors by firm wherever possible in this model and in the models that follow.
In an alternative specification, we estimate industry rather than firm fixed effects:
By using industry fixed effects, we are able to include the non-interacted Politically Active variable in the analysis and estimate the average difference in risk between politically active and inactive firms prior to the NCR's release (captured by γ).Footnote 29
We also estimate model (4) using quantile regressions to assess whether the risk for politically active firms increased differentially across the quantiles (10%, 20%, 30%, 40%, 50%, 60%, 70%, 80%, 90%) after the NCR's release. Quantile regressions estimate quantiles of the conditional distribution of the dependent variable as a fction of observed covariates, while ordinary least squares (OLS) estimates the conditional mean of the dependent variable as a function of observed covariates. The quantile regression results help us assess whether changes in risk due to changes in the independent variables vary across the quantiles.
Statistical models for examining the effects of the NCR on value
To test for the effects of the NCR on value, we undertake two types of analyses. First, we estimate one-day abnormal returns (AR[0]) and three-day cumulative abnormal returns (CAR[−1,+1]) for each firm on the NCR release date and other relevant dates and, for each date, regress abnormal returns on the Politically Active dummy to infer the effect of the NCR on equity value. Our regression specification is
To compute abnormal returns, we use daily stock returns data to estimate the Fama-French three-factor model (equation 2). The one-year estimation period ends sixty days prior to the event date. The abnormal return for each firm is computed as the difference between the actual return on the event date minus the predicted return for that date from the Fama-French three-factor model. One-day CAR is the abnormal return on the event date. Three-day CAR is the abnormal return cumulated over three days, starting one day prior to the event date and ending one day after the event date. We also aggregate abnormal returns across all NCR-release-related events to assess the net short-term impact of the report on stock prices.
Second, to allow for learning about the consequences of the NCR to occur, we consider a longer event window and use differences-in-differences regressions to analyze the effects on value.
and
We follow Morck et al. (Reference Morck, Shleifer and Vishny1988) and use the log of Tobin's Q to proxy for firm value. We define Tobin's Q as the market value of equity plus the book value of liabilities, scaled by the book value of assets. The calculation of Tobin's Q requires accounting data that is available on a yearly basis, so the analyses utilizing this variable look at changes in Tobin's Q on a year-over-year basis. We use all of the same controls X it as in the risk regressions, except we omit Market-to-Book due to its similarity to the dependent variable.
Special methodological considerations
Inherent in all regression analyses is the risk of spurious findings. Three methodological considerations are especially relevant for this project: the parallel trends assumption inherent in differences-in-differences regressions; the potential for confounding events as the event window increases in length; and the possibility of bias due to inherent differences between politically active and inactive firms. We address each of these in turn and discuss how we handle them in the paper.
The parallel trends assumption
An important assumption underlying the differences-in-differences analyses of risk and value is that prior to the event, any differences between politically active and inactive firms are constant over time on the dependent variables of interest, meaning that in the absence of the event, the differences between treated and untreated firms would remain constant. While the parallel trends assumption is not testable because the counterfactual outcome in the absence of the event is unobservable, we can perform a diagnostic test to give us more confidence in the assumption.
Earlier we noted that in the months leading up to the passage of the PPERA, the 2001 national election and oil protests were in the news. Not surprisingly, this had differential effects on firm risk and value for politically active and inactive firms, raising concerns about assuming parallel trends prior to the PPERA.
For the NCR, we analyze whether there is a pre-treatment trend in the data by conducting a test in the “spirit of Granger.”Footnote 30 Specifically, we run the relevant firm-fixed effects regression for risk or value, but with time dummies interacted with Politically Active for several lags and leads of the dependent variable. For instance, in an analysis of monthly risk, a point estimate of 0.1 for a given year-month implies that the difference between logged values of monthly volatility for treated firms and those for control firms increased by 0.1 in that year-month relative to the difference in the base year-month (in our case, the earliest lagged time period in the data). If there is a pre-trend in the data, then the coefficients on the lags should be statistically significant and increasing or decreasing monotonically over time.
Based on this analysis, we are confident that there is no pre-trend for the NCR. We provide representative figures focused on idiosyncratic risk in figures 1 (full sample) and 2 (propensity-matched sample; see discussion below) for October 1997 through October 1999. The base month-year is the set of months from October 1997 through June 1998 (captured by a single time dummy). Coefficients for the interacted pre-NCR time dummies are not statistically significant (dotted lines represent 90 percent confidence intervals), except in figure 2 for a spike in September 1998 that dissipates by October 1998, the month the report is released. This could be due to the increased news regarding the NCR during September, which would likely bias our results against finding an increase in risk. The figures look very similar for total risk and systematic risk. We are only able to examine Tobin's Q data for two time periods prior to the NCR, as it is measured yearly, and we do not find statistically significant evidence for a pre-treatment trend.
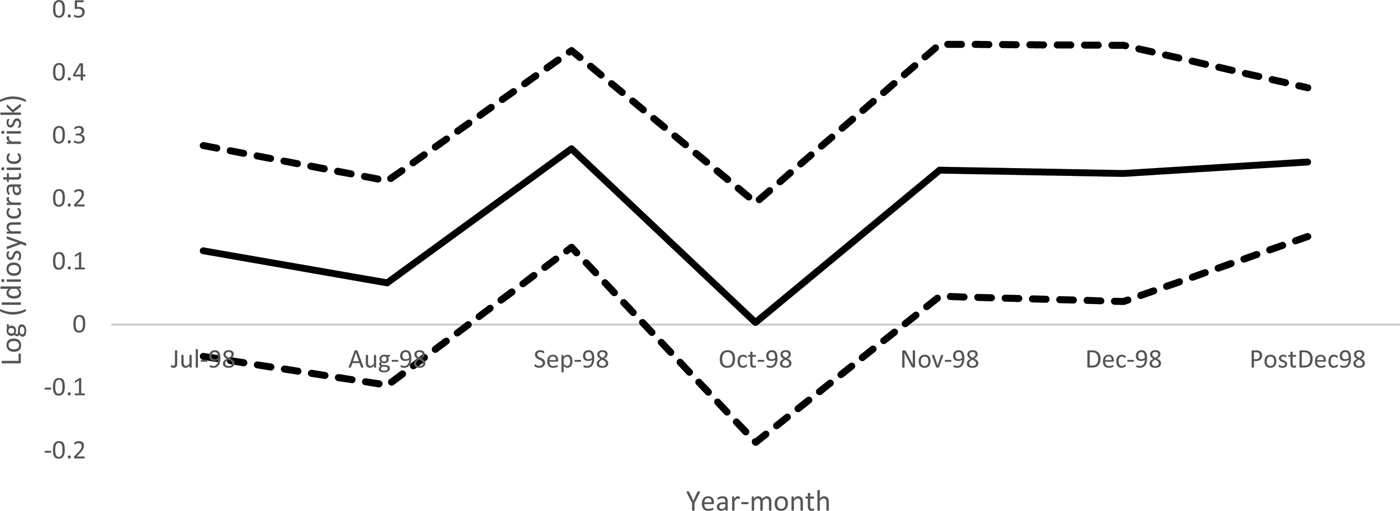
Figure 1. Coefficient dynamics for the full sample: Monthly idiosyncratic volatility around the Neill Committee Report, October 1997 to October 1999
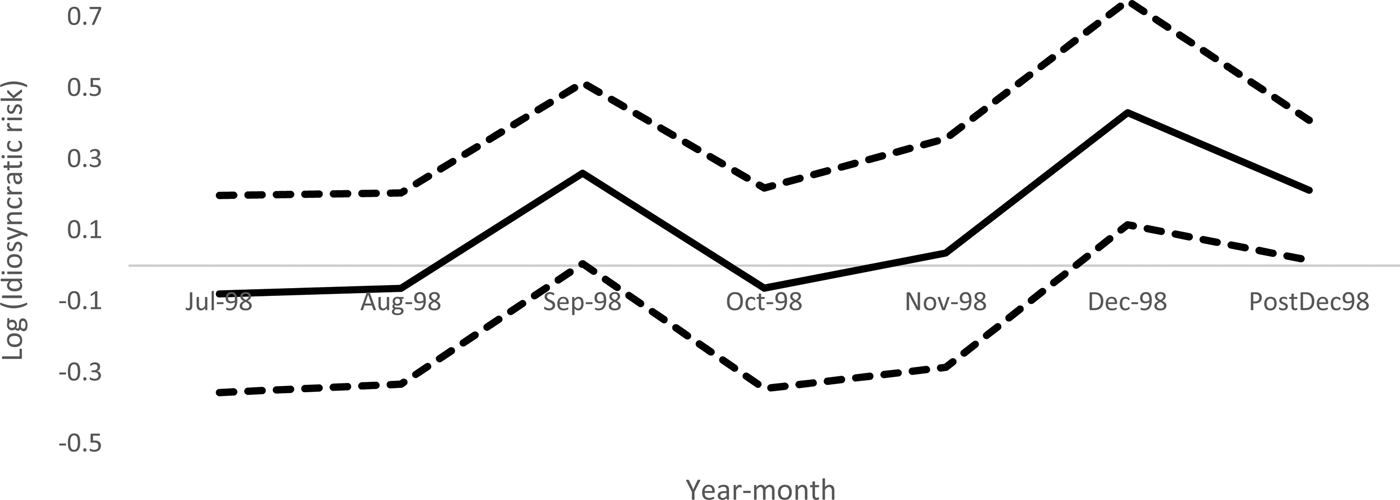
Figure 2. Coefficient dynamics for the propensity-matched sample: Monthly idiosyncratic volatility around the Neill Committee Report, October 1997 to October 1999
The length of the event window
When conducting a differences-in-differences analysis, the analyst must choose how long a time period to study on either side of the event (the “event window”). The benefit of a relatively short event window is that, all else equal, the likelihood that another event will have a differential effect on treated and untreated firms is smaller than for a longer window. Put another way, if the change in risk is concentrated around the event, then it is more likely that identification is coming from the report and not from some other event. The downside of a short event window is that one cannot account for the long-run effects of an intervention. In our study, this is especially relevant, as the full consequences of the NCR may not be present immediately. A longer event window allows for learning and adaption to occur, but also increases the possibility of confounding events.
For our study, one possible confounding event is that Labour returns to power in May 1997. The parallel trends analysis we conducted above reassures us that any effects of the election had already been factored into risk and value as of October 1997.
In addition, corporate governance was the subject of at least three major reports or guidelines issued in 1998 and 1999: the Hampel Report in January 1998; the Combined Code on Corporate Governance in June 1998; and the Turnbull Report in September 1999. While we do not have any reason to believe that the risk and value of politically active and inactive firms would be affected differentially by these corporate governance events (nor does our parallel trends analysis raise cause for concern this regard), it is nonetheless advisable to vary the event window to assess the robustness of our findings. We use a shorter event window—+/− 3 months around the NCR (July 1998 to January 1999)—as well as a longer event window—+/− twelve months around the NCR (October 1997 to October 1999)—and interpret our results in light of these trade-offs.
Propensity score matching
Another potential methodological concern is that being politically active is not a random assignment but a choice a firm makes based on its characteristics, meaning that these characteristics could be driving the results. The regression methodology controls for observable firm characteristics. However, to the extent there is a significant difference between the politically active and inactive firms in terms of financial characteristics, and most of the variation in the data comes from the inactive firms, the results may be biased. To address this concern, we implement Rosenbaum and Rubin's (Reference Rosenbaum and Rubin1983) propensity score matching (PSM) method to match politically active firms and inactive firms based on their propensity to be politically active.
We estimate a firm's propensity to be politically active as a function of several firm-level characteristics (measured in 1997) using a probit model regressing Politically Active on the firm-level controls that we use in our main analysis (Leverage, Capital Expenditures, R&D Expenditures, Log(Size), ROA, and Market-to-book). For every politically active firm, we use this model to select a politically inactive firm from the same industry that is closest to the politically active firm in terms of its propensity to be politically active. To ensure good matches, the maximum allowed distance (caliper) between the propensity scores of the treatment group (politically active firms) and the control group (politically inactive firms) is .05. After matching, the mean and the median differences between the propensity scores of the treatment and the control group are .009 and .003, respectively.
Results
Descriptive statistics
Panel A of table 2 reports descriptive statistics for all publicly traded firms in the United Kingdom with readily available financial data for the year 1997, a year prior to the NCR's release year. We separate the firms into politically active and inactive firms, where politically active firms are defined as those that contributed to UK political parties between 1992 and 1998, a time period which spans two UK general elections; the remaining firms are defined as inactive. 149 firms in our sample are politically active while 1,505 are inactive. On average, politically active firms gave £46,174 in total contributions from 1992 through 1998. The top three contributing industries in our sample are construction, financial services, and transportation. The small proportion of politically active firms in the UK is not an aberration. In the United States, corporations also are not particularly active contributors, contrary to the conventional wisdom.Footnote 31
Table 2: Descriptive statistics: Means (1997)
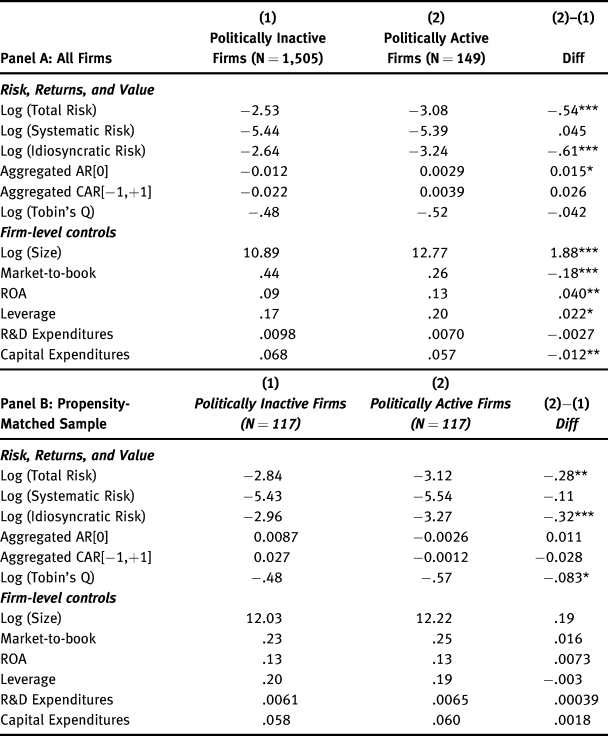
Note: The number of firms for which we have announcement return information is less than the number of firms for which we have accounting, risk, and value data due to unavailable pricing data around the announcement day, which in part is due to illiquidity of some stocks. N for the AR[0] and CAR[−1,+1] variables are as follows: Panel A, Col (1): 1,266; Panel A, Col. (2): 140; Panel B, Cols. (1) and (2): 108 for each column. All financial data is for 1997. ***, **, and * denote statistical significance levels at 1%, 5%, and 10%, respectively.
For the entire sample, active firms tend to be larger, more profitable, and more leveraged, but have lower market-to-book ratios and capital expenditures, than their inactive counterparts; stocks of politically active firms, on average, also have lower firm-specific risk and total risk. There is no meaningful difference in our measure of value (Tobin's Q).
Panel B of table 2 presents descriptive statistics for the matched sample of 117 politically active firms and 117 politically inactive firms (not all politically active firms could be matched). The table shows that after matching, there is no statistically significant difference between politically active and inactive firms in terms of observable firm characteristics (firm-level controls). As in the entire sample, the table also shows that prior to the NCR's release, politically active firms, on average, are less risky than the inactive firms. While there is a statistically significant difference between politically active and inactive firms on AR[0] abnormal returns but no difference in Tobin's Q, the opposite is true for the propensity-matched sample.
What is the effect of the NCR on risk?
We begin by conducting multivariate tests to examine the impact of the NCR on stock volatility, focusing on our sample of all publicly traded firms. We first use three months of data around the NCR (July 1998 through January 1999) for the differences-in-differences analysis in order to minimize the likelihood of other events affecting our analysis. Panel A of table 3 reports the results for all publicly traded firms in our sample. Panel B reports the findings for the propensity-matched sample.
Table 3: Differences-in-differences regressions estimating the effect of the Neill Committee Report on monthly return volatility for UK firms, July 1998 to January 1999
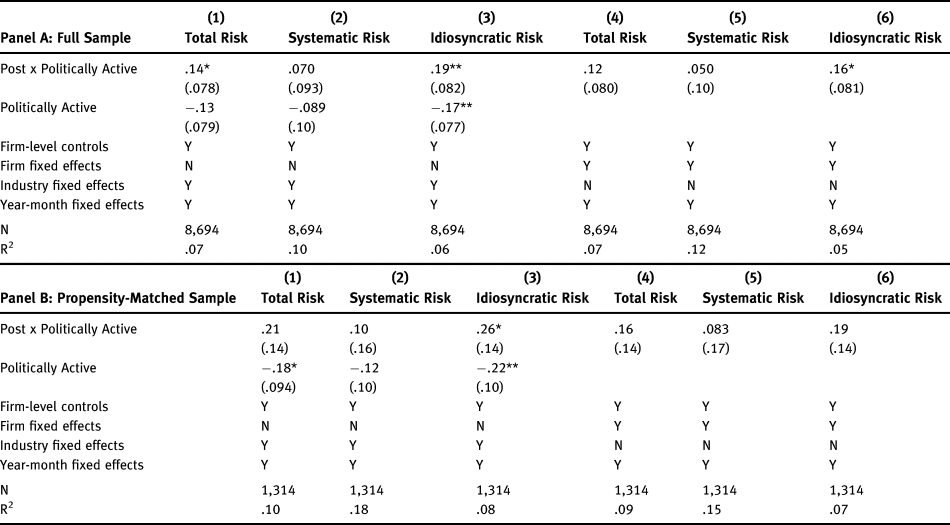
Note: The sample starts 3 months before the NCR's release and ends 3 months after the NCR's release. Post is equal to 1 if the year-month is November 1998 to January 1999, and 0 otherwise. Standard errors clustered by firm are in parentheses. ***, **, and * denote statistical significance levels at 1%, 5%, and 10%, respectively.
The variable of primary interest is Post x Politically Active variable, which is equal to 1 if the firm is politically active prior to the NCR and the year-month is after the NCR's release, and 0 otherwise. Columns (1) to (3) present the results for regressions with industry fixed effects, and columns (4) to (6) present the results with firm fixed effects. The most robust of the findings in Panel A is that idiosyncratic risk spikes in the wake of the NCR. Importantly, we find no evidence that risk levels declined due to the NCR.
When we perform the same analysis on the propensity-matched sample (Panel B), the magnitude of the coefficients is comparable, but the statistical significance of our findings is weakened. We still find evidence for an increase in idiosyncratic risk, but only with industry fixed effects and not when we implement firm fixed effects. We still find no evidence that risk levels dropped due to the NCR.
It is possible, however, that the average effects estimated by the regressions mask important differences across the risk distribution. To examine which portion of the volatility distribution was affected by the NCR release, we perform quantile regressions on both the full sample and the propensity-matched sample. The results from quantile regressions are presented in Panels A, B, and C of table 4 (full sample) and table 5 (propensity-matched sample), where each column presents the result from estimating equation (4) for a particular quantile of the dependent variable.Footnote 32 It is clear from these results that the initial effects of the NCR were concentrated on higher-risk firms. In none of the six analyses do we find evidence that firms through the 40th percentile saw an increase in risk, but we do find that at least some firms toward the top end of the risk distribution were affected across all measures of risk. This suggests that in the short run, the NCR hurt the firms that are thought to benefit from stricter oversight of political spending—higher-risk politically active firms.
Table 4: Quantile regressions estimating the effect of the Neill Committee Report on monthly return volatility for UK firms, July 1998 to January 1999 (full sample)
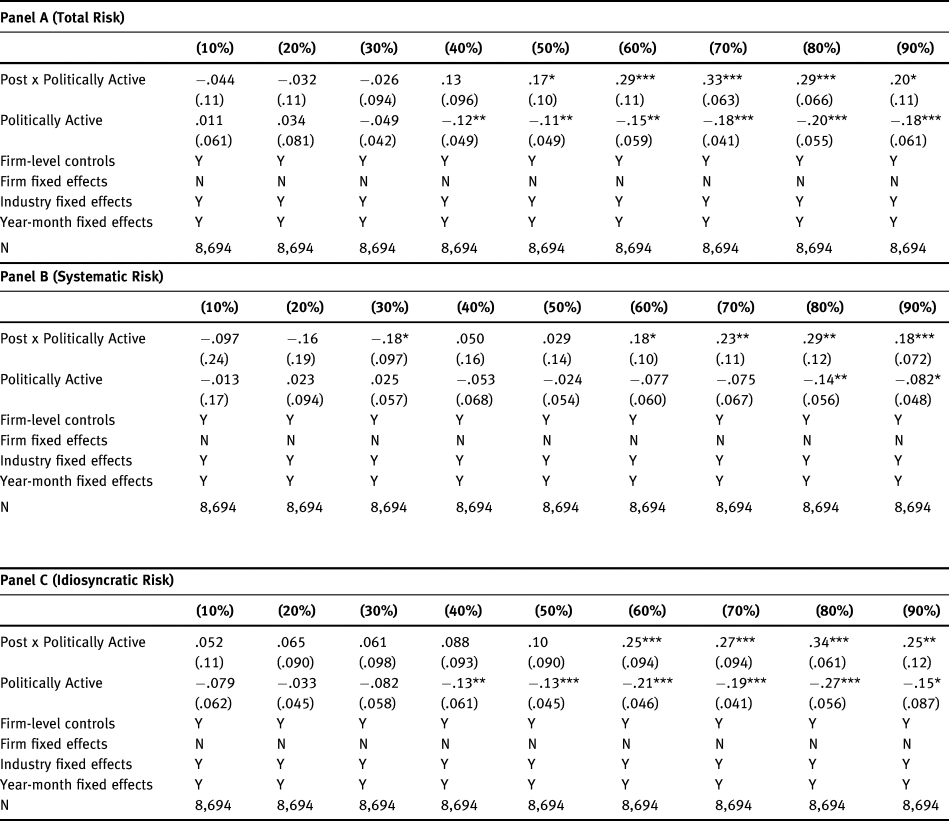
Note: The sample starts 3 months before the NCR's release and ends 3 months after the NCR's release. Post is equal to 1 if the year-month is November 1998 to January 1999, and 0 otherwise. Percentages in parentheses for each column denote the percentile on which the quantile regression was performed. Standard errors clustered by firm are in parentheses. ***, **, and * denote statistical significance levels at 1%, 5%, and 10%, respectively.
Table 5: Quantile regressions estimating the effect of the Neill Committee Report on monthly return volatility for UK firms, July 1998 to January 1999 (propensity-matched sample)
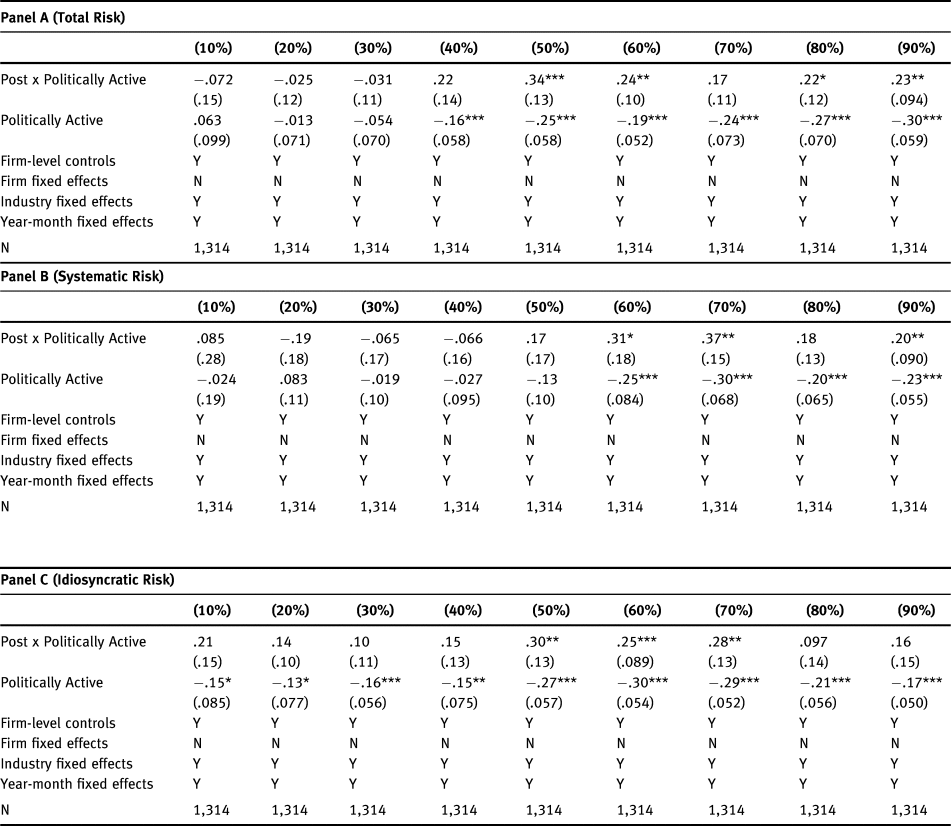
Note: The sample starts 3 months before the NCR's release and ends 3 months after the NCR's release. Post is equal to 1 if the year-month is November 1998 to January 1999, and 0 otherwise. Percentages in parentheses for each column denote the percentile on which the quantile regression was performed. Standard errors clustered by firm are in parentheses. ***, **, and * denote statistical significance levels at 1%, 5%, and 10%, respectively.
While a tight time window around the NCR's release gives us high confidence that identification is coming from the event, the negative is that it does not allow time for investors to learn about the likely consequences of the NCR. A one-year window around the NCR's release (from October 1997 to October 1999) allows for such learning to take place, at the methodological expense of introducing the possibility that other events may also be influencing risk levels.
Table 6 presents the results of differences-in-differences regressions for the full sample (Panel A) and for the propensity-matched sample (Panel B). In table 6, we find that all types of risk for politically active firms increased after the NCR's release, and the results of quantile regressions (not reported in the tables) show that these findings hold for firms across the risk spectrum. One possible cause of this evolution is that investors realized that the ability of firms to effectively manage regulatory issues—thereby encouraging stability—was especially threatened by the NCR.
Table 6: Widening the event window: Differences-in-differences regressions estimating the effect of the Neill Committee Report on monthly return volatility for UK firms, October 1997 to October 1999
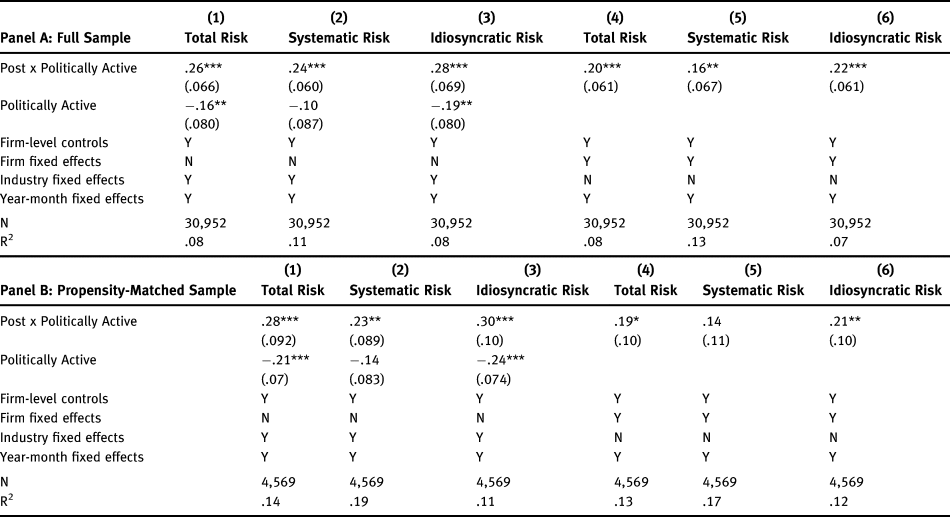
Note: The sample starts 12 months before the NCR's release and ends 12 months after the NCR's release. Post is equal to 1 if the year-month is November 1998 to October 1999, and 0 otherwise. Standard errors clustered by firm are in parentheses. ***, **, and * denote statistical significance levels at 1%, 5%, and 10%, respectively.
We are cautious in our interpretation of these findings because of the length of the time window and the magnitude of the effects (15–30 percent increases in risk). It is certainly plausible that the changes are due to other factors besides the NCR, but on balance, the findings in table 5 and table 6 are consistent with the conclusion that the NCR failed to reduce risk levels for politically active firms, and likely increased them.
What is the effect of the NCR on firm value?
We examine the effect of the NCR on firm value in two ways. First, we study one-day and three-day abnormal returns around the day of the NCR's release, 12 October, as well as several dates prior to its release, including on days with relevant news and the date when the report was provided to members of the UK government (8 October), which created the potential for trading on inside information.Footnote 33 Some news reports duplicate previously reported information, but with additional nuance that may be relevant for traders.
Table 7 presents the results. The coefficients for the regressions focused on specific event dates are sometimes positive, sometimes negative, and rarely statistically significant. While the coefficient on Politically Active is negative for the specification aggregating abnormal returns over all events, it is not statistically significant. The lack of a statistically significant association on aggregated returns may be due to several reasons, including that investors took time to learn about the implications of the NCR's recommendations and that investors wanted to wait to act on the news to see how elected officials reacted to the report.
Table 7: Regressions estimating the effect of the Neill Committee Report on cumulative abnormal returns
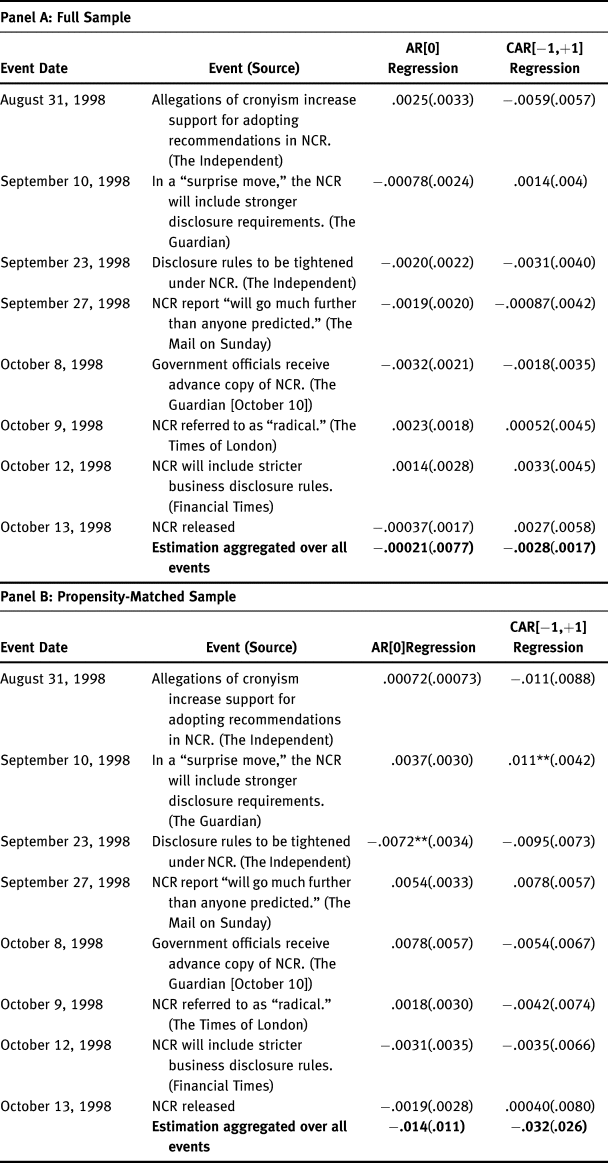
Note: The table reports the coefficient and standard errors on Politically Active for regressions of one-day (AR[0]) and three-day (CAR[−1,+1]) announcement returns on Politically Active, firm-level controls, and industry fixed effects. Dates are adjusted accordingly if the event date is not a trading day. Standard errors clustered by industry are in parentheses. ***, **, and * denote statistical significance levels at 1%, 5%, and 10%, respectively. N = 1,375 for Panel A regressions and 216 for Panel B regressions.
To allow for learning by investors, we perform a differences-in-differences regression focused on Tobin's Q for multiple event windows (1997–99 and 1996–2000). Tobin's Q is measured once per year and allows us to take a longer-run perspective on the effect of the NCR. Panel A of table 8 reports results for the entire sample, and Panel B reports the results for the propensity-matched sample.
Table 8: Differences-in-differences regressions estimating the effect of the Neill Committee Report on firm value (Tobin's Q) for UK firms, various time periods
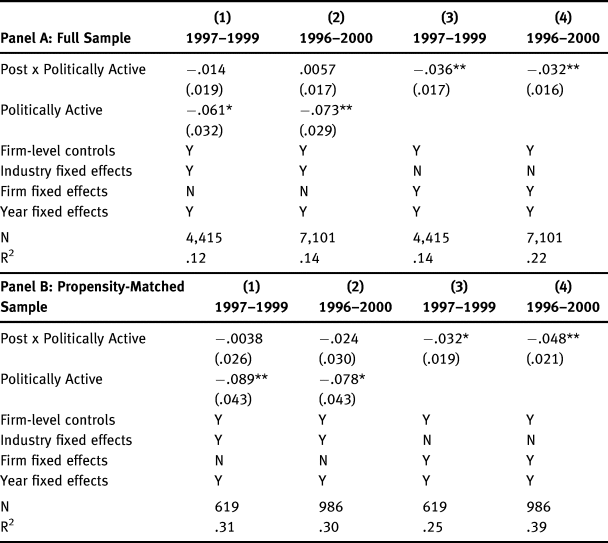
Note: Post is equal to 1 if the year is 1998 or afterwards. Standard errors clustered by firm are in parentheses. ***, **, and * denote statistical significance levels at 1%, 5%, and 10%, respectively.
The negative coefficients on Politically Active in the industry fixed effects specifications in columns (1) and (2) of both table 8 panels show that prior to the NCR's release, politically active firms were less valuable than politically inactive firms, consistent with their lower volatility.
As we noted earlier, the proposed regulations in the NCR had the potential to reduce a firm's flexibility and agility in responding to proposed regulatory changes vis-à-vis other firms. Firms may become more likely to face adverse regulatory changes and less likely to push for value enhancing regulatory changes, causing the return distribution to become more negatively skewed. This could be assessed using the third moment of the return distribution. However, the skewness measure violates the parallel trends assumption using the NCR as the breakpoint, so we cannot address this possibility directly. We can, however, use the firm fixed effects regressions in columns (3) and (4), combined with the volatility findings presented earlier, to indirectly assess this possibility.
Specifically, does firm value decline as volatility increases—consistent with the idea that negative shocks are now more likely? In a word: yes. We see that the NCR made matters worse for politically active firms, reducing firm value in addition to increasing volatility. Panel A shows that the NCR reduced firm value for politically active firms by 3–4 percent, while Panel B shows that the NCR reduced firm value for politically active firms by 3–5 percent.
While the usual caveats apply given the length of the event windows in the table 8 analyses, the results in table 7 and table 8 combined give us confidence that the NCR did not increase politically active firms’ stock prices in the near term and likely reduced them in the long run.
Conclusion
In this paper, we find that greater oversight of corporate political behavior appears to hurt rather than help shareholders by increasing stock volatility, especially for higher-risk firms, and we find some evidence that it also reduces firm value as measured by Tobin's Q (though not when we look at announcement returns). These results run counter to the conventional wisdom that disclosure and shareholder democracy, including the PPERA law spawned by the NCR, are beneficial to shareholders.
Torres-Spelliscy and Fogel (Reference Torres-Spelliscy and Fogel2011), as well as Bebchuk and Jackson (Reference Bebchuk and Jackson2010), view the effects of the PPERA favorably, and Bebchuk and Jackson (Reference Bebchuk and Jackson2010) even argue that the law does not go far enough in giving shareholders a say on spending. Why is the UK experience so at odds with these views? We argue that the typical justification for shareholder approval and disclosure is incomplete, as it only focuses on the risk that managers may misuse corporate funds (either to pursue their own political ends or in excessively risky ways). It does not acknowledge, however, that activists may have ideological motivations that are not in the best interests of shareholders, and that the shareholder approval process provides them with an easy avenue to attack the corporation. In other words, the preferences of some shareholders may not be aligned with the goal of maximizing shareholder value. Even if these attacks never occur, to the extent that managers change their behavior in light of these fears (i.e., reduce their involvement in the political process), the firm may be less adept at responding to political threats, and as a result, volatility may increase.
Our paper is the first to quantify the costs to firms as a result of the NCR and PPERA, in the form of increased stock volatility and lower Tobin's Q, and offers good reason to be cautious about the advisability of implementing similar rules in the United States. To be sure, our paper cannot disentangle the independent effects of disclosure and shareholder approval, but one can easily see how the policies reinforce each other in serving as deterrents to corporate political activity. In fact, activists in the United States have explicitly connected disclosure with shareholder resolutions, demonstrating how they might be used in tandem:
The data in Corporate Transparency may also be used to launch shareholder resolution campaigns to prevent corporations from making these types of expenditures. Working with partner organizations such as yours, we will help to make the case that political spending is not within the fiduciary interest of publically traded corporations and therefore should be limited. In fact, our efforts to expose spending will enable us to make the case that a corporation's political efforts have the potential to irreparably damage its brand and bottom line. Footnote 34
This quotation highlights how our results speak to the ongoing debate in the United States, despite the differences between the UK and U.S. political systems. In the United States, most of the discussion has focused on the issue of corporate political disclosure. As in the United Kingdom prior to the PPERA, there is already some disclosure of political spending by corporations in the United States, but there are calls for the federal government to strengthen these disclosure requirements. Meanwhile, activists and others are calling on corporations to voluntarily increase disclosure requirements. Baloria et al. (Reference Baloria, Klassen and Wiedmann.d.) find that 20 percent of firms targeted by disclosure proposals subsequently strengthen their disclosure policies. This variation in outcomes suggests that mandating a one-size-fits-all disclosure policy may actually disrupt the existing equilibrium under which shareholders can pressure the corporation to make changes in disclosure, and the firm's leadership can determine whether such changes are in the firm's best interests.
While shareholder approval has not received as much attention as disclosure in the United States, the proposal is hardly a fringe idea. Two of the scholars who signed on to the request for SEC oversight of corporate disclosure—Bebchuk and Jackson—are also ardent supporters of shareholder approval (see above), and U.S. Senator Elizabeth Warren introduced the Accountable Capitalism Act in August 2018. If enacted, the bill would require corporations to secure the approval of 75 percent of shareholders to engage in campaign spending.
Moreover, the effects of shareholder approval in the United States could be even worse for firms than what UK firms have experienced. Verret (Reference Verret2011) argues that politically motivated shareholders, like unions and pension funds controlled by politicians, are more prevalent in the United States and are likely to use shareholder approval as a political weapon. Recent empirical work lends credence to this argument. Matsusaka et al. (Reference Matsusaka, Ozbas and Yi2017) show that labor unions use their shareholder proposal rights as bargaining chips during contract talks. Min and You (Reference Min and Youn.d.) find that groups like public pension funds, religious groups, and funds focused on corporate social responsibility tend to target corporations run by Republican-leaning companies. Baloria et al. (Reference Baloria, Klassen and Wiedmann.d.) find that investors react more negatively to shareholder-activism-induced changes in political spending disclosure policies when the proposals emanate from union or public pension funds.
We believe it is important for scholars to apply the tools of social science to ongoing policy debates in a way that advances both the scholarly literature and the policy discussion. As we noted in the introduction, our paper does not speak to the total social welfare effects of disclosure and shareholder approval. There may be legitimate reasons to implement disclosure and shareholder approval policies arising out of concerns about corporate influence in politics, for instance. Our paper calls into question, however, one of the major justifications for these reforms: that shareholders and firms benefit. Our theoretically informed empirical analysis suggests otherwise.

