Cancer cachexia is characterised by unintentional body weight loss, especially loss of skeletal muscle mass, and a loss of homoeostatic control of both energy and protein balance, which negatively affects the quality of life and survival of patients with cancer(Reference Baracos, Martin and Korc1). The progression of cancer cachexia is based on the patients’ response to tumour progression, including parameters such as the activation of inflammation and energetic inefficiency in the mitochondria(Reference Argilés, Busquets and Stemmler2). In addition to the loss of skeletal muscle mass, cancer cachexia is now considered to be a systemic paraneoplastic syndrome that affects and compromises a variety of tissues, including adipose tissue, heart, blood, liver and additional tissues(Reference Schmidt, Rohm and Herzig3). In progressive cancer cachexia, body fat loss, caused by the hydrolysis of TAG into NEFA and glycerol, often precedes muscle loss(Reference Fouladiun, Korner and Bosaeus4). Recent studies have revealed that brown adipose tissue metabolism and thermogenesis disorders contribute to the hypermetabolic state of cancer cachexia in cachectic mice(Reference Tsoli, Moore and Burg5). Cancer cachexia can also cause wasting of the heart muscle, which is accompanied by cardiac remodelling and dysfunction(Reference Murphy6). In addition to transporting inflammatory factors, blood also changes to a highly coagulable state(Reference Reddel, Allen and Ehteda7). Changes in liver function might cause increased energy loss and mortality in patients with cancer cachexia, and these losses have been associated with changes in liver function and have been considered to account for a significant proportion of the energy loss in patients with cancer cachexia(Reference Peyta, Jarnouen and Pinault8). Cachexia occurs in at least half of all patients with cancer(Reference Talbert, Cuitino and Ladner9).
In particular, patients with cancer are at a high risk of malnutrition because of the disease itself, and their treatments threaten their nutritional status(Reference Arends, Baracos and Bertz10). Disease-associated malnutrition is a common problem among patients with cancer, affecting 25–70 % of patients with certain cancers(Reference Schneider and Correia11). If untreated, malnutrition often progresses to severe wasting associated with cancer cachexia. The 10–20 % of cancer patients’ deaths can be attributed to malnutrition rather than to the malignancy itself(Reference Jensen, Compher and Sullivan12). To diagnose cancer malnutrition, clinicians used BMI, waist circumference or triceps skin fold (TSF)(Reference Gunalay, Ozturk and Akar13). Recently, the Global Leadership Initiative on Malnutrition provided a two-step approach to the diagnosis of malnutrition based on phenotypic and aetiologic criteria. The phenotypic criteria included weight loss, low BMI and reduced muscle mass and were assessed by physical examination, anthropometric measures or assessments of muscle strength, such as handgrip strength (HGS). The aetiologic criteria include inflammation and reduced food intake or assimilation(Reference Cederholm, Jensen and Correia14). Previous studies have also reported that a low skeletal muscle index was associated with worse survival in patients with solid tumours(Reference Shachar, Williams and Muss15). However, skeletal muscle index was based on the existing computed tomographic cross-sectional imaging and readily available software. We did not consider skeletal muscle index as an anthropometric measure that would be easy to use for patients.
Although advances have been made in understanding the mechanisms of cachexia, translating these advances to the clinic has been challenging. We found that no relevant study has yet been conducted to determine which easily available measurement could predict the mortality of patients with cancer cachexia. Most patients with cancer face a huge financial burden, and many patients are forced to discontinue treatment because of financial problems. Reducing the financial burden is of great significance to patients with cancer in developing countries and poor families. Malnutrition and economic burden are most significant among patients with advanced cancer, especially in patients with cancer cachexia. Therefore, we aimed to find an anthropometric measure that was both economical and easily accessible for patients to understand the consumption of their body and predict survival in patients with cancer cachexia.
Patients and methods
Study population and design
This was a retrospective analysis based on a multicentre clinical trial on cancer (Chinese Clinical Trial Registry (ChiCTR1800020329)). A detailed description of the inclusion and exclusion criteria for the multicentre clinical trial project is provided in a previous report(Reference Xu, Song and Wang16). In summary, patients with cancer aged 18 years or older who were enrolled at forty clinical centres throughout China were recruited from 2013 to 2020. This multicentre, large-scale, long-term follow-up prospective study aimed to help diagnose malnutrition in cancer patients in China and to identify the related risk factors associated with negative outcomes. This study was approved by the medical ethical review committee of the registration hospital and was conducted in accordance with the Declaration of Helsinki.
Patient characteristics
Demographic data, including age, sex, height, weight, survival time, primary tumour site, TNM stage, chronic disease, family history of cancer, EORTC QLQ-30 (The European Organization for Research and Treatment of Cancer QLQ-C30), nutritional support, smoking status, alcohol consumption, tea consumption, total protein, creatinine, albumin, aspartate transaminase, alanine transaminase, Hb, neutrophils, lymphocytes, erythrocytes, platelets, BMI, mid-arm circumference (MAC), TSF, HGS and calf circumference (CC). All pathological stages were defined according to the 8th edition of the American Joint Committee on Cancer TNM staging system(Reference Amin, Greene and Edge17).
Diagnosis of cancer cachexia
Cancer cachexia was diagnosed according to the Fearon criteria: weight loss > 5 % over the past 6 months (in the absence of simple starvation); BMI < 20 and any degree of weight loss > 2 %; or mid upper-arm muscle area by anthropometry (below the 5th percentile, men <23·25 cm2, women <18·75 cm²), and any degree of weight loss > 2 %(Reference Fearon, Strasser and Anker18). Mid upper-arm muscle area was calculated using the following formula: mid upper-arm muscle area (cm2) = (MAC (cm)-(3·14 × TSF (cm))2/(4 × 3·14).
Assessment of variables
All variables (physical assessment, anthropometric, laboratory, questionnaires) were performed within 48 h after admission and analysed before the start of any treatment. BMI was calculated using the following formula: BMI (kg/m2) =weight (kg)/height2 (m2). MAC and TSF were measured at the dominant arm at the midpoint between the acromion and olecranon. The CC was measured in the right leg with the participants lying in the supine position with 90°of knee flexion. The MAC and CC were measured using a plastic metric tape, and TSF was measured using a skinfold caliper. HGS was measured on the dominant hand using a Jamar dynamometer. The mid-arm muscle circumference (MAMC) was calculated using the following formula: MAMC (mm) = MAC (mm)-(3·14 × TSF (mm))(Reference Antonelli Incalzi, Landi and Cipriani19). Lifestyle questionnaires were used to obtain information on smoking status, alcohol consumption and tea consumption. EORTC QLQ-C30 was used to measure quality of life(Reference Aaronson, Ahmedzai and Bergman20).
Laboratory measurements
Laboratory measurements included inflammatory and nutritional biomarkers. All blood tests were performed after at least 9 h of fasting within 24 h of hospitalisation.
Selection of case and control participants
The present analysis used data from a nested case–control study design in which physical examination was measured in 266 patients who survived less than 1 year, as well as 266 manually matched controls. We chose 1 year as the limit because it is a standard time frame used in studies of other chronic medical conditions, such as congestive heart failure(Reference Bueno, Ross and Wang21). Cases were selected from individuals with cancer cachexia who survived less than 1 year after being diagnosed in the hospital. Controls were selected from individuals with cancer cachexia who survived more than 1 year after diagnosis in the hospital, and controls were matched to cases by age (age (sd 5) years), sex, tumour type, tumour stage and hospital site. After excluding four pairs of cases and controls without physical examination, a total of 262 incident colorectal cancer cases and 262 matched controls with available baseline information were included in the analysis. After excluding twenty-six patients without TSF, 3084 patients were included in the test cohort.
Variable definitions
Age was grouped into young (≤ 65 years) and old (> 65 years); albumin into low albumin (≤ 35 g/L) and high albumin (> 35 g/L)(Reference Zhang, Tang and Zhang22); neutrophils into high neutrophils (<6·30 × 109/L) and low neutrophils (≥ 6·30 × 109/L); erythrocyte into low erythrocyte (male <4·0 × 1012/L, female <3·5 × 1012/L) and normal erythrocyte (male ≥ 4·0 × 1012/L, female ≥ 3·5 × 1012/L); BMI was grouped into underweight (≤ 18·5 kg/m2), normal weight (18·5–25 kg/m2) and overweight (> 25 kg/m2)(23). We categorised EORTC QLQ-C30 into low EORTC QLQ-C30 (≤ 55·5), high EORTC QLQ-C30 (> 55·5) and TSF into low TSF (male <12·25 mm and female <12·05 mm) and high TSF (male≥ 12·25 mm and female ≥ 12·05 mm) by Youden index(Reference Fluss, Faraggi and Reiser24).
Statistical analysis
Baseline characteristics are presented as the means and standard deviations for continuous variables, and as proportions for categorical variables. Differences in baseline characteristics between cases and controls were compared using the two-sample Wilcoxon rank-sum test or two-sample t test for continuous variables and the χ 2 test for categorical variables. OR and 95 % CI of cancer cachexia patients’ 1-year survival were estimated by modelling risk factors as continuous variables and modelling TSF in quartiles using conditional logistic regression, with and without adjustment for matched variables (EORTC QLQ-C30, albumin, neutrophils, erythrocyte, chronic disease, family history of cancer). The matched variables were selected using stepwise regression. The cutoff values were based on the clinical standard(Reference Keller25), WHO criteria(23) or Youden index(Reference Hajian-Tilaki26). Heterogeneity across subgroups was assessed by fitting simultaneous logistic regressions, and the results are presented in forest plots. Interactions between subgroups and TSF were examined by likelihood ratio testing. Analyses in the base cohort (n 3084) were conducted using the Kaplan–Meier method and survival curves and time receiver operator characteristic curve.
For practical reasons, an increase in the AUC of 0·025 per additional risk factor is considered clinically relevant(Reference Apfel, Kranke and Greim27). A two-tailed P < 0·05 was considered to be statistically significant in all analyses. All analyses were performed using R software, version 4.0.2.
Results
Characteristics of patients
Patients who survived less than 1 year tended to have higher EORTC QLQ-C30 scores (54·15 (sd 11·66) v. 49·60 (sd 8·60); P < 0·001), higher neutrophil levels (5·79 (sd 3·71) v. 4·30 (sd 2·89); P < 0·001), lower total protein (64·94 (sd 8·85) v. 67·51 (sd 7·40); P < 0·001), lower albumin (35·30 (sd 5·49) v. 37·92 (sd 5·51); P < 0·001), lower Hb (113·17 (sd 21·84) v. 120·27 (sd 18·11); P < 0·001), lower BMI (20·17 (sd 2·92) v. 21·17 (sd 3·21); P < 0·001), lower TSF (12·39 (sd 6·76) v. 14·68 (sd 7·30); P < 0·001) and more nutritional support (45·4 % v. 33·6 %; P < 0·001) at baseline than control subjects (Table 1).
Table 1. Detailed baseline characteristics of the study population
(Mean values and standard deviations; number and percentages)

a OS, overall survival; EORTC QLQ-C30, The European Organization for Research and Treatment of Cancer QLQ-C30; AST, aspartate transaminase; ALT, alanine transaminase; PLT, platelet; MAC, mid-arm circumference; MAMC, mid-arm muscle circumference; CC, calf circumference; TSF thickness, triceps skin fold thickness; HGS, handgrip strength.
b Differences in baseline characteristics were compared using χ 2 test for categorical variables and two-sample t test for continuous variables.
Association between anthropometric measurements and 1-year survival of patients with cancer cachexia
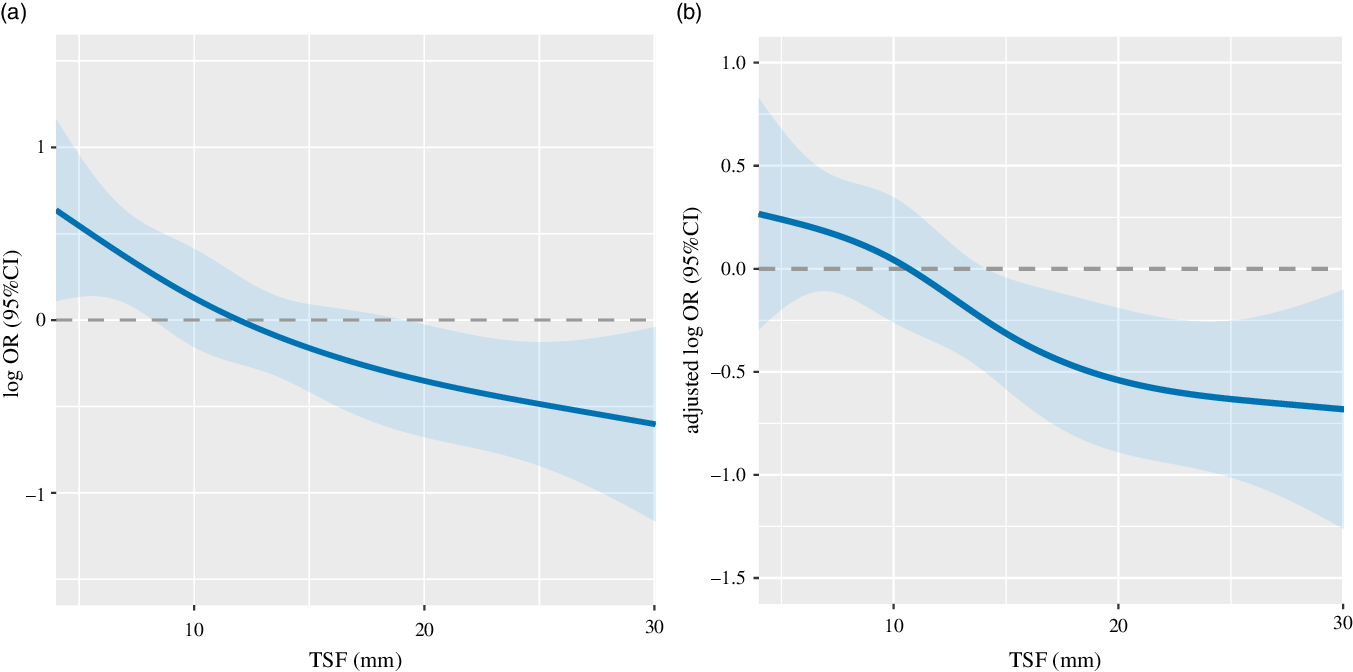
There was a significant positive association between TSF and 1-year survival of patients with cancer cachexia (adjusted P = 0·014; adjusted OR: 0·96; 95 % CI 0·93, 0·99) (Table 2, Fig. 1). When TSF was categorised into quartiles (Q1 < 8 mm, Q2:8–12 mm, Q3:12–18 mm, Q4 ≥ 18 mm), TSF showed a stronger protective factor as it increased (P for trend = 0·067) (online Supplementary Table S1).
Table 2. Result of conditional logistic regression analysis of anthropometric measurements and 1-year survival of patients with cancer cachexia
(Odds ratio and 95 % confidence intervals)

a OR, odds ratio; CI, confidence interval; TSF thickness, triceps skin fold thickness; HGS, handgrip strength; MAC, mid-arm circumference; CC, calf circumference; EORTC QLQ-C30, The European Organization for Research and Treatment of Cancer QLQ-C30.
b OR of 1-year survival of patients with cancer cachexia relation to characteristics were calculated using conditional logistic regression models. Each characteristics analysis adjusted, if not stratified, for EORTC QLQ-C30, albumin, neutrophils, erythrocyte, chronic disease and family history of cancer.

Fig. 1. The relation of TSF with 1-year survival of patients with cancer cachexia stratified. Notes: The relation of TSH with 1-year survival of patients with cancer cachexia stratified unadjusted (A: as a continuous variable P < 0·001; OR: 0·95; 95 % CI 0·92, 0·97) and adjusted (B as a continuous variable P = 0·014; adjusted OR: 0·96; 95 % CI 0·93, 0·99). OR of 1-year survival of patients with cancer cachexia and TSF were estimated by modelling TSF as a continuous variable using logistic regression analysis. Adjusted for EORTC QLQ-C30, albumin, neutrophils, erythrocyte, chronic disease, family history of cancer. TSF, triceps skin fold; EORTC QLQ-C30, The European Organization for Research and Treatment of Cancer QLQ-C30.
Subgroup analyses
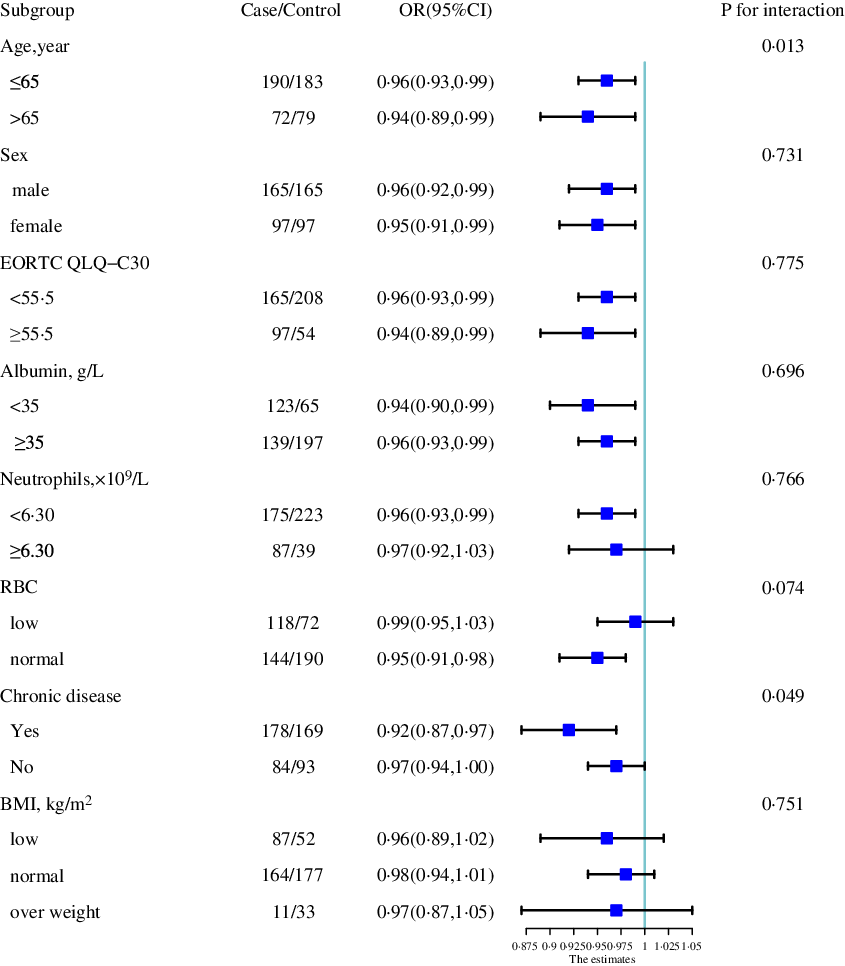
Stratified analyses were performed to assess the association between TSF (as a continuous variable) and 1-year survival of patients with cancer cachexia in various subgroups. A significantly more positive association between TSF and 1-year survival was found in young patients (OR: 0·96; 95 % CI 0·93, 0·99) than in older patients (OR: 0·94; 95 % CI 0·89, 0·99; P interaction = 0·013). Similar results were observed in patients with chronic disease (OR: 0·97; 95 % CI 0·94, 1·00) compared with patients without chronic disease (OR: 0·92; 95 % CI 0·87, 0·97; P interaction = 0·049). Other subgroups of different age, sex, quality of life, inflammatory, albumin and treatments showed the same trend that the TSF was the protective factor (Fig. 2, online Supplementary Fig. S2).

Fig. 2. The association between TSF (as continue value) and the risk of 1-year survival of patients with cancer cachexia in various subgroups. Notes: OR of 1-year survival of patients with cancer cachexia relation to TSF (as continue value) were calculated using logistic regression models. Each subgroup analysis adjusted, if not stratified, for EORTC QLQ-C30, albumin, neutrophils, erythrocyte, chronic disease, family history of cancer. TSF, triceps skin fold; EORTC QLQ-C30, The European Organization for Research and Treatment of Cancer QLQ-C30.
Analysis of total patients with cancer cachexia
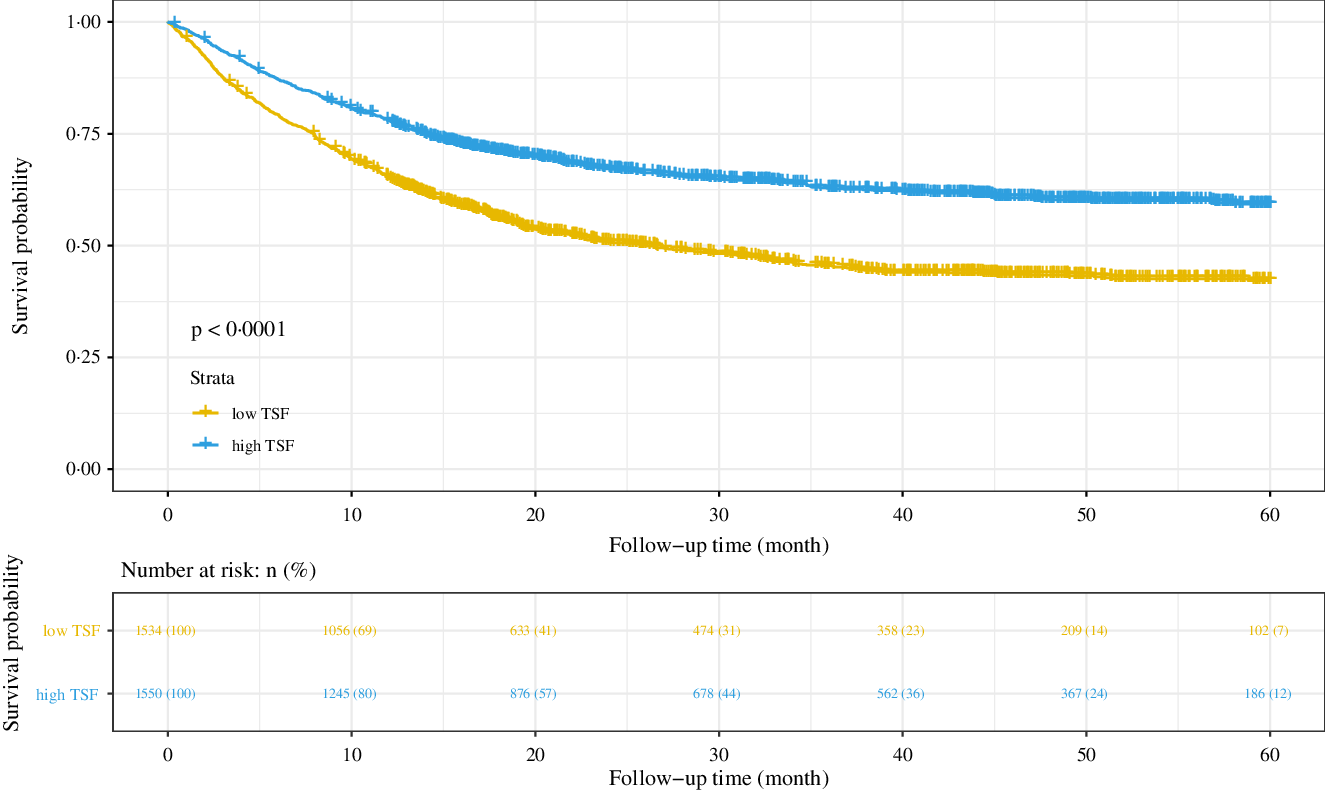
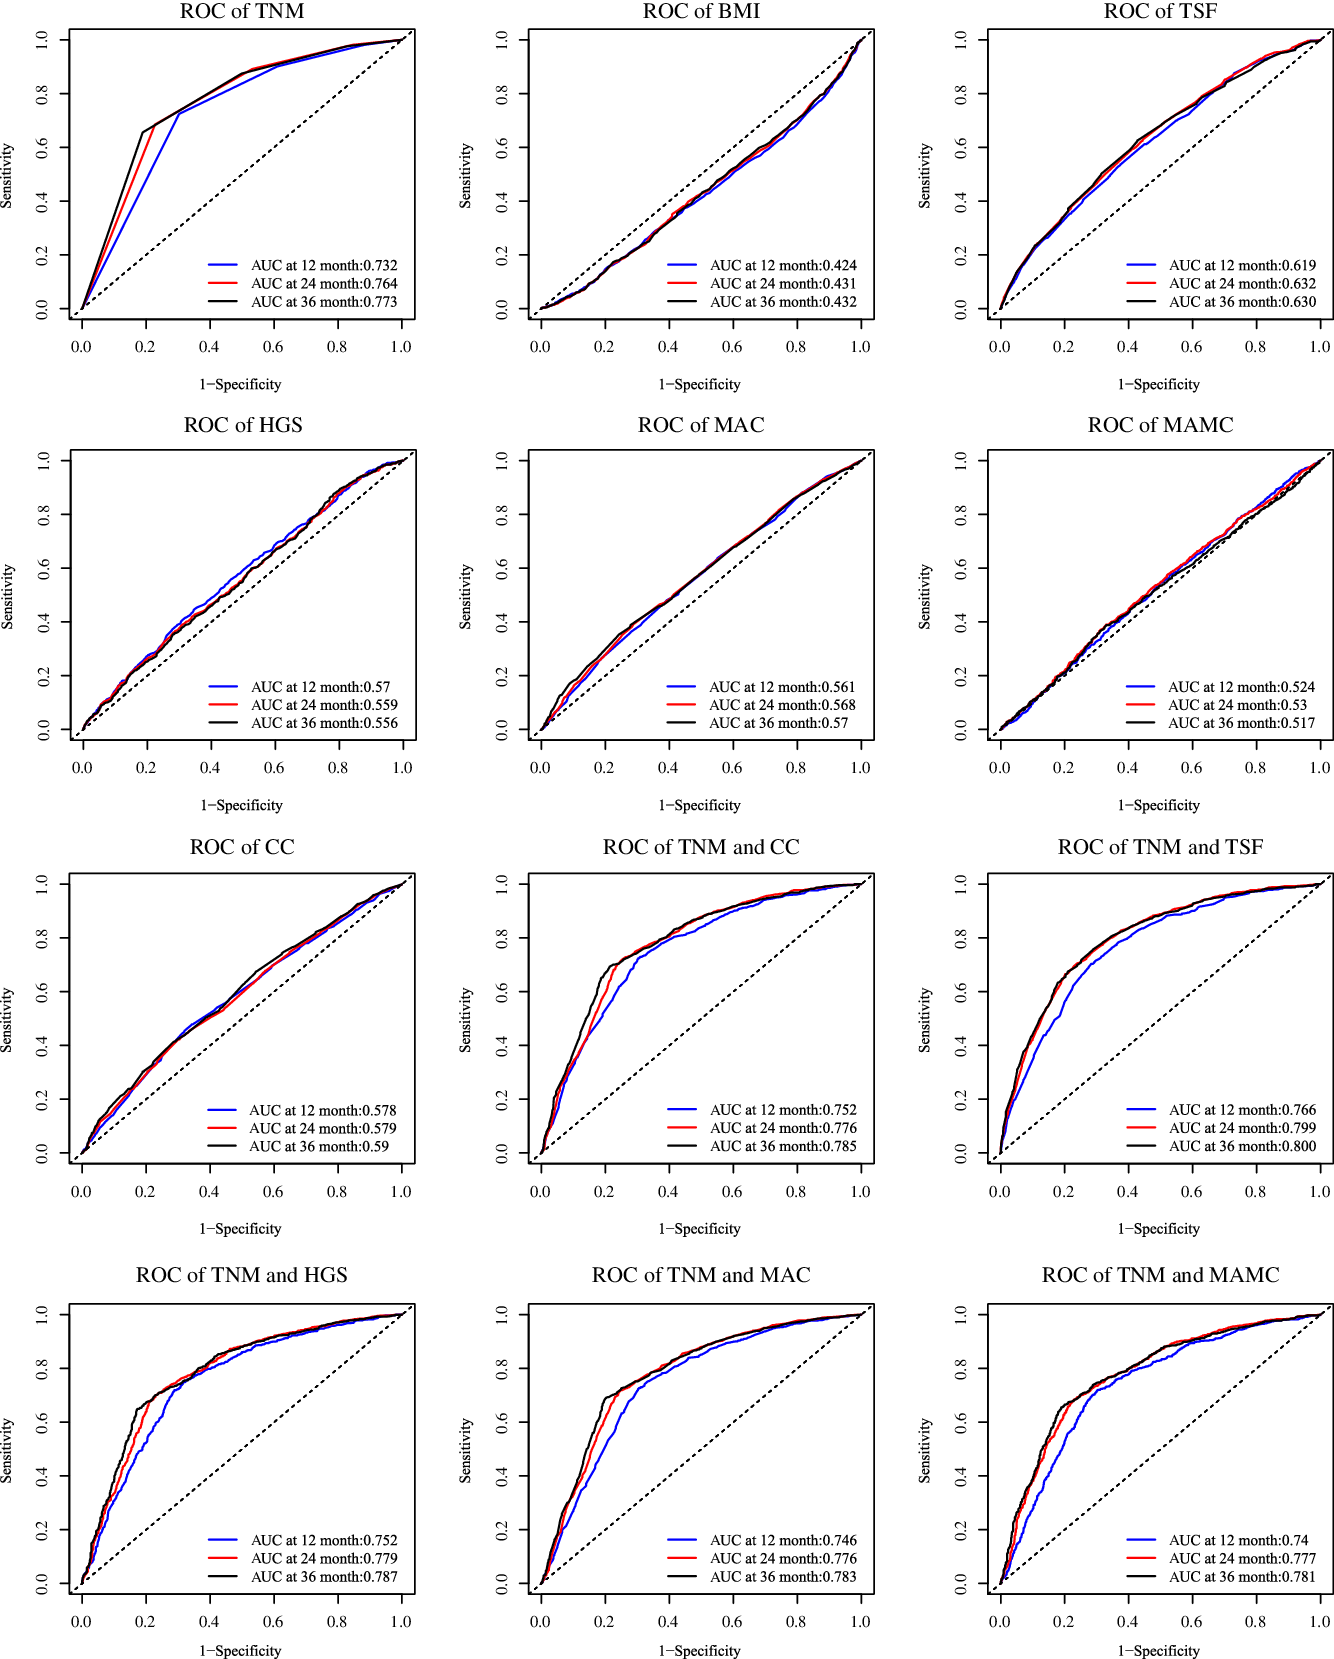
In the base cohort (n 3084), patients with high TSF had better survival probability (P < 0·001) (Fig. 3), with a median overall survival of 16·03 months, whereas patients with high TSF showed a median overall survival of 21·68 months. The AUC at 12 months of TSF, BMI, HGS, MAC, MAMC and CC was 0·619, 0·424, 0·570, 0·561, 0·524 and 0·578. TSF had the highest AUC.

Fig. 3. Results of the Kaplan–Meier survival analysis for patients with cancer cachexia stratified by TSF. Notes: Based on the patients with cancer cachexia follow-up more than 1 year (n 3084). TSF, triceps skin fold; HR, hazard ratio.
Compared with only TNM stage (AUC at 12 months = 0·732, AUC at 24 months = 0·764, AUC at 36 months = 0·773) in predicting prognosis, the TNM stage and TSF showed the best improvement (AUC at 12 months = 0·766, compared with 0·732, AUC increased > 0·025) in predicting prognosis, while the TNM stage and HGS (AUC at 12 months = 0·752), the TNM stage and MAC (AUC at 12 months = 0·746), the TNM stage and MAMC (AUC at 12 months = 0·740), the TNM stage and CC (AUC at 12 months = 0·752) were considered as not clinically relevant (compared with 0·732, AUC increased < 0·025) (Fig. 4).

Fig. 4. Comparing in improve the predicting prognosis of TNM stage. Notes: Based on the patients with cancer cachexia follow-up more than 1 year (n 3084). TSF, triceps skin fold; HGS, handgrip strength; MAC, mid-arm circumference; MAMC, mid-arm muscle circumference; CC, calf circumference.
Discussion
Based on previous studies, we hypothesised that HGS, MAC, MAMC, CC, BMI and TSF might be good anthropometric measurements that could predict cancer survival(Reference Manguso, D’Ambra and Menchise28,Reference Aatif, Hassani and Alayoud29) . We wanted to find an anthropometric measurement for patients that were easily available at home and helped patients realise the consumption of their body. Based on our study, we found that TSF may be a good indicator for patients with malignant consumption and was sensitivity to the 1-year survival of patients with cancer cachexia.
Reports have shown that the MAC (HR: 1·79; 95 % CI 1·48, 2·16 in males and HR: 2·26; 95 % CI 1·71, 3·00 in females) might be a more feasible and valid anthropometric measure of mortality than BMI (HR: 1·38; 95 % CI 1·17, 1·61 in males and HR: 1·56; 95 % CI 1·10, 2·21 in females) and CC (HR: 1·45; 95 % CI 1·22, 1·71 in males and HR: 1·30; 95 % CI 1·15, 1·48 in females) in elderly people(Reference Wijnhoven, van Bokhorst-de van der Schueren and Heymans30). MAC and CC have been used to evaluate muscle mass, and da Silva et al. (Reference da Silva, Wiegert and Oliveira31) found that sarcopenia evaluated by MAC (HR: 1·57; 95 % CI 1·12, 2·18) and CC (HR: 2·00; 95 % CI 1·45, 2·76) showed a higher risk of mortality in a study conducted with 334 advanced cancer patients. We found that TSF and BMI, especially TSF, were associated with 1-year survival. The association between HGS, skeletal muscle index or CC and the 1-year survival of patients with cancer cachexia might be because the patients included in our study experienced severe malnutrition.
The obesity paradox is an interesting finding recently reported in patients with cancer; increased BMI is associated with an increased risk of common and less common malignancies, but in patients with cancer, overweight patients have longer survival times(Reference Renehan, Tyson and Egger32,Reference Antonopoulos and Tousoulis33) . These reports show that BMI is significantly associated with survival. Martin et al. (Reference Martin, Birdsell and Macdonald34) reported that in patients with cancer cachexia, regardless of whether they presented as obese, the factors high weight loss, low muscle index and low muscle attenuation were prognostic factors for survival (8·4 months (95 % CI 6·5, 10·3) v. 28·4 months (95 % CI 24·2, 32·6), P < 0·001). However, Sala et al. (Reference Sala, Rossi and Antillon35) and Hurtado-López et al. (Reference Hurtado-López, Larrosa-Haro and Vásquez-Garibay36) found that arm anthropometry, such as MAC and TSF, is an alternative tool to identify malnutrition because arm anthropometry is not influenced by either large tumour masses or peripheral oedema associated with the disease. This might explain why the TSF showed a better association with 1-year survival than BMI. We found the same positive association between TSF and survival in the baseline cohort (n 3084). In a previous study, HGS was strongly associated with cancer mortality in cancer patients(Reference Zhuang, Zhang and Li37), but we found that TSF showed a much better associated with cancer mortalities. That might be because of the patients with cancer cachexia have been facing more serious malignant consumption of nutrition. TSF is a good index that could show the fat levels of patients, HGS shows the muscle function, MAMC is related to muscle mass and other anthropometry indexes show the muscle and fat mass. In patient with cancer cachexia, the malignant consumption of nutrition might cause them faced the loss of both muscle mass and fat mass. In this study, we showed that the nutritional reserve represented by fat mass was sensitive to the 1-year survival of patients with cancer cachexia; combined with the TNM stage, TSF increased the survival prediction performance of the TNM stage, but HGS and MAMC had no statistical association with 1-year survival in patients with cancer cachexia. The underlying causes may be that (1) lipolysis precedes skeletal muscle breakdown during the course of cancer cachexia(Reference Das, Eder and Schauer38), and (2) adipose tissue loss is more sensitive than muscle mass loss in 1-year survival predicting.
Ageing is often associated with malnutrition, and nutritional interventions have been used to delay ageing and age-related diseases(Reference Simpson, Le Couteur and Raubenheimer39). Assessing the nutritional status of the older population revealed an important significance in improving the lives of the elderly(Reference Vellas, Guigoz and Garry40). In the subgroup analyses, we observed the same results that the TSF has more sensitivity in the older population. Chronic diseases such as chronic kidney disease, cirrhosis, chronic liver disease, chronic pancreatitis and diabetes always combine with a bad end(Reference Juakiem, Torres and Harrison41–Reference Sinclair, Abdelhafiz and Rodríguez-Mañas44). We found that in patients without chronic disease, TSF might be a more sensitivity protective factor than in patients with chronic disease.
One strength of our study was that we excluded the influence of the hospital, tumour type and stage, age and sex by building a nested case–control study. However, there are still some limitations that should be considered. First, because the study was retrospective, some anthropometric measurement data were not available, which may have resulted in selection bias. Second, the sample size of patients with cancer cachexia included in our study was very small, which may severely influence the findings of the subgroup analyses. Third, although we included many covariates in the regression models, the effects of unmeasured factors could not be excluded.
In conclusion, we found that the TSF might be a good anthropometric measurement for predicting 1-year survival in patients with cancer cachexia, especially in elderly patients or patients without chronic disease. Moreover, we found that TSF might be a more sensitivity malnutrition indicator than BMI or HGS in patients with cancer cachexia. We hope that doctors and patients will not only pay attention to BMI but also consider TSF. Teaching patients to measure TSF regularly, such as once a month, could detect malnutrition and cachexia early, help patients take nutrition intervention timely and improve clinical outcomes.
Acknowledgements
This work was supported by the National Key Research and Development Program (2017YFC1309200).
H.-P. S., H.-X. X., C.-H. S. and C. W. conceived and designed the work that led to the submission, acquired data and/or played an important role in interpreting the results. Y.-Z. G., G.-T. R., M. T. and X. Z. drafted and revised the manuscript. Y.-Z. G., Q. Z., H.-P. S., M.-M. S., X.-W. Z., M. Y. and X. S. approved the final version of the manuscript. Y.-Z. G. and K.-P. Z. agreed to be accountable for all aspects of the work in ensuring that questions related to the accuracy or integrity of any part of the work are appropriately investigated and resolved.
All authors read and approved the final manuscript.
Supplementary material
For supplementary materials referred to in this article, please visit https://doi.org/10.1017/S0007114521002853


