


Vitamin K is a group of fat-soluble vitamins containing a same core structure with a 2-methyl-1, 4-naphthoquinone ring and different length of side chain at the third position (Fig. 1). It includes phylloquinone (vitamin K1) and menaquinones (vitamin K2, MK). Menaquinones are obtained through the consumption of meat, dairy products, and fermented foods and from bacteria in the large intestine(Reference Marles, Roe and Oketch-Rabah1). Menaquinones have several subtypes, which are classified according to the isoprenoid chain length and are designated MK-n, where n stands for the number of isoprenoid residues in the side chain(Reference Mahdinia, Demirci and Berenjian2). Previous research has shown that MK-7 is a multipotent vitamin K2 with high bioavailability and a long half-life in the blood(Reference Mahdinia, Demirci and Berenjian2–Reference Shearer and Newman4).
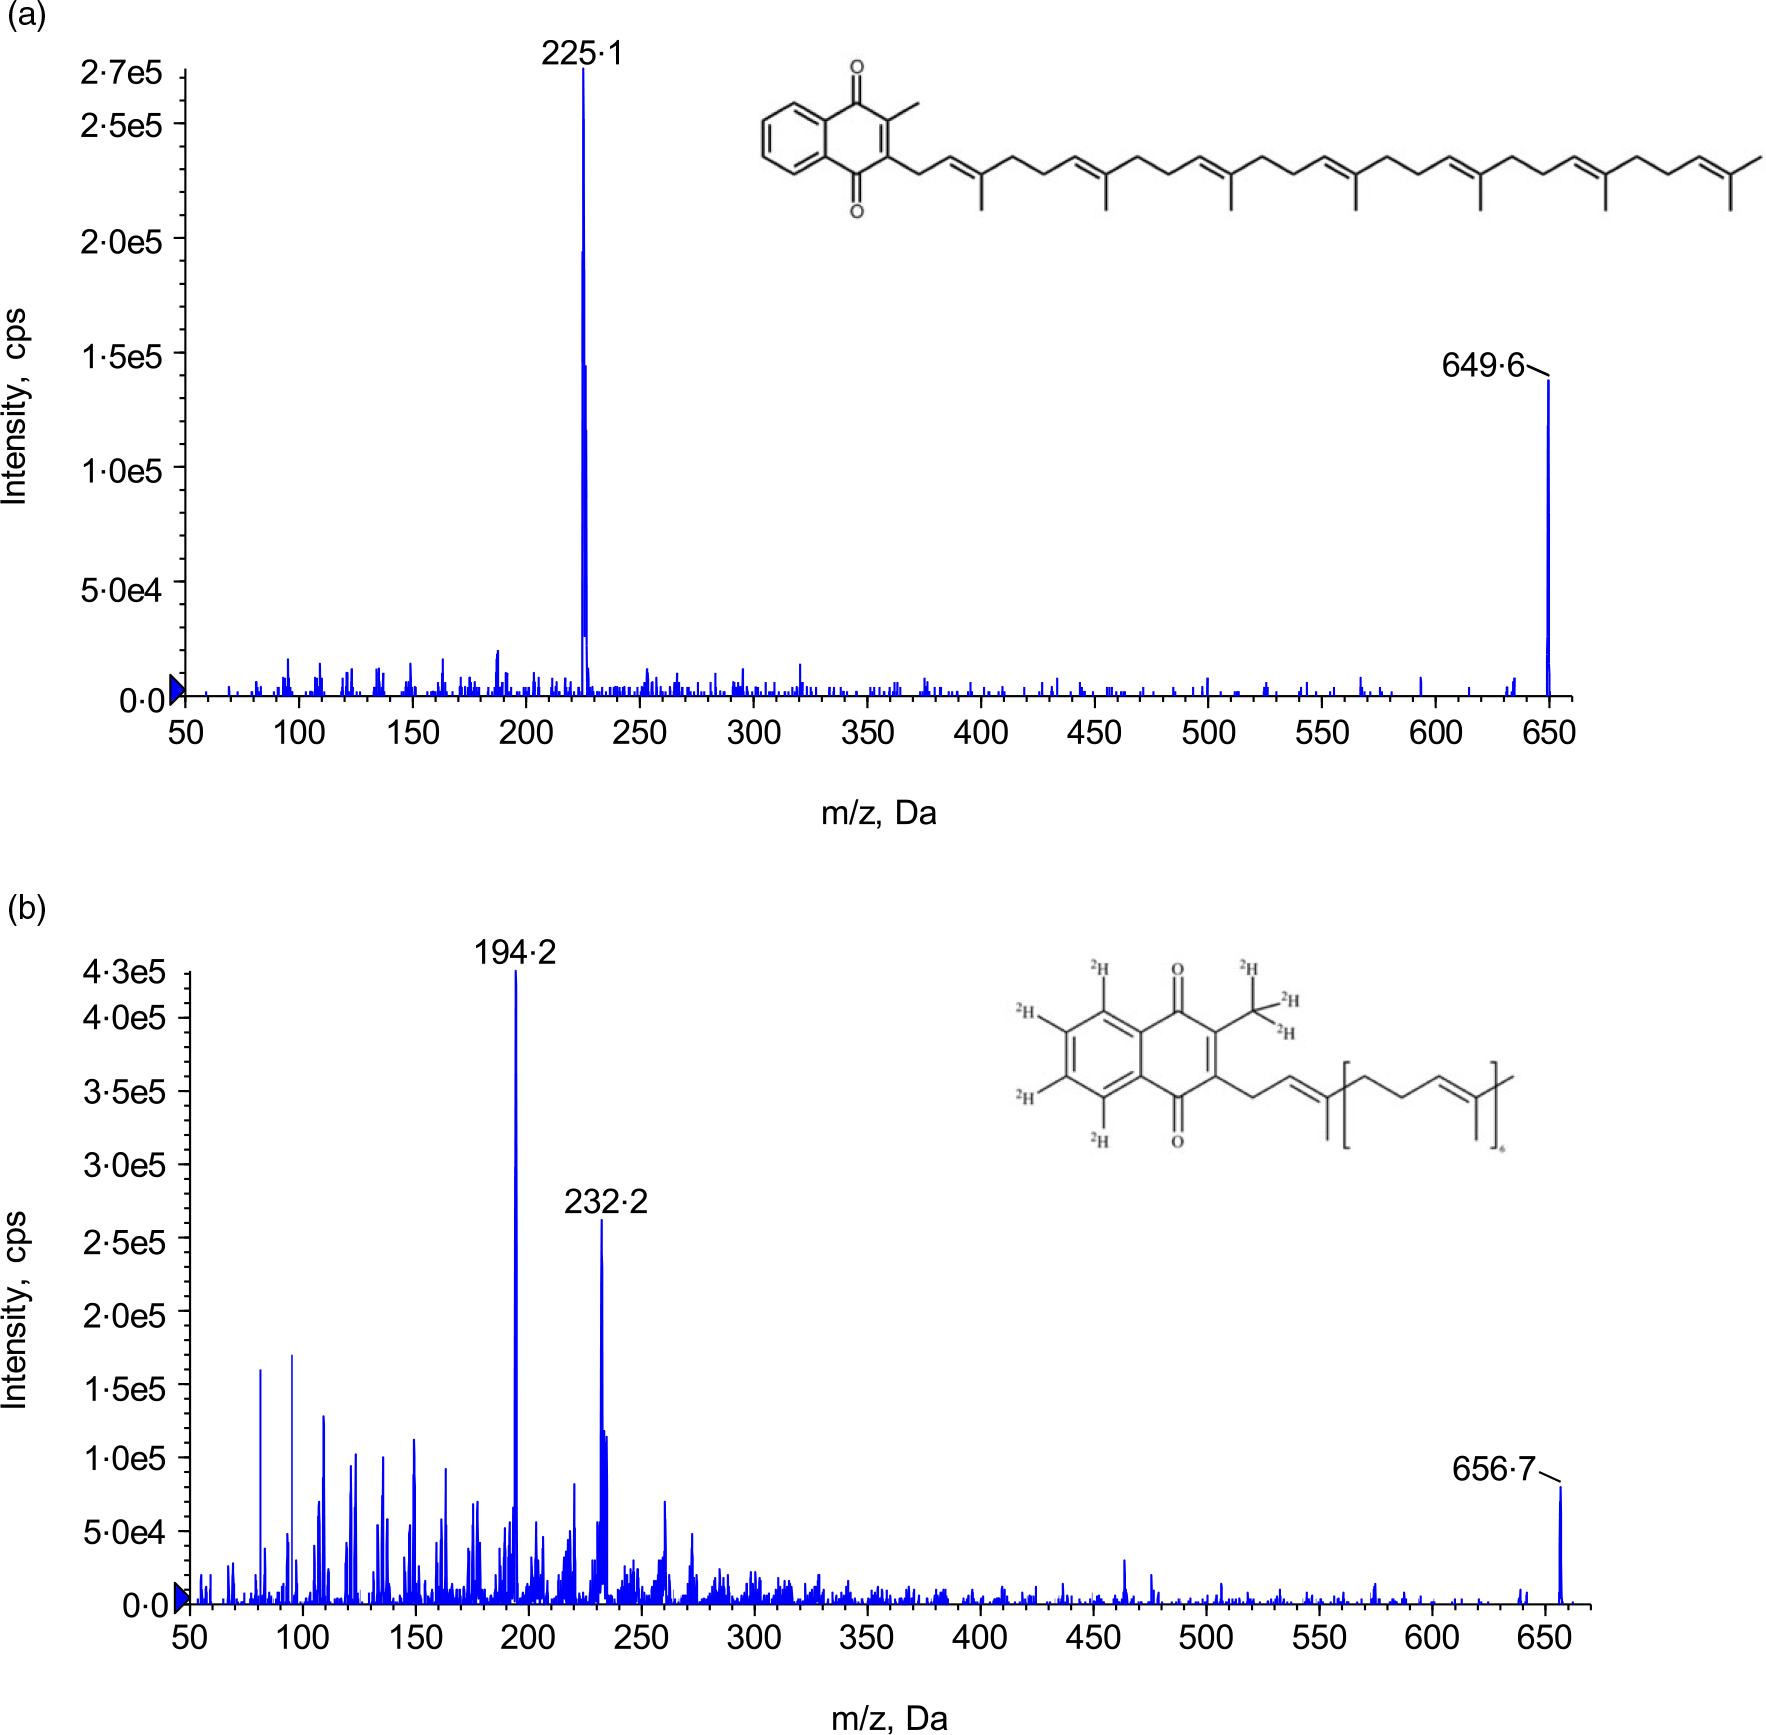
Fig. 1. Structure and product ion scan. (a) MK-7 and (b) MK-7-d7. MK-7, menaquinone-7.
The data on the pharmacokinetics of MK-7 in plasma or blood of humans are limited. The relevant research is hampered by the lack of sensitive and accurate methodology for the quantitation of vitamin K analogues in biological matrices. Three major obstacles contribute to this phenomenon: low circulating concentrations, non-polar property and lipid interferences(Reference Zhang, Bala and Mao5,Reference Klapkova, Cepova and Dunovska6) . Between the two common VK2 analogues, MK-7 is the more lipophilic vitamin analogue compared with MK-4 which presents even more challenges and difficulties to quantify it in biological fluids.
Up to date, only a handful of research papers detailing MK-7 quantitation have been published using either HPLC with fluorescence detection (LC-FD) after post-column reduction(Reference Klapkova, Cepova and Dunovska6–Reference Kamao, Suhara and Tsugawa8), HPLC with chemiluminescence detection (LC-CL)(Reference Ahmed, Kishikawa and Nakashima9), or LC-MS/MS(Reference Suhara, Kamao and Tsugawa10–Reference Dunovska, Klapkova and Sopko12). Although the absolute sensitivity of the LC-FD method is higher than that of LC-MS/MS method, it requires extensive sample purification and post-column reduction with Zn or Pt in order to achieve necessary detection limits and reduce the interference by lipids(Reference Klapkova, Cepova and Dunovska6–Reference Kamao, Suhara and Tsugawa8). The higher specificity and selectivity of LC-MS/MS appears more appealing for the quantitation of MK-7 in human biological fluids. In 2005, Suhara et al. first reported a LC-MS/MS method simultaneously quantifying vitamin K plasma levels (VK-1, MK-4 and MK-7) in human plasma for postmenopausal women(Reference Suhara, Kamao and Tsugawa10). In this method, a comprehensive and three sequential extraction procedures of protein precipitation extraction (PPE), then liquid–liquid extraction (LLE), and followed by solid phase extraction (SPE), was used for sample clean-up. For analysis, a 4·6 × 250 mm C18 LC column and an 80-min gradient programme were utilised to separate all analytes. In 2015, Riphagen et al. developed an LC-MS/MS method for the measurement of vitamin K plasma levels (VK1, MK-4 and MK-7) in chronic kidney patients(Reference Riphagen, van der Molen and van Faassen11). Their sample clean-up procedure is slightly simpler; however, it still involves dual extraction by PPE and followed by SPE extraction. However, they significantly shortened the cycle time to 14 min. In 2019, Dunovska et al. published a LC-MS/MS method for the measurement of vitamin K plasma levels (VK1, MK-4 and MK-7). Their extraction is similar as Suhara’s but with only 11·5 min’ cycle time(Reference Dunovska, Klapkova and Sopko12). Overall, these past LC-MS/MS methods suffered complicated extraction procedures, long cycle times and low throughput. In this study, we present a simple and rapid LC-MS/MS method for the determination of MK-7 in human plasma with single LLE extraction and 4·5-min analysis time. This method was fully validated according to the current regulatory guidance. The method has been applied for investigating endogenous circadian rhythm of MK-7 in plasma and MK-7 bioavailability after 1 mg of drug administrated to subjects. Endogenous MK-7 was measurable in all subjects, and circadian rhythm of MK-7 was investigated for the first time thanks to the sensitivity of the method. A pilot study of circadian rhythm and pharmacokinetic profile of MK-7 was conducted in Study I. Bioavailability and pharmacokinetic parameters of MK-7 were investigated in Study II.
Materials and methods
Chemicals and reagents
Menaquinone-7 (MK-7, Chemical purity ≥ 99·99 %) was provided by Guangdong Sungen Bio (Shantou, Guangdong). Internal standard Menaquinone-7-d7 (MK-7-d7, chemical purity ≥ 98·29 %, isotope purity ≥ 98 %) was purchased from IsoSciences, an MPD Chemicals Company. HPLC grade dimethyl formamide, isopropyl alcohol, hexane, methyl tert-butyl ether, acetonitrile (MeCN) and methanol (MeOH) were purchased from Fisher Scientific; bovine serum albumin (BSA) was purchased from Aladdin; 0·02M phosphate buffer (pH 7·2–7·4) was purchased from Solarbio; ultra-pure water was generated in house by Barnstead Pacific TII combined with Barnstead GenPure Pro (Thermo Scientific) water purification system. Blank K2EDTA plasma and whole blood were obtained from Chonggang General Hospital Phase I Clinical Center.
Solution, standards and quality controls
All solution preparations were conducted under yellow light conditions. Dual stock solutions, each at final concentration of 1·00 mg/ml, were prepared in dimethyl formamide. For validation and sample analysis, the difference between stock solutions from the two separate weightings must be less than 5 % prior to use for standard and quality control (QC) preparation. The calibration standards were prepared in a surrogate matrix of 4 % BSA in PBS buffer at final concentration of 0·500, 1·00, 2·00, 5·00, 12·0, 20·0, 36·0 and 40·0 ng/ml. Two sets of QC samples were prepared from the second stock solution. The first set of QCs (surrogate QC) was prepared in 4 % BSA in PBS buffer containing LLOQ, LQC, MQC and HQC at concentration of 0·500, 1·50, 16·0 and 30·0 ng/ml, respectively. In addition, dilution QC (DQC) at 160 ng/ml which is above the upper detection limit was prepared to verify dilution integrity. The second set (authentic QC), namely P-LQC and P-HQC, was prepared in prescreened human plasma (K2EDTA) with low endogenous level of MK-7. The P-LQC was the authentic human plasma without the addition of MK-7. Its measured concentration was designated as P-LQC T = 0 concentration. The P-HQC was fortified with MK-7 at the concentration approximately similar to HQC in human plasma.
Sample preparation
The entire sample extraction was conducted under yellow light conditions. 400 μl of fortified 4 % BSA in PBS buffer samples (for standards and surrogate QC) or human plasma samples (study sample and authentic QC) were mixed with 100 μl of MK-7-d7 working solution (1000 ng/ml in MeCN) in polypropylene tubes. After 1·0 ml of methyl tert-butyl ether was added, the samples were shaken for 5 min. The fully mixed samples were centrifuged at 13800 g for 10 min. 800 μl of the organic supernatant was transferred to a clean glass tube, followed by evaporation to dryness at 40°C under the stream of nitrogen gas in a turbovap evaporator. After reconstitution, 40·0 μl of the extract was injected onto the LC-MS/MS system for analysis.
Chromatography and MS
The Shimadzu Ultra High-Pressure Liquid Chromatography (UHPLC) system included a Shimadzu SIL-30ACMP Autosampler, two LC-30AD pumps and a CBM-20A controller (Shimadzu). A C18 column (2·0 × 50 mm) with an in-line filter was used for chromatographic separation. Mobile phase A MeOH and mobile phase B is 50/50 IPA/hexane (v/v), and the flow rate is 0·60 ml/min with a gradient followed by forward flush column to clean up the column after each injection. The total cycle time is 4·5 min. The retention time of the analyte and the internal standard is approximately 1·8 min.
Mass detection was achieved by API 5500 triple quadruple mass spectrometer from Sciex which was equipped with an atmospheric pressure chemical ionization (APCI) interface and operated under the positive multiple reaction monitoring mode. The optimised MS parameters were as follows: IS 3, source temperature 600°C, Gas1 50psi, Gas2 50psi, curtain gas 30psi, collision gas 6, entrance potential 11ev, declustering potential 160ev, collision energy 35ev and collision cell exit potential 15ev, respectively. Analyst 1.6.3 software was used for data acquisition and peak integration. The corresponding multiple reaction monitoring transitions MK-7 and MK-7-d7 are 649·7→187·2 and 656·6→194·2, respectively. The chemical structure and the product ion spectra of MK-7 and MK-7-d7 can be found in Fig. 1. Data acquisition and integration was performed using Sciex Analyst Software (version 1.7). Sample management and data processing were conducted in Watson® LIMS software (version 7.5).
Assay performance and validation
This bioanalytical method was fully validated according to the approved validation plan and relevant in-house SOP as well as the current regulatory guidance such as Chinese Pharmacopeia 9012 Quantitative Bioanalytical Method Validation Guidelines (2015) and US FDA Bioanalytical Method Validation Guideline for Industry (May 2018)(13,14) .
The quantitation limit of the assay (LLOQ) is the lowest concentration level of MK-7 that can be precisely and accurately detected. The deviation (%bias) must be within ±20 % or less, and the precision (%CV) must ≤ 20 %. The LLOQ of MK-7 for this method is 0·500 ng/ml. The inter-assay precision and accuracy of the MK-7 were evaluated by three assay batches at least two separate days using six levels of quality, namely QC, LLOQ, LQC, MQC, HQC, P-LQC and P-HQC (n 6). The deviation (%) must be within ±15 % or less (LLOQ QC, within ±20 % or less), and the precision (%) must ≤ 15 % (LLOQ QC, must ≤ 20 %) to be considered as acceptable.
The selectivity and specificity and matrix effect for this assay were modified from the guidance due to the fact that MK-7 is an endogenous analyte, and there is no such single donor control blank without MK-7 in it. Instead, the reproducibility of the six single donors at replicates of three were assessed. The %CV for each lot should be ≤ 15·0 %. For similar reasons, the recovery was evaluated in surrogate matrix only at the low, medium and high QC concentrations and the internal standard at the method working concentration. The relative recovery of the MK-7 was calculated based on the analyte peak area of the extracted test samples in matrix against extracted blank post-spiked with corresponding concentration of analyte and IS. There is no requirement for the percentage of recovery rate. However, the relative standard deviation for replicates at each concentration (pre-process and post-process) should be ≤ 15·0 %.
Various short-term and long-term matrix stability tests of MK-7 were conducted in two different matrices, that is, 4 % BSA in PBS buffer and human plasma. They are short-term matrix stability at room temperature, long-term matrix stability at −20°C and −80°C, and freeze-thaw at −80°C/RT for four cycles. Other miscellaneous tests conducted are batch-size, autosampler reinjection reproducibility and interference between MK-7 and MK-7-d7.
Clinical application
Ethics
The study protocol, subject information and informed consent forms (Chonggang General Hospital IRB No. 2020-LLPJ-003) were approved by the Institutional Review Board. The studies were conducted in compliance with Good Clinical Practice (GCP) as described in ICH (International Conference on Harmonization) E6. The studies followed the guidelines of the Declaration of Helsinki. All participants were given written and oral information about the study and signed a consent form before inclusion in the study.
Study design
Open, randomised, single-period, single-dose studies were designed to be conducted in male healthy subjects under fasting conditions. Healthy males aged 18–45 years with a BMI of 19 ≤ BMI ≤ 26 kg/m2 were recruited from the community. Exclusion criteria were coagulation disorders, metabolic or gastrointestinal diseases, chronic inflammatory diseases, medication that interferes with vitamin K2 and/or coagulation metabolism, use of supplements containing vitamin K2, participation in a clinical trial 3 months prior to this study, and soya allergy. All volunteers were non-smokers and were judged to be healthy by a medical history, a physical examination, electrocardiogram, and laboratory tests (including routine hematologic, serum biochemistry analyses and urinalysis) before entering the study. Randomisation of subjects was performed using an SPSS 26.0 (IBM Co.) random function by screening numbers. Five subjects in Study I were assigned random numbers Y001–Y005, and twelve subjects in Study II were assigned random numbers X001–X012. To minimise the impact of exogenous VK2 consumption on measured MK-7 concentrations, all eligible subjects were given a restricting VK2 diet (< 2·4 μg VK2 per 100 g of food) for 4 days prior to drug administration and during the entire study. A single dose of MK-7 tablet (Sungen Biotech Co., Ltd, daily dose of 1 mg) was administered to each subject under fasting conditions. All subjects received the same meals and dinner daily. Blood samples (6 ml) were collected in Monovette tubes containing K2EDTA.
Study I was designed as an exploratory pilot study to investigate baseline levels and circadian rhythm of endogenous MK-7 and to determine whether there is a circadian rhythm in individuals as VK1 (Reference Klapkova, Cepova and Dunovska6,Reference Kamali, Edwards and Wood15–Reference Piccione, Assenza and Grasso17) . Based on these exclusion criteria and a previous health check, five volunteers were selected for this intervention study. There were no participant dropouts during the period of the study. Blood (about 6 ml) was taken to prepare plasma before the administration of MK-7 at the following time points (t = –48 h, –42 h, –36 h, –30 h, –24 h, –18 h, –12 h, –6 h, 0 h) and at 2 h, 3 h, 3·5 h, 4 h, 4·5 h, 5 h, 5·5 h, 6 h, 6·5 h, 7 h, 7·5 h, 8 h, 12 h, 24 h, 48 h and 72 h after administration.
Study II was conducted to investigate bioavailability of MK-7. The blood collection point was adjusted based on the results of Study I, and the baseline deduction strategy was confirmed based on the evaluation of Study I. Twelve male participants were qualified and enrolled. There were no participant dropouts during the period of the study. Blood samples (about 6 ml) were collected before dosing administration at baseline (t = –24 h, −18 h, −12 h, −6 h, 0 h) and at 3 h, 4 h, 5 h, 5·5 h, 6 h, 6·5 h, 7 h, 9 h, 12 h, 24 h, 48 h, 72 h, 96 h and 120 h post-dose.
Statistical analysis
DAS 3·3·1 (BioGuider Co.) and SPSS 26.0 (IBM Co.) were used for statistical analysis. Descriptive statistics were performed to evaluate demographic data from the subjects as well as all MK-7 PK parameters. ANOVA was performed on the log-transformed Cmax, AUC0-t and AUC0-∞ to evaluate the PK parameters of the formulations. For Tmax, descriptive statistics was applied. The correlation between TAG and AUC0-t was estimated using linear regression analysis. Statistical significance was defined as a P value of 0·05.
Results
Surrogate matrix and linear range
Because MK-7 is an endogenous vitamin which is already present in blank human plasma, it cannot be used to prepare standard calibration curves directly in LC-MS/MS method. The first step developing a method to quantify endogenous analyte MK-7 is to search for a suitable surrogate matrix. The initial approach was to use blank plasma exposed under UV light for photodegradation at room temperature based on the publication(Reference Gentili, Cafolla and Gasperi18). However, it was found that the amount of the MK-7 in the blank plasma varies from lot to lot, and it is also age-dependent. Some lots had trace amounts of MK-7 still detectable after a 2-day exposure under UV light at room temperature. It was also noticed that the fresher the plasma lot, the more the amount of MK-7 remained. Because the plasma may deteriorate during this process and is time-consuming to screen for a ‘clean’ lot, 4 % BSA in PBS buffer was used as surrogate matrix in this method.
Several factors were taken into consideration for the calibration linear range for this assay, and one of them is the endogenous level of MK-7 in human plasma. Endogenous levels of MK-7 were reported previously for populations in Europe, USA and Japan. It was found that the dietary intake of MK-7 is low in Europe and the USA but high in Japan because of the intake of natto which is rich in MK-7(Reference Dunovska, Klapkova and Sopko12,Reference Booth and Suttie19–Reference Tsugawa, Shiraki and Suhara22) . Unfortunately, there is no report for Chinese population. Anticipating that the baseline may be slightly lower than Japanese data but higher than the European data, the linear range for the assay was set at 0·5–40 ng/ml.
Sample clean-up procedure
Commonly used extraction approaches for LC-MS/MS assay are PPE, LLE and SPE in which the former is fast but non-selective and the latter is selective but costly. Because, the demand for ultra-low detection limit in order to reach the desirable LLOQ orthogonal extractions such as two- or three-dimensional extractions had been used in the previous methodologies, that is, the Suhara and Dunovska methods (combination of PPE + LLE + SPE)(Reference Suhara, Kamao and Tsugawa10,Reference Dunovska, Klapkova and Sopko12) , the Riphagen method (combination of PPE + SPE)(Reference Riphagen, van der Molen and van Faassen11). We quickly recognised that these methods were very labour-intensive and deemed not suitable for the intended application in which thousands of samples will need to be analysed. Therefore, the focus was switched to optimise an LLE-only extraction condition. LLE is simple, quick and cost-efficient and the most suitable extraction approach for non-polar analyte like MK-7. Different solvents such as hexane, ethyl acetate and methyl tert-butyl ether under various pH conditions were explored. It was found that methyl tert-butyl ether under neutral condition yielded the highest extraction recovery. Because of the requirement of 0·5 ng/ml LLOQ, it was unavoidable to use relatively large sample volume, that is, 400 μl, for this method.
LC-MS/MS optimisation
MK-7 is the one of the most non-polar compounds among vitamin K analogues. Reversed phase chromatography such as C8 or C18 column had been chosen to retain MK-7 with high organic solvent composition initially. However, it always co-elutes with phospholipids which are the major contributors for matrix effect for LC-MS/MS assay. In order to separate interfering peak, the elution gradient programme had to be extended (> 10 min) which prohibited us to choose this option. Non-aqueous reversed phase chromatography has been used for separating lipophilic compounds such as fat-soluble vitamins and oils in the past. In 2014, Gentili et al. reported a LC-MS/MS method to simultaneously quantify vitamin K1, menaquinone-4 and vitamin K1 2, 3-epoxide using MeOH as weak mobile phase and IPA/hexane (50/50 v/v) as strong mobile phase(Reference Gentili, Cafolla and Gasperi18). Adapted from the methods used to separate the most non-polar compounds(Reference Gentili, Cafolla and Gasperi18), a 2 × 50 mm C18 column and 4·5 min LC gradient were selected to elute out MK-7 at 1·8 min and forward flush the column for 1·4 min. IPA/hexane (50/50 v/v) is commonly used as strong wash solvent for column regeneration and maintenance in laboratory. Using it as strong mobile phase, it virtually guarantees washing out all interfering lipids or any retentive endogenous compounds after each analysis. Consequently, a single C18 column lasted an entire study over without peak deterioration or increased back pressure.
To optimise the parameters for the triple quadruple mass spectrometer, neat solutions containing 500 ng/ml of MK-7 and MK-7-d7 in 50/50 water/MeCN solvent were directly infused into the MS. Both ESI and APCI sources have been used in previously published methods(Reference Suhara, Kamao and Tsugawa10–Reference Dunovska, Klapkova and Sopko12). Although both sources produced the same precursor and product ions, that is, 649·5→187 for MK-7 and 656·4→194·1 for MK-7-d7, respectively, the instrument responses of the multiple reaction monitoring transitions for MK-7 and IS were higher using APCI source. The product spectra and the chemical structures of MK-7 and MK-7-d7 can be found in Fig. 1.
Assay precision and accuracy
Eight calibration standards, 0·500, 1·00, 2·00, 5·00, 12·0, 20·0, 36·0 and 40·0 ng/ml, were prepared in 4 % BSA in PBS buffer. Back-calculated concentration of the standards with a linear 1/×2 weighted regression model can be found in Table 1. The coefficient of determination (r2) was > 0·9922 for all validation batches. The accuracy and precision of the assay were assessed by analysing six replicates of the six levels of QC samples at LLOQ (0·500 ng/ml), LQC (0·500 ng/ml), MQC (16·0 ng/ml), HQC (32·0 ng/ml), P-LQC (5·96 ng/ml) and P-HQC (33·4 ng/ml) in three different runs at three different days. For the two levels of plasma QC, P-LQC and P-HQC, the mean observed concentrations, 5·96 ng/ml and 33·4 ng/ml, respectively, were obtained from the three precision and accuracy runs, and it is used as theoretical concentration (T0) for short-term and long-term stability evaluation. A summary of inter- and intra-assay precision and accuracy for MK-7 in human plasma is presented in Table 2. The inter-assay (%Bias), inter-assay precision (%CV) and intra-assay precision (%CV) are −3·8 to 0·7, 8·8 and 8·1, respectively. The representative chromatograms of control blank (BSA), Standard 1 (LLOQ, BSA), LQC (human plasma, no fortified MK-7) and study sample can be found in Fig. 2.
Table 1. The back-calculated concentration of the standard curves of the inter-assay precision and accuracy batch

Table 2. Summary of inter- and intra-assay accuracy and precision of for MK-7 in BSA and human plasma
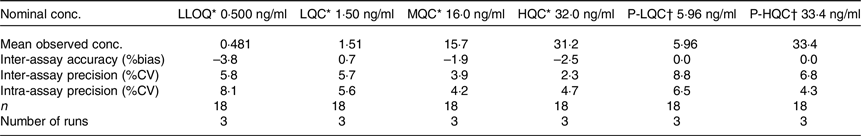
BSA, bovine serum albumin; MK-7, menaquinone-7.
* Analytical QC prepared in BSA.
† Analytical QC prepared in human plasma.
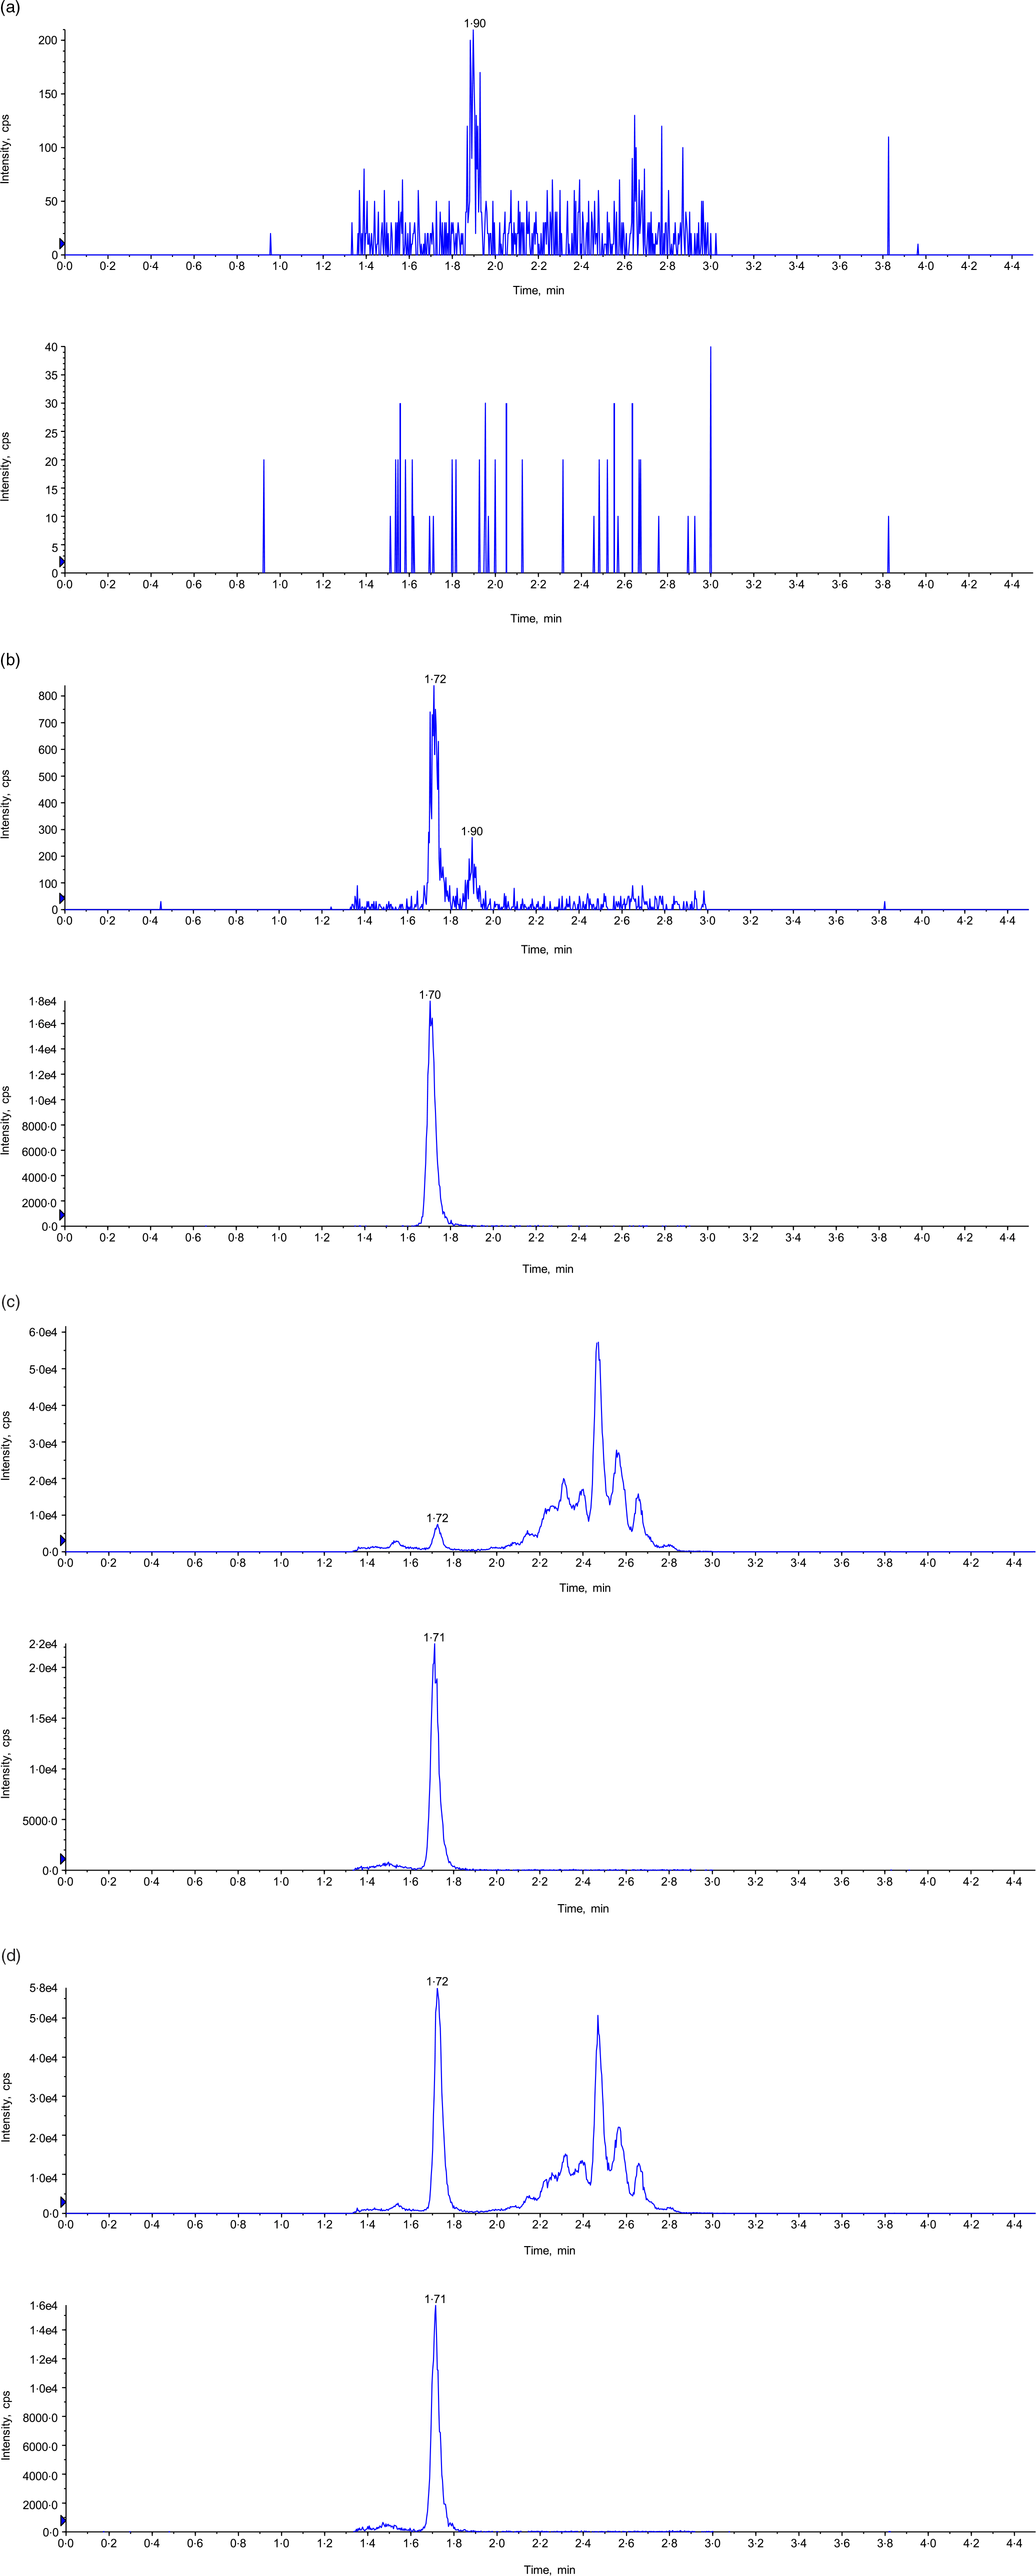
Fig. 2. Representative chromatogram. (a) Control blank in 4 % BSA in PBS buffer (top: MK-7; bottom: MK-7-d7); (b) LLOQ in human plasma (top: MK-7; bottom: MK-7-d7); (c) P-LQC in human plasma (top: MK-7; bottom: MK-7-d7); and (d) incurred samples at 5 h time point (top: MK-7; bottom: MK-7-d7). BSA, bovine serum albumin; MK-7, menaquinone-7.
Short-Term and long-term plasma stability
Because standard and QC samples were prepared in two different matrices, it is necessary to demonstrate matrix stability in both matrices. Therefore, LQC, HQC, P-LQC and P-HQC were used for the evaluation of various matrix stability, and the results are shown in Table 3. For freeze-thaw stability test, the stability samples were stored at −80°C and tested for four cycles. For each freeze-thaw cycle, the samples were frozen up to 12 h in between and thawed at least 0·5 h and by the same procedure as is used for study samples (i.e. thawing, vortex mixing, uncapping and capping). The observed %theoretical (stability) was found from 90·3 to 103·9 %. For short-term bench-top stability, the QC samples were kept on the bench for 8·5 h at room temperature followed by extraction analysis. The observed %theoretical (stability) was found from 88·1 to 99·4 %. Long-term matrix stability was conducted by analysing these QC after stored at −20°C and −80°C for 36 d and 42 d. The observed %theoretical (stability) was found from 88·8to 100·0 % and 87·8 to 106·0 %.
Table 3. Summary of stability assessment results for MK-7 in BSA and human plasma
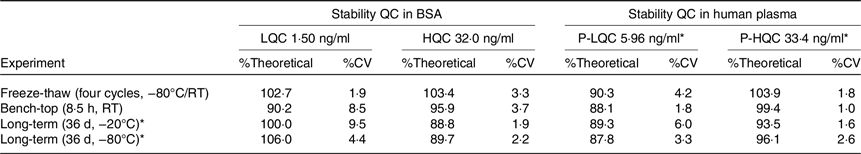
BSA, bovine serum albumin; MK-7, menaquinone-7; QC, quality control.
* Stability for PQC at −20°C and −80°C are 42 d.
Matrix effect assessment
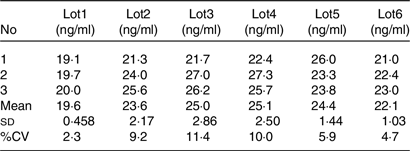
As an endogenous substance, the MK-7 concentration varies from lot to lot. It would fail the traditional matrix factor experiment elucidated in the regulatory guidance, for it requires the CV of the normalised matrix factor of the six different lots must be < 15 %. For endogenous substance LC-MS/MS bioanalytical assay, the consistency of the assay is more important for the purpose of the quantitation. Therefore, the CV of the intra-lot is more representative. The method matrix effect test of the assay was designed as follows: aliquot 400 μl of blank plasma from six individual donors (n 3 for each lot); add 20 μl of MK-7 working solution spike MK-7 at 30 ng/ml; the final concentration of each lots was (CP-LQCxVP-LQC + Cworking solution xVworking solution)/(VP-LQC + Vworking solution). In this formula, the CP-LQC is the endogenous concentration of the MK-7, VP-LQC is the volume of the blank matrix, Cworking solution is the concentration of the spiking solution and the Vworking solution is the volume of the spiking solution. As shown in Table 4, the CV of lots 1–6 were 2·3 %, 9·2 %, 11·4 %, 10·0 %, 5·9 % and 4·7 %, respectively, suggesting this assay is very robust and reproducible.
Table 4. Assay selectivity and reproducibility
Circadian rhythm pattern and endogenous level
After pre-screening, a panel of five male volunteers took part in this study. Their mean age was about 25 years, and their BMI was 21·058 kg/m2 (Table 5). All participants were apparently healthy, and their baseline lipid profiles and endogenous MK-7 level were shown in Table 5. Several studies have been carried out on the temporal changes of fat-soluble vitamins in humans, including vitamin K1, revealing the existence of a circannual and a circadian pattern(Reference Klapkova, Cepova and Dunovska6,Reference Kamali, Edwards and Wood15–Reference Piccione, Assenza and Grasso17,Reference Singh, Niaz and Cornelissen23) . Given the lack of experimental studies on the rhythmic pattern of vitamin K2, the baseline concentration of MK-7 obtained during 2 days pre-dosing period indicates that there is no daily rhythm of circulating MK-7 in human as shown in Fig. 3(a).
Table 5. Baseline and demographic characteristics of subject in Study I (n 5)

* BMI = weight (kg)/height (cm)2.
† With restriction of intake of exogenous VK2, the average of nine baseline PK sampling time point; results are given as Mean ± sd.
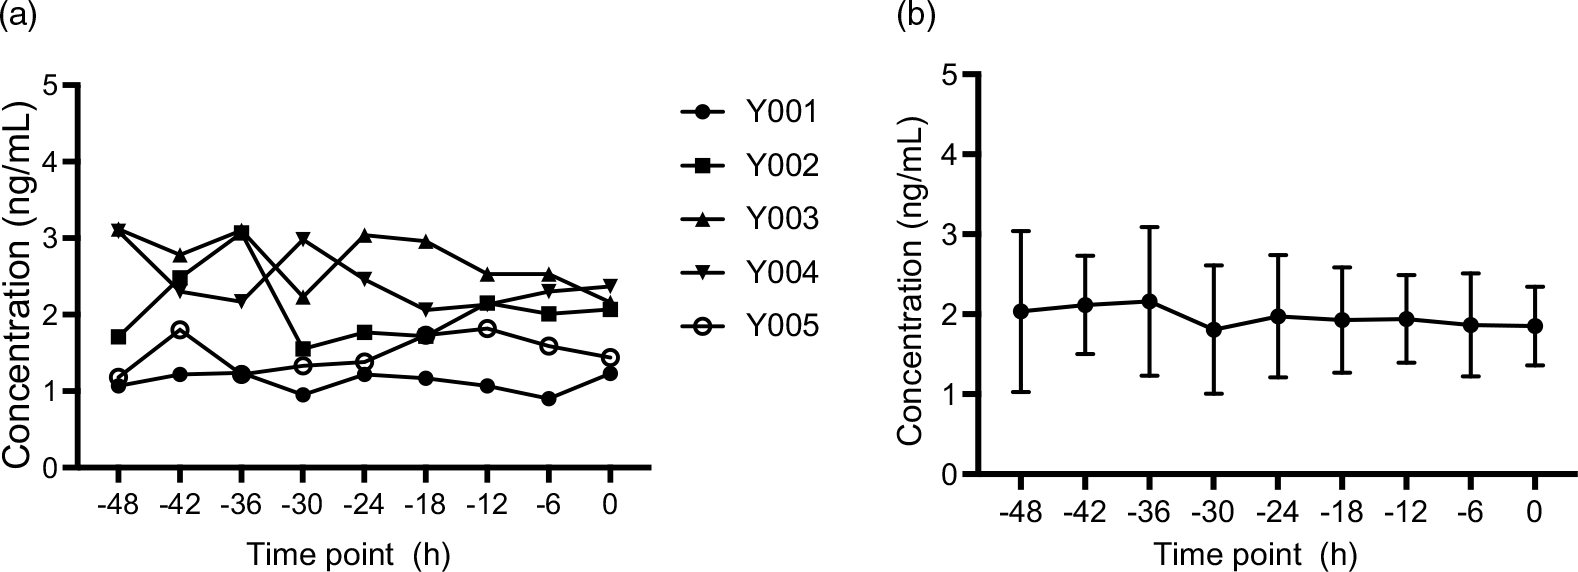
Fig. 3. Plasma concentration–time profiles of endogenic MK-7 baseline levels (Study I). (a) Plasma concentration–time profiles for each subject and (b) mean plasma concentration–time profiles for all individuals, and the error bars refer to the standard deviation of the concentration values at each time point. MK-7, menaquinone-7.
In order to accurately measure the endogenous level, plasma samples were collected from nine time points prior to dosing subjects. The average concentration of the endogenous concentration of MK-7 is approximately 2·00 ng/ml shown in Fig. 3(b).
Blood collection point assessment
In Clinical Study I, the appropriate blood collection point was assessed in order to accurately measure the absorption and bioavailability of MK-7 in Study II. One milligram of MK-7 was ingested by five subjects, and blood was taken at the intervals described in section 2.5.2. Figure 4 shows the MK-7 concentrations v. Time, and Table 6 shows key pharmacokinetic values with endogenous baseline value deduction. Mean Tmax was about 6·5 h for MK-7, Cmax was about 17·2 ng/ml, AUC0-t was 353·432 hr*ng/ml and AUC0-∞ was 576·778 hr*ng/ml. Plasma concentration–time profiles exhibit a second peak about 24 h post-dosing. A possible explanation for this is that MK-7 is redistributed in peripheral tissues such as osteoblasts and adipose cells via LDL(Reference Shearer and Newman4,Reference Kamali, Edwards and Wood15,Reference Shearer and Newman24) . MK-7 is a fat-soluble vitamin that is absorbed from the intestine in the same way that most fat-soluble dietary vitamins are. In the presence of bile salts, MK-7 is absorbed from the small intestine and transported to the liver via chylomicron. The liver is the primary storage site for MK-7. However, the longer isoprenoid residue chains of MK-7 are redistributed peripherally(Reference Piccione, Assenza and Grasso17,Reference Shearer and Newman24) . Although the available blood collection points to 72 h do not allow accurate half-life time assessment, the elimination of MK-7 from plasma was slow with an elimination half-life (t1/2) of about 3 d, which is consistent with its reported very long half-life time of MK-7.
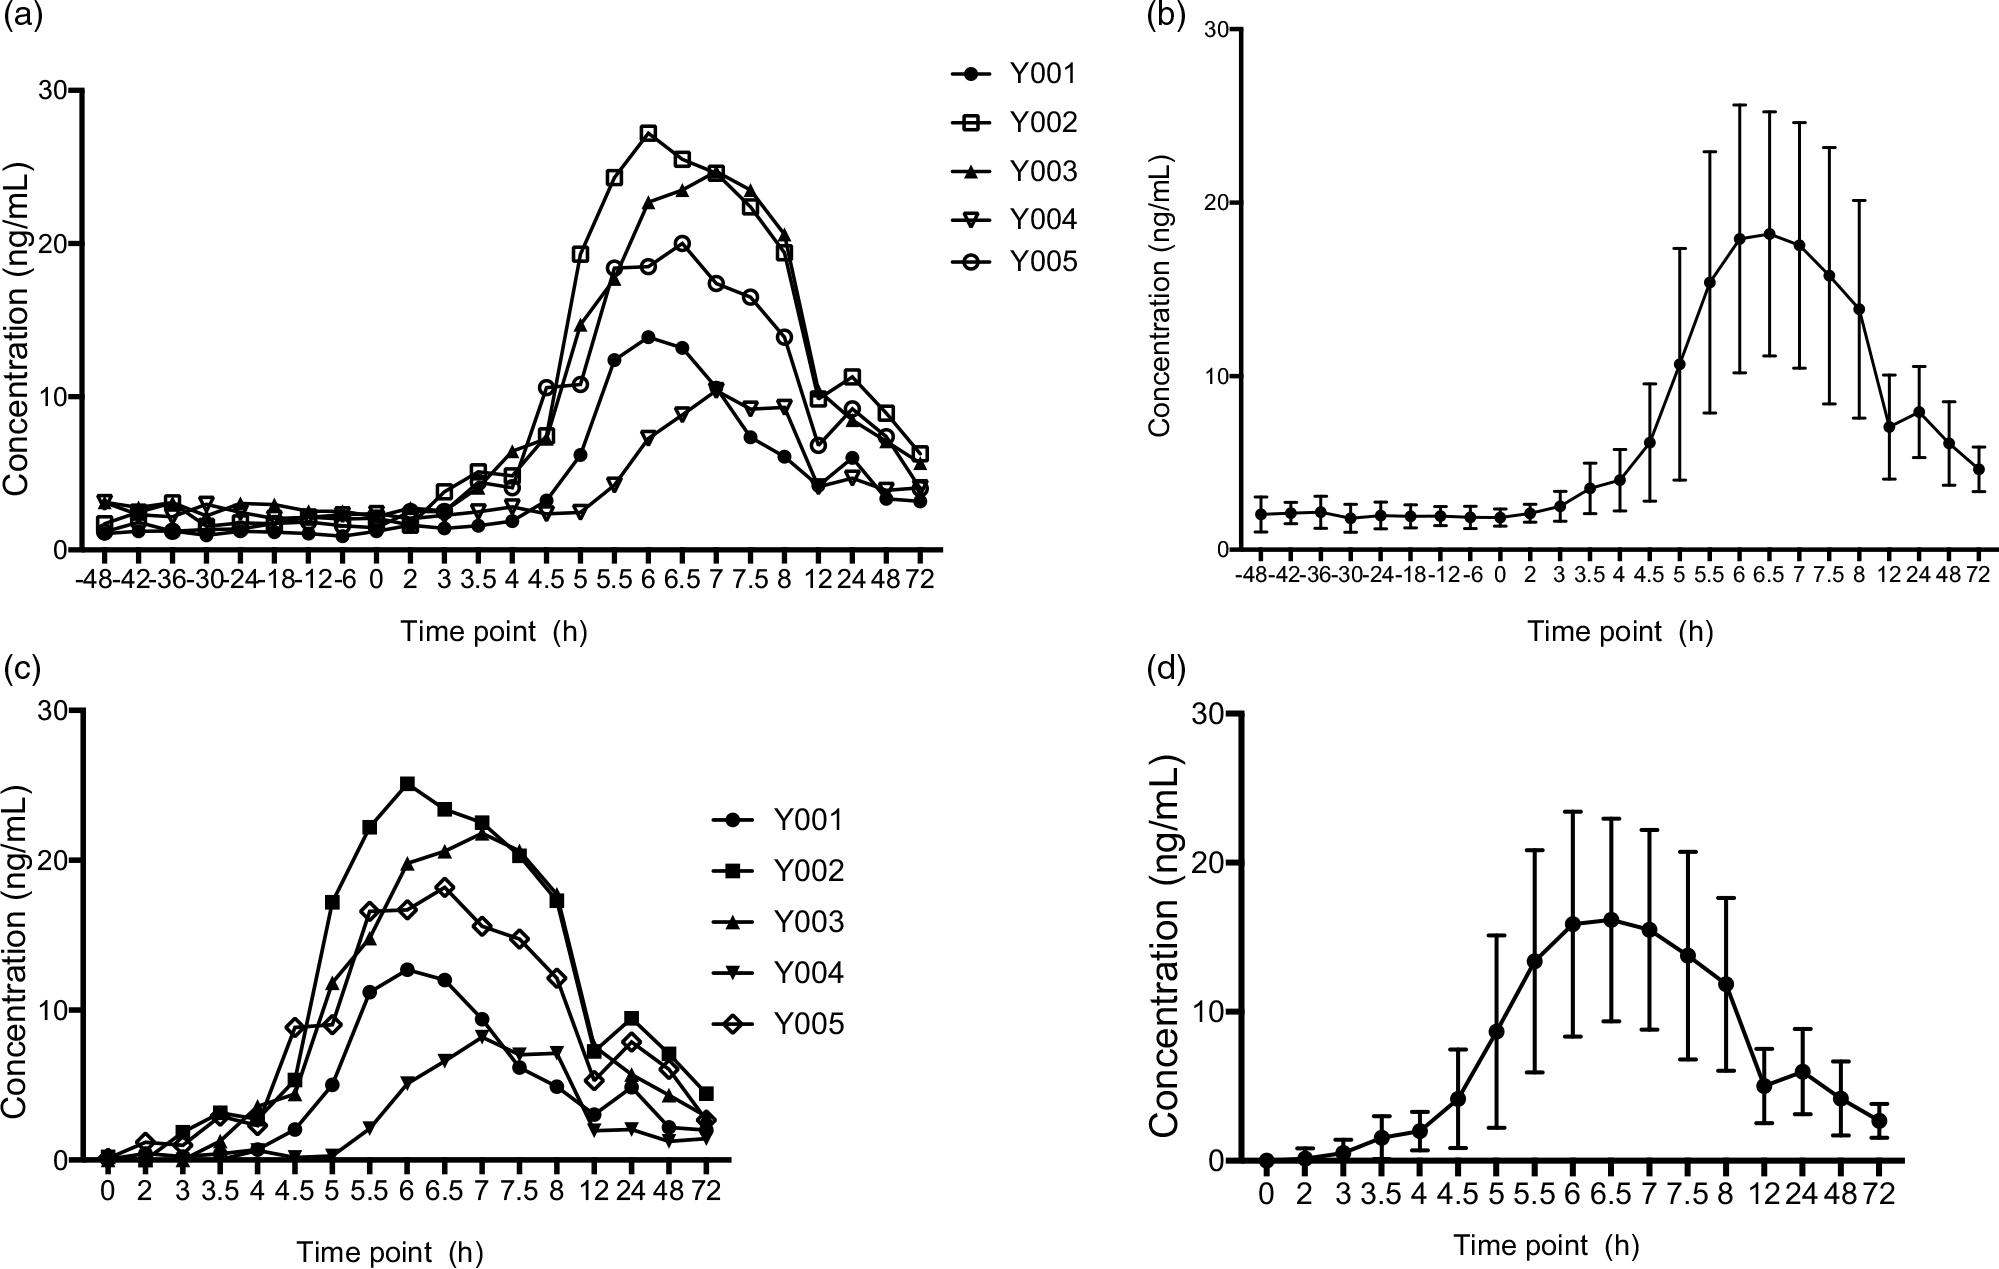
Fig. 4. Plasma concentration–time profiles of MK-7 (Study I). (a) Plasma concentration–time profiles (endogenous baseline values were not deducted) for each subjects; (b) mean plasma concentration–time profiles (endogenous baseline values were not deducted) for all individuals, and the error bars refer to the standard deviation of the concentration values at each time point; (c) Plasma concentration–time profiles (2 d baseline values were deducted relative to the same time points after MK-7 administration) for each subjects; and (d) mean plasma concentration–time profiles for all individuals (endogenous baseline values were deducted), and the error bars refer to the standard deviation of the concentration values at each time point. MK-7, menaquinone-7.
Table 6. Pharmacokinetic (PK) parameters in Study I

AUC0-t, area under the plasma concentration time curve from time 0 to last measurable concentration; AUC0-∞, area under the plasma concentration time curve up to infinity; Cmax, maximum plasma concentration; Tmax, time to Cmax; T1/2, terminal elimination half-life.
Bioavailability
Based on Study I and a previous publication, the intrasubject variability of Cmax > 30 % was considered using at least twelve subjects that were selected to the bioavailability study.(Reference Zhang, Bala and Mao5,Reference Klapkova, Cepova and Dunovska6) . Twelve subjects satisfied the eligibility criteria and agreed to participate in the bioavailability study, and all subjects completed the protocol. Characteristics of all participants included in Study II are presented in Table 7, which mean age was 32·75 years and BMI was 24·318 kg/m2. Their baseline lipid profiles and endogenous MK-7 level were also shown in Table 7. One milligram of MK-7 was administered to all the participants as a single oral dose. After subtracting the baseline levels from average of all values pre-administration, the pharmacokinetic parameters were summarised in Table 8. The AUC of plasma MK-7 levels was taken as a measure for absorption and bioavailability. Two more blood collection time points, 96 h and 120 h, were added to ensure AUC0-t is more than 80 % of the AUC0-∞. Mean AUC0-t was 504·207 hr*ng/ml, and AUC0-∞ was 812·067 hr*ng/ml. As is demonstrated in Fig. 5, the time-to-peak was about 6·3 h, and a second peak also showed about 24 h post-dosing. Mean Cmax was expressed as the highest concentration which was 24·852 ng/ml.
Table 7. Baseline and demographic characteristics of subject in Study II (n 12)
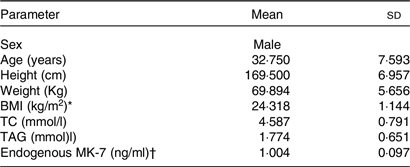
* BMI = weight (kg)/height (cm)2.
† With restriction of intake of exogenous VK2, the average of five baseline PK sampling time point. Results are given as Mean ± sd.
Table 8. Pharmacokinetic (PK) parameters in twelve subjects (Study II)

AUC0-t, area under the plasma concentration time curve from time 0 to last measurable concentration; AUC0-∞, area under the plasma concentration time curve up to infinity; Cmax, maximum plasma concentration; Tmax, time to Cmax; T1/2, terminal elimination half-life.
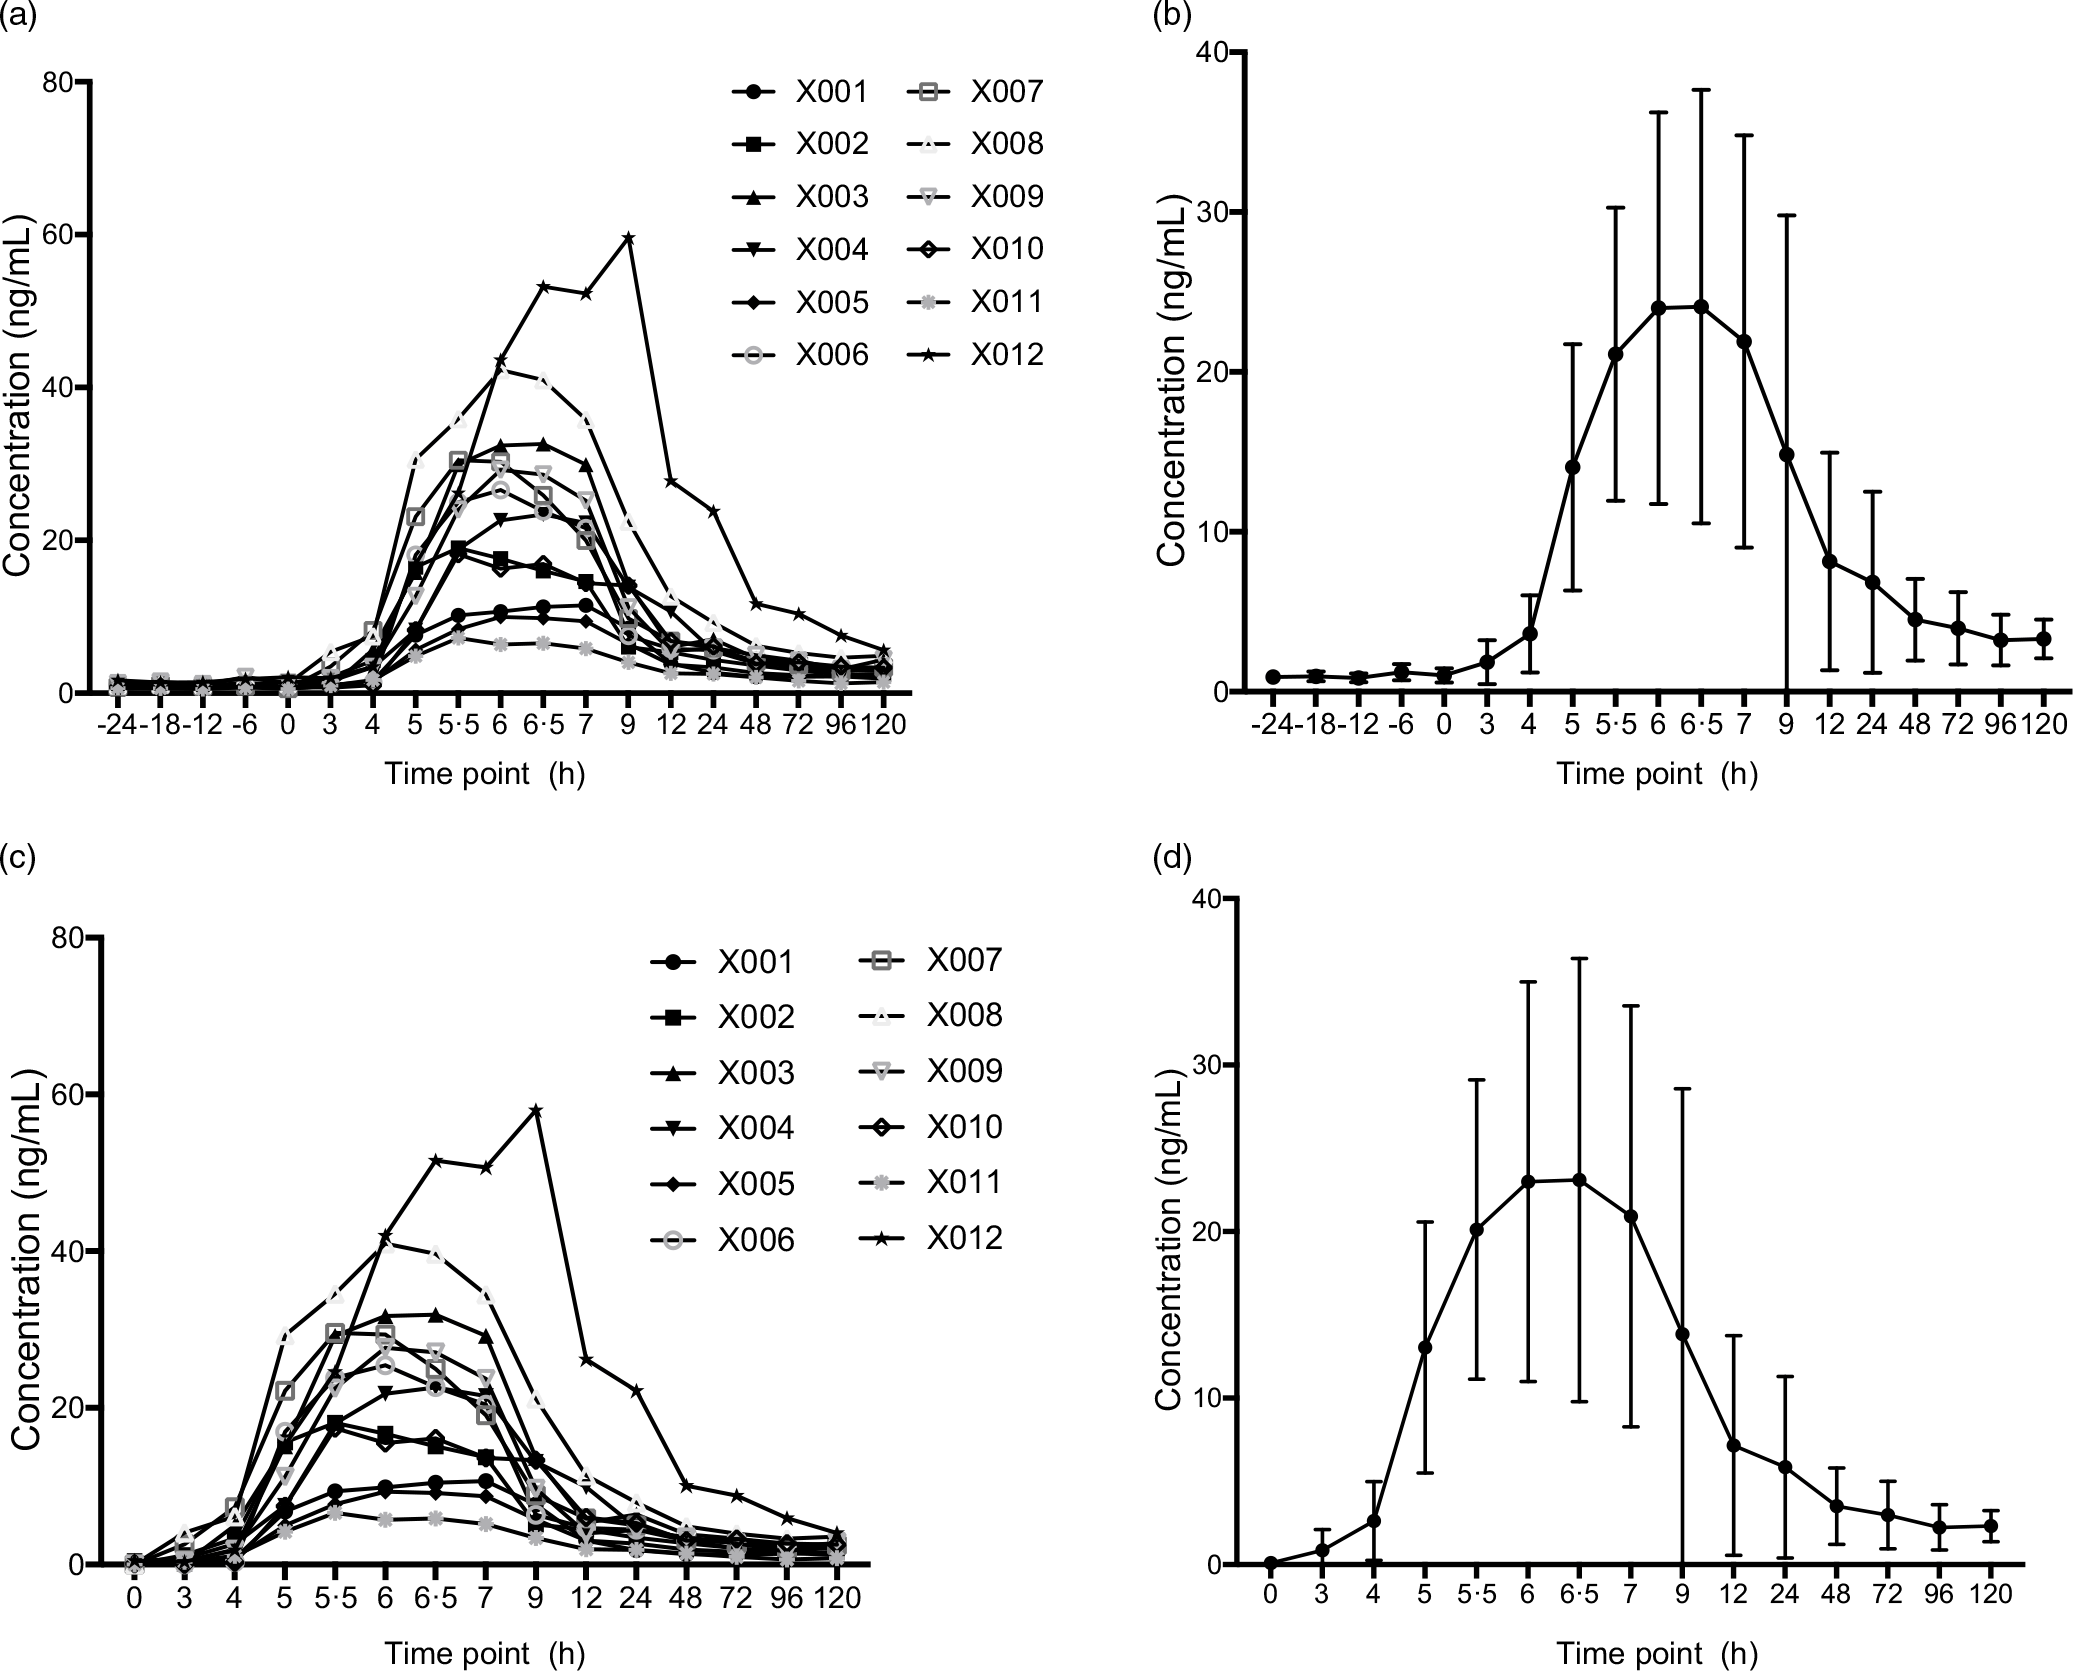
Fig. 5. Plasma concentration–time profiles of MK-7 (Study II). (a) Plasma concentration–time profiles (endogenous baseline values were not deducted) for each subjects; (b) mean plasma concentration–time profiles (endogenous baseline values were not deducted) for all individuals, and the error bars refer to the standard deviation of the concentration values at each time point; (c) plasma concentration–time profiles (average of 1 d endogenous baseline values were deducted) for each subjects; and (d) mean plasma concentration–time profiles for all individuals (endogenous baseline values were deducted), and the error bars refer to the standard deviation of the concentration values at each time point. MK-7, menaquinone-7.
Discussion
MK-7, currently a commercially available vitamin K2, has been approved as a dietary supplement and food additive by the European Food Safety Authority (EFSA)(25,Reference Bresson, Flynn and Heinonen26) . China recognised vitamin K2 as a nutritional fortification supplement that was included in the national Nutritional Fortification Catalog in 2016. Few clinical trials have explored the oral safe dose of MK-7. The US Pharmacopeia Convention has not specified the maximum tolerable dose of MK-7 in humans(Reference Marles, Roe and Oketch-Rabah1). Studies have shown that the oral lethal dose (LD 50) of MK-7 in mice is > 2000 mg/kg(Reference Pucaj, Rasmussen and Møller27). The minimum effective active dose of MK-7 of 45 μg/d in human has been reported(Reference Westenfeld, Krueger and Schlieper28). Previous human clinical trials have established no adverse events after dosing 1 mg of MK-7 in humans, and 1 mg can have physiological activity(Reference Bresson, Flynn and Heinonen26,Reference Schurgers, Teunissen and Hamulyák29) . Thus, 1 mg dose of MK-7 was selected for current studies.
The published endogenous level of MK-7 varies significantly from different countries and ethical groups, presumably due to the different diets in the population. In 2019, Dunovska et al. reported 0·074–0·759 ng/ml in Central European population(Reference Dunovska, Klapkova and Sopko12). In 2006, Tsugawa et al. analysed phylloquinone, MK-4 and MK-7 in premenopausal women and postmenopausal Japanese women(Reference Tsugawa, Shiraki and Suhara22). Japanese traditional meal ‘natto’ is rich in MK-7. As expected, the lowest endogenous MK-7 concentration is postmenopausal women (50–69 years, n 208), with concentration at 4·21 ± 6·81 ng/ml. So far, there is no report for endogenous MK-7 level in Chinese population. Based on thus current study, the average endogenous MK-7 concentration in healthy Chinese is approximately 2·00 ng/ml. Although only seventeen subjects were involved, the baseline concentration of MK-7 in Chinese population were first reported. One should note that this value was obtained after the subjects were enrolled into clinical centre and lived in subdue light and under restricted diet conditions. It may not represent the common population level in which the individuals live under regular living environments such as regular or white light condition and no control of diets.
Additionally, the circadian rhythm pattern of MK-7 was studied, and our data showed that MK-7 did not have the circadian rhythm as VK1. The potential explanation is the difference in function and structure between vitamin K1 and MK-7. Literature searching show limited report regarding rhythmic pattern of MK-7. As a long-chain menaquinone, the lipophilic character of MK-7 substantially increases at increasing chain length, and this may have consequences for tissue storage and longer biological half-life time. Vitamin K1 had virtually disappeared from the circulation after the overnight period, but the clearance of MK-7 was remarkably slower, led to the stable levels of MK-7. As for bioavailability, the present results also demonstrated that circulating MK-7 plots as a function of time. The peak values were seen at approximately 6–7 h after drug administration, followed by a rapid decline, and the second peak values were seen at 24 h. MK-7 was biphasic and slow between 12 and 72 h. Consistent with the literature, high intrasubject CV of MK-7 between individuals was found in this present study(Reference Knapen Mhj, Vermeer and Lajlm16,Reference Sato, Inaba and Yamashita30) . The mechanisms influencing MK-7 bioavailability are complicated, with drug dissociation degree and lipid solubility being the most important. Furthermore, gastric emptying rate, fatty acid type and individual variables such as age, sex and genetic factors may all have an impact on absorption(Reference Sato, Inaba and Yamashita30).
As part of method robustness assessment, after the initial sample analysis of the clinical samples, ninety-four samples were selected for incurred sample reanalysis for Study II clinical study. For ISR selection, samples with initial concentration less than LLOQ samples (BLOQ) and less than three times of the LQC (1·5 ng/ml) were excluded. The ISR is considered acceptable only if 2/3 of the differences between initial concentration and the mean of the initial and repeat concentrations must be within ±20 %. As shown in Supplement Table 2, ninety out of ninety-four samples met the above acceptance criteria, further demonstrating the robustness of the current assay method.
Acknowledgement
This study is supported by National Natural Science Foundation of China (81901427) and Natural Science Foundation of Chongqing Municipal Science and Technology Bureau (cstc2019jcyj-msxm1819).
Data curation, investigation and writing-original draft were performed by F. D., M. Y., L. D., G. X., X. Y. and W. H. Formal analysis were performed by Y. L.. D. S., M. M. and J. C. contributed to the study conceptualization and superbision, methodology, and writing-review & editing, interpretation of results, and writing and reviewing of the manuscript.
The authors declare that they have no conflict of interest.
Supplementary material
For supplementary material/s referred to in this article, please visit https://doi.org/10.1017/S0007114523001034


