


Vitamin K is an essential micronutrient in humans and represents a group of fat-soluble structurally related compounds that occur naturally as phylloquinone (vitamin K1) and menaquinones (vitamin K2). Both forms have a common 2-methyl-1,4-naphthoquinone ring structure, known as menadione, which constitutes the functional group. However, they exhibit disparities in their respective side chains, wherein phylloquinone (PK) is connected to a phytyl group, whereas the side chains of menaquinones are composed of a varying number of unsaturated isoprene units (MK-n), where MK-4 to MK-13 have been identified(1,Reference Booth2) . PK is synthesised by plants and has historically been considered the predominant dietary form of vitamin K. Dietary sources include green, leafy vegetables and certain plant-derived oils, such as rapeseed and olive oils(Reference Palmer, Koch and Shinde3–Reference Palmer, Blekkenhorst and Lewis5). Most MK are formed as a result of bacterial fermentation or by the intestinal microbiota; there is however limited understanding of the extent to which gut bacterial production contributes to human vitamin K status(1,Reference Lyytinen and Linneberg6) . Thus, the main sources of MK include foods of animal origin and foods altered by bacterial fermentation, such as fermented foods, meat and meat products and dairy products(Reference Booth2,Reference Palmer, Koch and Shinde3,Reference Tarvainen, Fabritius and Yang7,Reference Vermeer, Raes and van ’t Hoofd8) . During absorption in the intestines and subsequent uptake in the organs of animals, MK-4 is the only unsaturated isoprene unit metabolically converted from PK and possibly other MK(Reference Shearer and Newman9–Reference Okano, Shimomura and Yamane11).
Vitamin K is predominantly known for its role as a cofactor in the activation of vitamin K-dependent proteins, also known as Gla-proteins, in various tissues(1,Reference Lyytinen and Linneberg6) . These Gla proteins are involved in a variety of physiological processes, including blood coagulation, bone mineralisation and the inhibition of vascular calcification and corresponding reduction of cardiovascular risk(Reference Vermeer12–Reference Halder, Petsophonsakul and Akbulut15). Currently, seventeen different Gla-proteins are recognised, several with yet unknown functions, suggesting that even more vitamin K-dependent functions may be revealed in the future(Reference Vermeer12). Most of our current understanding of vitamin K pertains to PK. However, several studies suggest that MK may have functions unrelated to PK intake and, for some health effects, may have greater bioactivity than PK(Reference Beulens, Booth and van den Heuvel14–Reference Walther, Karl and Booth17). The uncertainties are acknowledged in the current adequate intake (AI) of 1 µg PK per kg body weight per day for all age and sex groups set by the European Food Safety Authority (EFSA)(1). This AI is exclusively related to PK’s function in haemostasis and has remained unchanged since it was first introduced in 1993 by the former Scientific Committee for Food(1).
Food composition data on vitamin K, and particularly MK, are limited in most countries(1,Reference Palmer, Koch and Shinde3,Reference Lyytinen and Linneberg6,Reference Beulens, Booth and van den Heuvel14) . The MK and PK contents of many foods remain unknown, and the lack of comprehensive food composition data severely limits further research on the associations between vitamin K intake and health(Reference Palmer, Blekkenhorst and Lewis5,Reference Lyytinen and Linneberg6,Reference Walther, Karl and Booth17) . In its 2017 report, EFSA highlighted the need for more extensive and precise analytical data on PK and MK in foods to elucidate their specific biological role and establish corresponding dietary reference values(1). This request was also emphasised in the Nordic Nutrition Recommendations 2023(Reference Blomhoff, Andersen and Arnesen18). Similarly, in 2018, the Norwegian Scientific Committee for Food and Environment(19) expressed the need to acquire and incorporate data on PK and MK in the Norwegian food composition database, which currently lacks data on vitamin K(20). Existing studies have investigated the contents of PK and MK in foods such as dairy products, particularly cheeses and fermented foods(Reference Tarvainen, Fabritius and Yang7,Reference Vermeer, Raes and van ’t Hoofd8,Reference Manoury, Jourdon and Boyaval21–Reference Fu, Harshman and Shen23) . However, the content of vitamin K in many foods remains unknown(Reference Walther, Karl and Booth17). As a food group, shellfish comprise a diverse range of species and are considered particularly nutrient-dense(Reference Venugopal and Gopakumar24,Reference Moxness Reksten, Wiech and Aakre25) . Nevertheless, to our knowledge, their vitamin K content has not been extensively evaluated. The objective of this study was therefore to quantify the contents of PK and MK (MK-4 to MK-10) in various shellfish species. By doing so, we aimed to contribute valuable data and knowledge on vitamin K food composition, thereby enhancing the understanding of vitamin K. We also aimed to assess the potential contribution of PK from shellfish to the AI for adults and explore seasonal differences in the content of vitamin K in blue mussels.
Methods
Sampling
A total of 323 samples of shellfish were collected between 2020 and 2023 from Norwegian supermarkets, fish markets, national monitoring programmes, surveys along the coast of Norway and from local fishermen. An overview of the samples, including processing methods and sampling locations, is provided in Table 1, whereas a more detailed overview is provided in the online Supplementary material (Appendix 1). Samples collected from supermarkets were purchased during the autumn of 2020 and 2021 from local supermarkets and fish markets in and around Bergen, Norway. These products reflect the shellfish products available to Norwegian consumers during the autumn of 2020 and 2021, as all shellfish products and product ranges available at the time were purchased for analysis. Three different samples were collected from various batches, per product, per year. Additionally, some samples of bivalves (blue mussels and scallops, n 56) were collected through the Norwegian Food Safety Authority’s yearly monitoring programme on contaminants and microorganisms in bivalves in 2023(26). Of these, the blue mussel samples were evaluated in terms of seasonal variations. Moreover, samples were collected using research vessels from various locations along the west coast of Norway in 2021, as part of projects carried out by the Institute of Marine Research (IMR). Samples of crustaceans (shrimps, crabs and lobsters) were collected from local fishermen in 2021 and delivered to the IMR from various locations around the west coast of Norway (as part of other projects at the IMR). The samples were processed to varying degrees, ranging from raw, boiled, steamed or immersed in brine. With the exclusion of bivalves collected from the 2023 monitoring programme, the methodology for sample preparation for all shellfish included in this study has been described previously(Reference Moxness Reksten, Wiech and Aakre25). Briefly, the samples were obtained through convenience sampling, where the samples were weighed and measured prior to homogenisation. Only the edible parts of the shellfish, such as the bivalve meat and the brown meat and claw meat of crustaceans, were used in the analysis. Most shellfish samples were analysed as composite samples consisting of a varying number of individuals; however, some samples of crustaceans were prepared as individual samples (Appendix 1). Bivalves collected from the 2023 monitoring programme were stored at –20°C after preparation, prior to analysis. The remainder of shellfish samples were stored at –80°C prior to analysis.
Table 1. Overview of the samples of shellfish included in this study
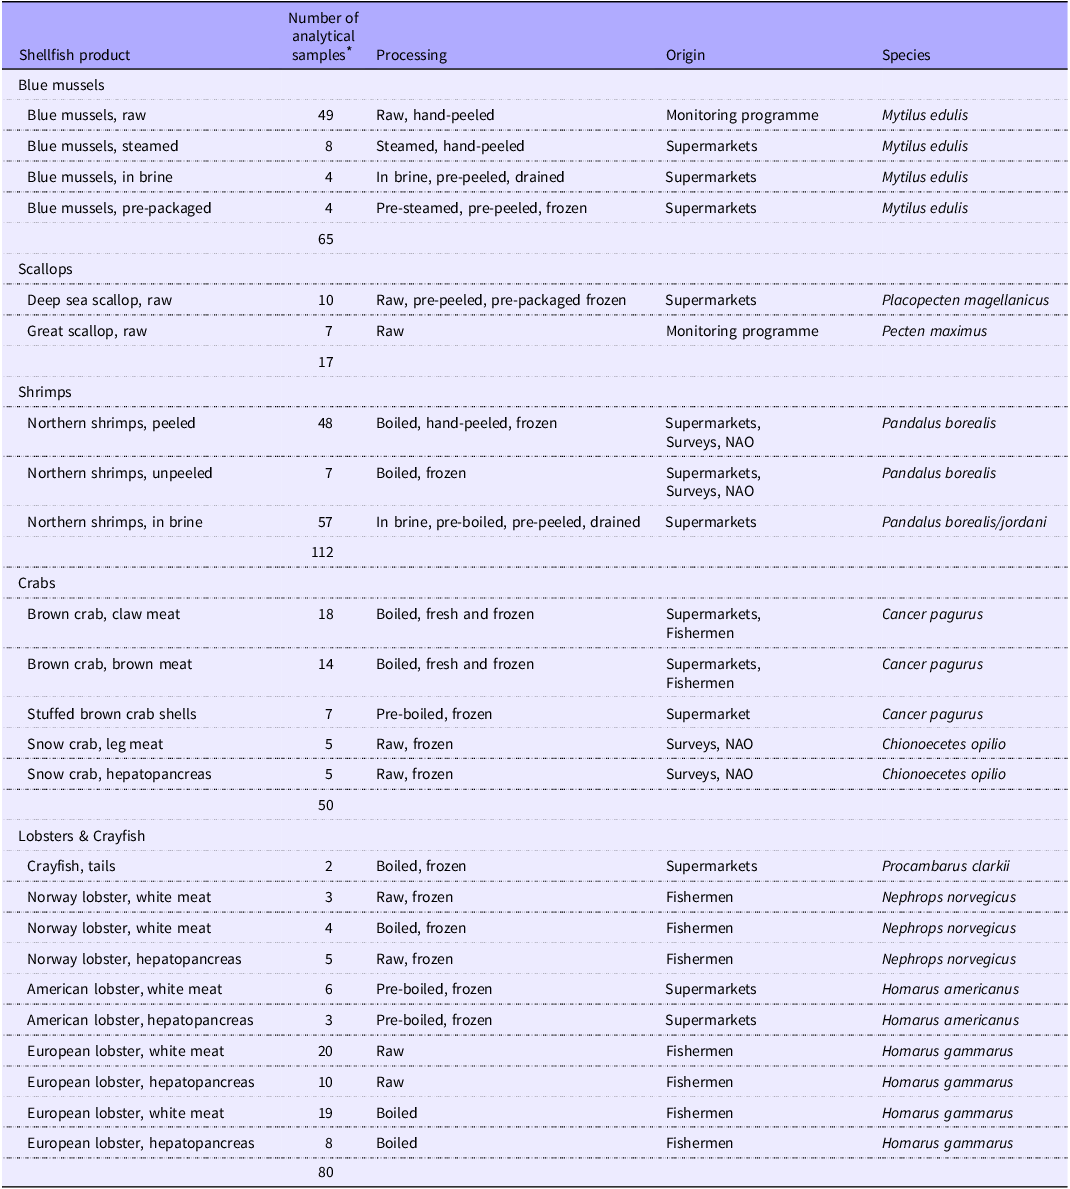
NAO, North Atlantic Ocean.
* Most shellfish products were analysed as composite samples consisting of a varying number of individuals. For a complete overview of the included samples, including the number of individuals per composite sample, see Table A.1, Appendix A.
Sample preparation: raw bivalves
For blue mussels (Mytilus edulis) sampled through the monitoring programme, twenty-five raw individuals comprised one composite sample, whereas for great scallops (Pecten maximus), ten raw individuals comprised one composite sample. The samples were rinsed with tap water before weight and length were measured, as described previously by Moxness Reksten et al. (Reference Moxness Reksten, Wiech and Aakre25). The shells were opened by cutting the adductor muscle with a knife, before being placed upright for drainage of water. The blue mussel meat was then manually scraped from the shells using a scalpel. For great scallops, the mantle, gills and digestive gland were removed prior to detaching the muscle from the shell. The bivalve samples were not further processed and were thus analysed in their raw state.
Analysis of vitamin K contents
Analytical quality
The analytical determination of vitamin K was performed at the IMR laboratory in Bergen, Norway, which is accredited according to the ISO/IEC 17025 standard. The methodology is based on a European Standard method for the determination of vitamin K1 in foodstuffs by HPLC(27) and determines the content of PK, beta, γ-dihydrophylloquinone (dihydro-K1) and MK-4 to MK-10, including the separation of cis- and transforms of all vitamin K vitamers. The vitamin K methodology is not accredited due to the absence of certified reference materials (CRM) and proficiency tests available for any of the MK. However, CRM is analysed at least annually for validation and quality control of PK measurements. Additionally, the determination of PK contents is regularly verified through participation in international proficiency tests. Furthermore, reference materials (analytical standards) and in-house quality control materials are included in each sample run and results are recorded and monitored regularly. All procedures were conducted with minimal daylight exposure due to vitamin K’s sensitivity to light.
Analysis of vitamin K contents by HPLC-FLD
The analytical procedure, quality assessments and method performance are described in detail by Jensen et al. (Reference Jensen, Rød and Švarc22). Briefly, the contents of PK, dihydro-K1 and MK in the samples of shellfish were determined by HPLC coupled to a fluorescence detector (HPLC-FLD). A Dionex Ultimate 3000 HPLC system connected to a FLD-3400RS fluorescence detector (Thermo Fisher Scientific, Waltham, MA, USA) was used. The vitamins were separated on a C30 reversed-phase column (Thermo Fisher Scientific, C30 Accucore column) and electrochemically reduced to hydroquinone before detection (Thermo Fisher Scientific, ESA Coulochem III). Peak integration and analysis were performed using Chromeleon, version 7.2.10 (Thermo Fisher Scientific, Dionex Chromeleon 7 Chromatography Data System). The PK and MK contents were calculated using external calibration (standard curves) based on the concentrations of the nine analytical standards (PK, dihydro-K1 and MK4 to MK10).
Limits of quantification and measurement uncertainty
The limit of quantification (LOQ) for each vitamer varied according to four conditions in each sample: the amount of weighed sample material, the aliquot of the hexane phase, the volume of the final solvent and the volume injected into the HPLC system(Reference Jensen, Rød and Švarc22). An overview of the range of varying LOQ used in this article for each vitamer is provided in Table 2, Appendix B. The measurement uncertainty is 50 % for values LOQ-1 µg/kg, 30 % for values 1–10 µg/kg and 20 % for values from 10 to 3000 µg/kg.
Contribution of phylloquinone vitamin K contents to dietary reference values
The contents of PK in the shellfish samples were assessed in terms of the AI for adults of 1 µg PK per kg body weight per day, as established by EFSA(1). The reference body weight of 70 kg for 18–79-year-old adults, as described by the EFSA(1), was used. Thus, considering the AI and the reference body weight for adults, the dietary reference value for PK is 70 µg/day. Furthermore, in addition to the functions that are related to MK only, MK also possess the same biological functions as PK(1). Thus, we also present a hypothetical scenario in which the total vitamin K content (vitamin K1 + K2) contributes to the dietary reference value for vitamin K (using the AI for PK). To ensure a standardised basis for comparing the content of vitamin K(Reference Moxness Reksten, Wiech and Aakre25), a portion size of 100 g was therefore used in the calculations for all shellfish products.
Comparison of phylloquinone vitamin K and menaquinone vitamin K contents in other foods
To further assess the contents of vitamin K in shellfish, we compared the analytical values in this study with the contents of PK and MK in other foods known to be sources of vitamin K. No food composition databases provide values for individual MK, other than the USA Department of Agriculture’s food composition database(28), which only provides values for MK-4 for a selection of foods. Thus, we compared our results with the analytical data provided by Schurgers and Vermeer(Reference Schurgers and Vermeer4), which is considered the most comprehensive resource of the content of various MK in foods(Reference Palmer, Blekkenhorst and Lewis5). The paper lists values for PK and MK-4 to MK-10 for six common food categories purchased from local supermarkets in the Netherlands. Among these, we considered a selection of food products recognised to be good dietary sources of vitamin K, such as green, leafy vegetables, fermented foods, dairy products, plant-derived oils and margarines and meats. The number of samples in the study ranged from 4 to 15 for each product, from which we used the provided mean value in our estimations.
Seasonal variations in the vitamin K content of blue mussels
The blue mussels sampled from the Norwegian Food Safety Authority’s monitoring programme were evaluated in terms of seasonal variations in vitamin K. This investigation was prompted by unpublished findings from 2016 suggesting variability in vitamin K contents among a subset of blue mussel samples across different seasons of the year. In our study, one composite sample of blue mussels, comprising twenty-five individuals, was sampled from twelve different mussel farming locations along the Norwegian coast in March 2023 (Figure 1). Subsequently, in August and early September 2023, another sample from the same locations was collected again. These samples were categorised into two groups: spring (samples collected in March, n 12) and late summer (samples collected in August and early September, n 12) and compared with each other. Additionally, blue mussel samples (also containing twenty-five individuals) were collected from various other farming locations along the Norwegian coast in January, March, April, August and October 2023 (n 49, Table 2). These samples, in addition to those collected as part of the monitoring programme, were assessed in terms of monthly variations of vitamin K.
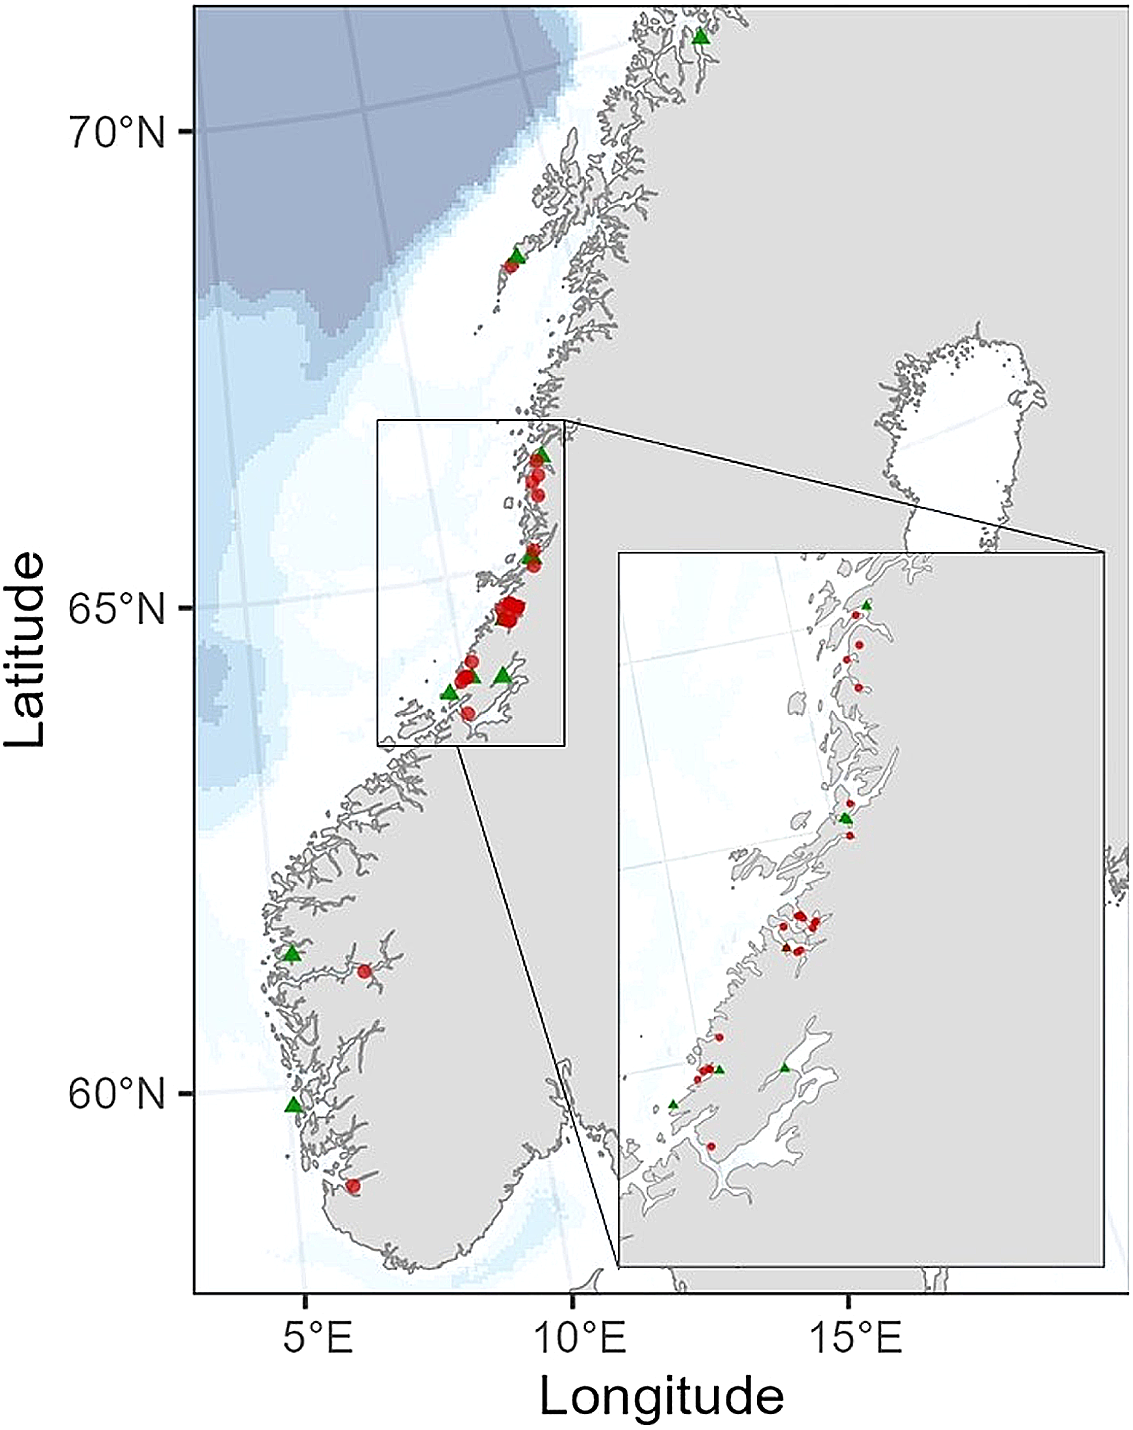
Figure 1. Map illustrating the sampling locations of blue mussels (Mytilus edulis) compared for seasonality (green triangles), with twenty-four samples collected twice from the same location, once in spring (n 12) and once in late summer (n 12). Additionally, other samples of blue mussels (red dots) were used to assess overall monthly variations in vitamin K contents.
Table 2. The total number of blue mussels (Mytilus edulis) collected and their physical parameters (mean (standard deviation)). The blue mussels that were compared for seasonality are presented in the two last rows
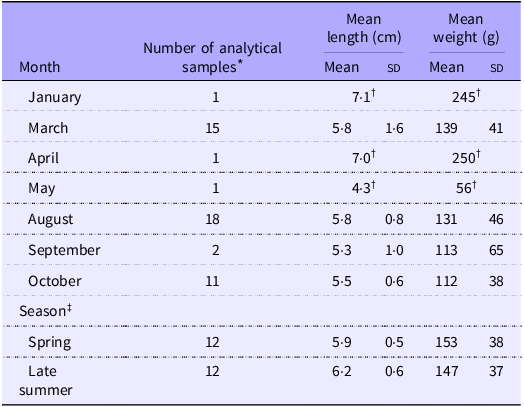
* Each sample consisted of twenty-five individual blue mussels pooled together.
† Only one composite sample was collected in January, April and May (n 1); thus, the standard deviation (sd) is not presented.
‡ Blue mussels that were compared for seasonality, only included those intentionally sampled twice at the same location; once in spring and once in late summer. Blue mussels sampled for the category ‘spring’ were sampled in March, whereas blue mussels sampled for the category ‘late summer’ were sampled during August and early September.
Data management, presentation and statistical analyses
Data were registered and extracted from the software Laboratory Information Management System (LIMS), version 8 (LabWare, Wilmington, DE, USA). The vitamin K contents are presented in µg/100 g wet weight, as recommended by the FAO of the United Nations’ guidelines for food composition data(Reference Greenfield and Southgate29). The number of significant digits reported, varied according to the measurement uncertainty: for values LOQ-1 µg/100 g, two significant digits were reported; and for values ≥ 1 µg/100 g, three significant digits were reported. To enable the calculation of mean and median values, medium-bound LOQ (LOQ value/2) was applied. Vitamers with > 30 % of the values < LOQ are indicated with a footnote in Table 3. The number of samples with values < LOQ are presented in Table 3, Appendix C. For dihydro-K1, values for all shellfish products were < LOQ, and the values for this vitamer are thus not included in the assessment of seasonal variations in the vitamin K content of blue mussels. Statistical analyses were performed using Statistical Package for the Social Sciences (SPSS) for Windows, version 27·0·1·0 (IBM Corporation). The data did not meet the normality assumption (assessed by visual inspection of histograms, QQ plots, and using the Shapiro–Wilk normality test), thus, medians and interquartile ranges (IQR) are presented in the table and text. Mean, standard deviations (sd) and ranges (minimum–maximum) are presented in Table 4, Appendix D. Seasonal differences in the vitamin K content of blue mussels were tested using the non-parametric Mann–Whitney U-test. To test for differences across months, the independent-samples Kruskal–Wallis test was applied, followed by Dunn–Bonferroni s post hoc tests for all possible pairwise comparisons. A significance level of P ≤ 0·05 was applied. Graphs were created using GraphPad Prism version 8.3.0 for Windows (GraphPad Software, San Diego, CA, USA).
Table 3. Contents of phylloquinone, beta, γ-dihydrophylloquinone (dihydro K1) and menaquinones (MK-4 to MK-10) in various shellfish products. The values are presented as medians and interquartile ranges (IQR), expressed in µg/100 g wet weight *
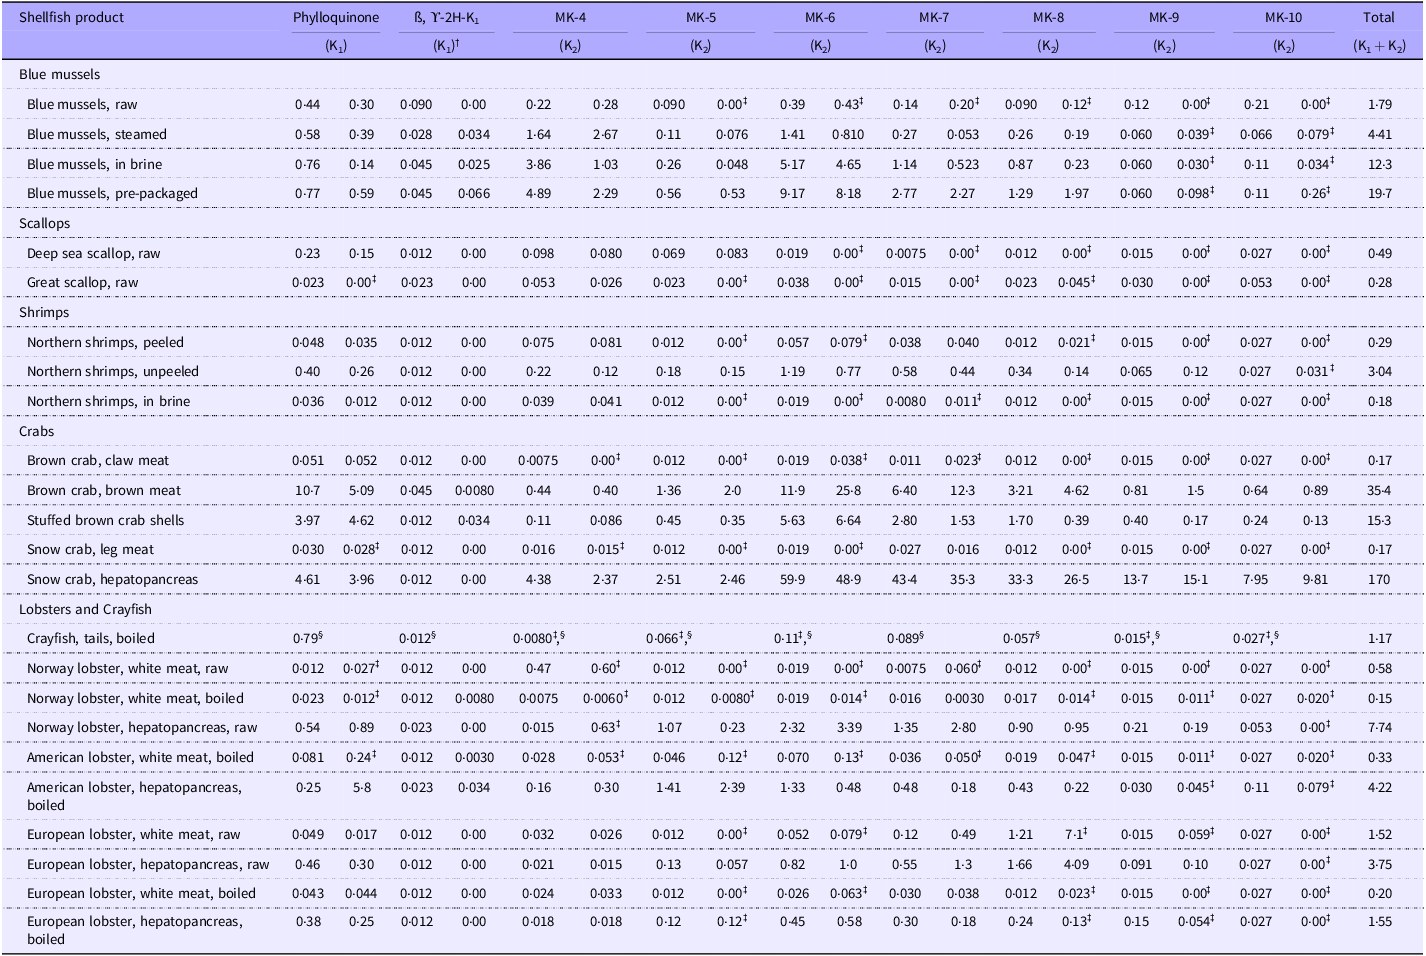
MK, menaquinone.
* For individual values below the limit of quantification (LOQ), the LOQ value was divided by two (medium-bound LOQ: LOQ/2) to enable the calculation of the median and interquartile range (IQR).
† All values for all shellfish products were below the LOQ for ß, ϒ-2H-K1. The IQR varied due to differences in the LOQ, caused by variations in the analytical conditions (see Table 2, Appendix B).
‡ This product consists of values where over 30 % of the values fall below the LOQ. For more information on the number and percentage of the samples that presented values below the LOQ for each vitamer, see Table 3, Appendix C.
§ The IQR could not be calculated due to a low number of samples (n 2).
Results
Phylloquinone, dihydro-K1 and total vitamin K contents in shellfish
Table 3 shows the mean contents of PK, dihydro-K1 and total vitamin K (K1 + K2) measured in the 323 shellfish samples. The median contents of PK varied considerably between each shellfish category, between shellfish products and between samples of the same shellfish products. The white meat of raw Norway lobster contained the lowest amount of PK (0·023 µg/100 g), followed by boiled Norway lobster (white meat) and great scallops, of which a high percentage of values were below LOQ (67 and 100 %, respectively). Overall, crabs as a group contained the highest contents of PK, albeit with considerable variations within the group (Table 4, Appendix D). Specifically, the brown meat of brown crab displayed the highest median content of PK at 10·7 µg/100 g; however, substantial variations were noted, ranging from 3·3 to 17 µg/100 g. It was further evident that the content of PK was considerably higher in the brown meat and hepatopancreas of crustaceans than in their white meat counterparts. For dihydro-K1, values for all shellfish products were below the LOQ (Table 3, Appendix C). The total vitamin K content varied from 0·15 µg/100 g in the white meat of boiled Norway lobster to 170 µg/100 g in the hepatopancreas of snow crab. For blue mussels as a group, the total vitamin K content was lowest in raw samples (1·79 µg/100 g), higher in steamed samples (4·41 µg/100 g), further increased in blue mussels in brine (12·3 µg/100 g) and the highest in pre-packaged blue mussels (19·7 µg/100 g). Furthermore, the total vitamin K content was also considerably higher in the brown meat and hepatopancreas of most crustaceans than in their white meat counterparts. As an example, the median vitamin K content in the hepatopancreas of snow crab (170 µg/100 g) was 1000-fold higher than the median content in the legs (0·17 µg/100 g).
Menaquinone contents in shellfish
Table 3 presents the measured contents of MK-4 to MK-10 in the shellfish products. The overall dominating MK was MK-6, followed by MK-4. The hepatopancreas of snow crab exhibited the highest contents of all MK, except for MK-4, which was highest in pre-packaged blue mussels. For MK-9 and MK-10, nearly all samples (81 and 91 %, respectively) had values below the LOQ (online Supplementary Table S3, Appendix C). A high number of samples below the LOQ was also evident for MK-5 (72 %). Raw samples of European lobster (both white meat and hepatopancreas) were the only shellfish products to exhibit MK-8 as the most abundant MK. These elevated levels of MK-8 were however not observed in the boiled samples of European lobster, where MK-6 was the most abundant MK. In blue mussels, MK-6 was the most abundant MK for all products regardless of processing, except for steamed blue mussels, where MK-4 was the most abundant. For scallops, nearly all vitamers, except for MK-4, had a high share of values below the LOQ (70–100 %). Similarly, for shrimps, the majority of values for the various MK were below the LOQ, except for MK-4 in shrimps in brine and both MK-4 and MK-7 in peeled shrimps. In unpeeled shrimps, the MK content was substantially higher than the MK content in peeled shrimps and shrimps in brine, with MK-6 as the most abundant MK (1·19 µg/100 g). The MK content of brown meat and the hepatopancreas of crustaceans was substantially higher than the PK content and compared with the other shellfish products. These matrices presented considerably higher levels of long-chain MK. It was also evident that the hepatopancreas of snow crab and the brown meat of brown crab had particularly high contents of long-chain MK (especially MK-6 to MK-9). The standard deviations were large for several of the samples, particularly for samples presenting high contents of MK, such as blue mussels and crustaceans, indicating large inter-individual variations (Table 4, Appendix D).
Contribution to adequate intake
When comparing the mean contents of PK in the shellfish product to the AI for PK, we found that intake of 100 g of all shellfish products, with the exception of the brown meat of brown crab and hepatopancreas of snow crab, resulted in meeting ≤ 1 % of the AI for PK (Figure 2). Whereas the brown meat of brown crab was estimated to contribute approximately 15 % of the AI, 100 g of the hepatopancreas of snow crab was able to contribute approximately 7 % of the AI. However, when evaluating the total vitamin K content’s hypothetical contribution to the dietary reference value (using the AI for PK), several shellfish products were able to meet ≥ 15 % of the AI due to their high contents of MK. The hepatopancreas of snow crab, for example, was estimated to meet 243 % of the AI when considering both PK and MK contents, whereas the brown meat of brown crab was estimated to meet 51 % of the AI.
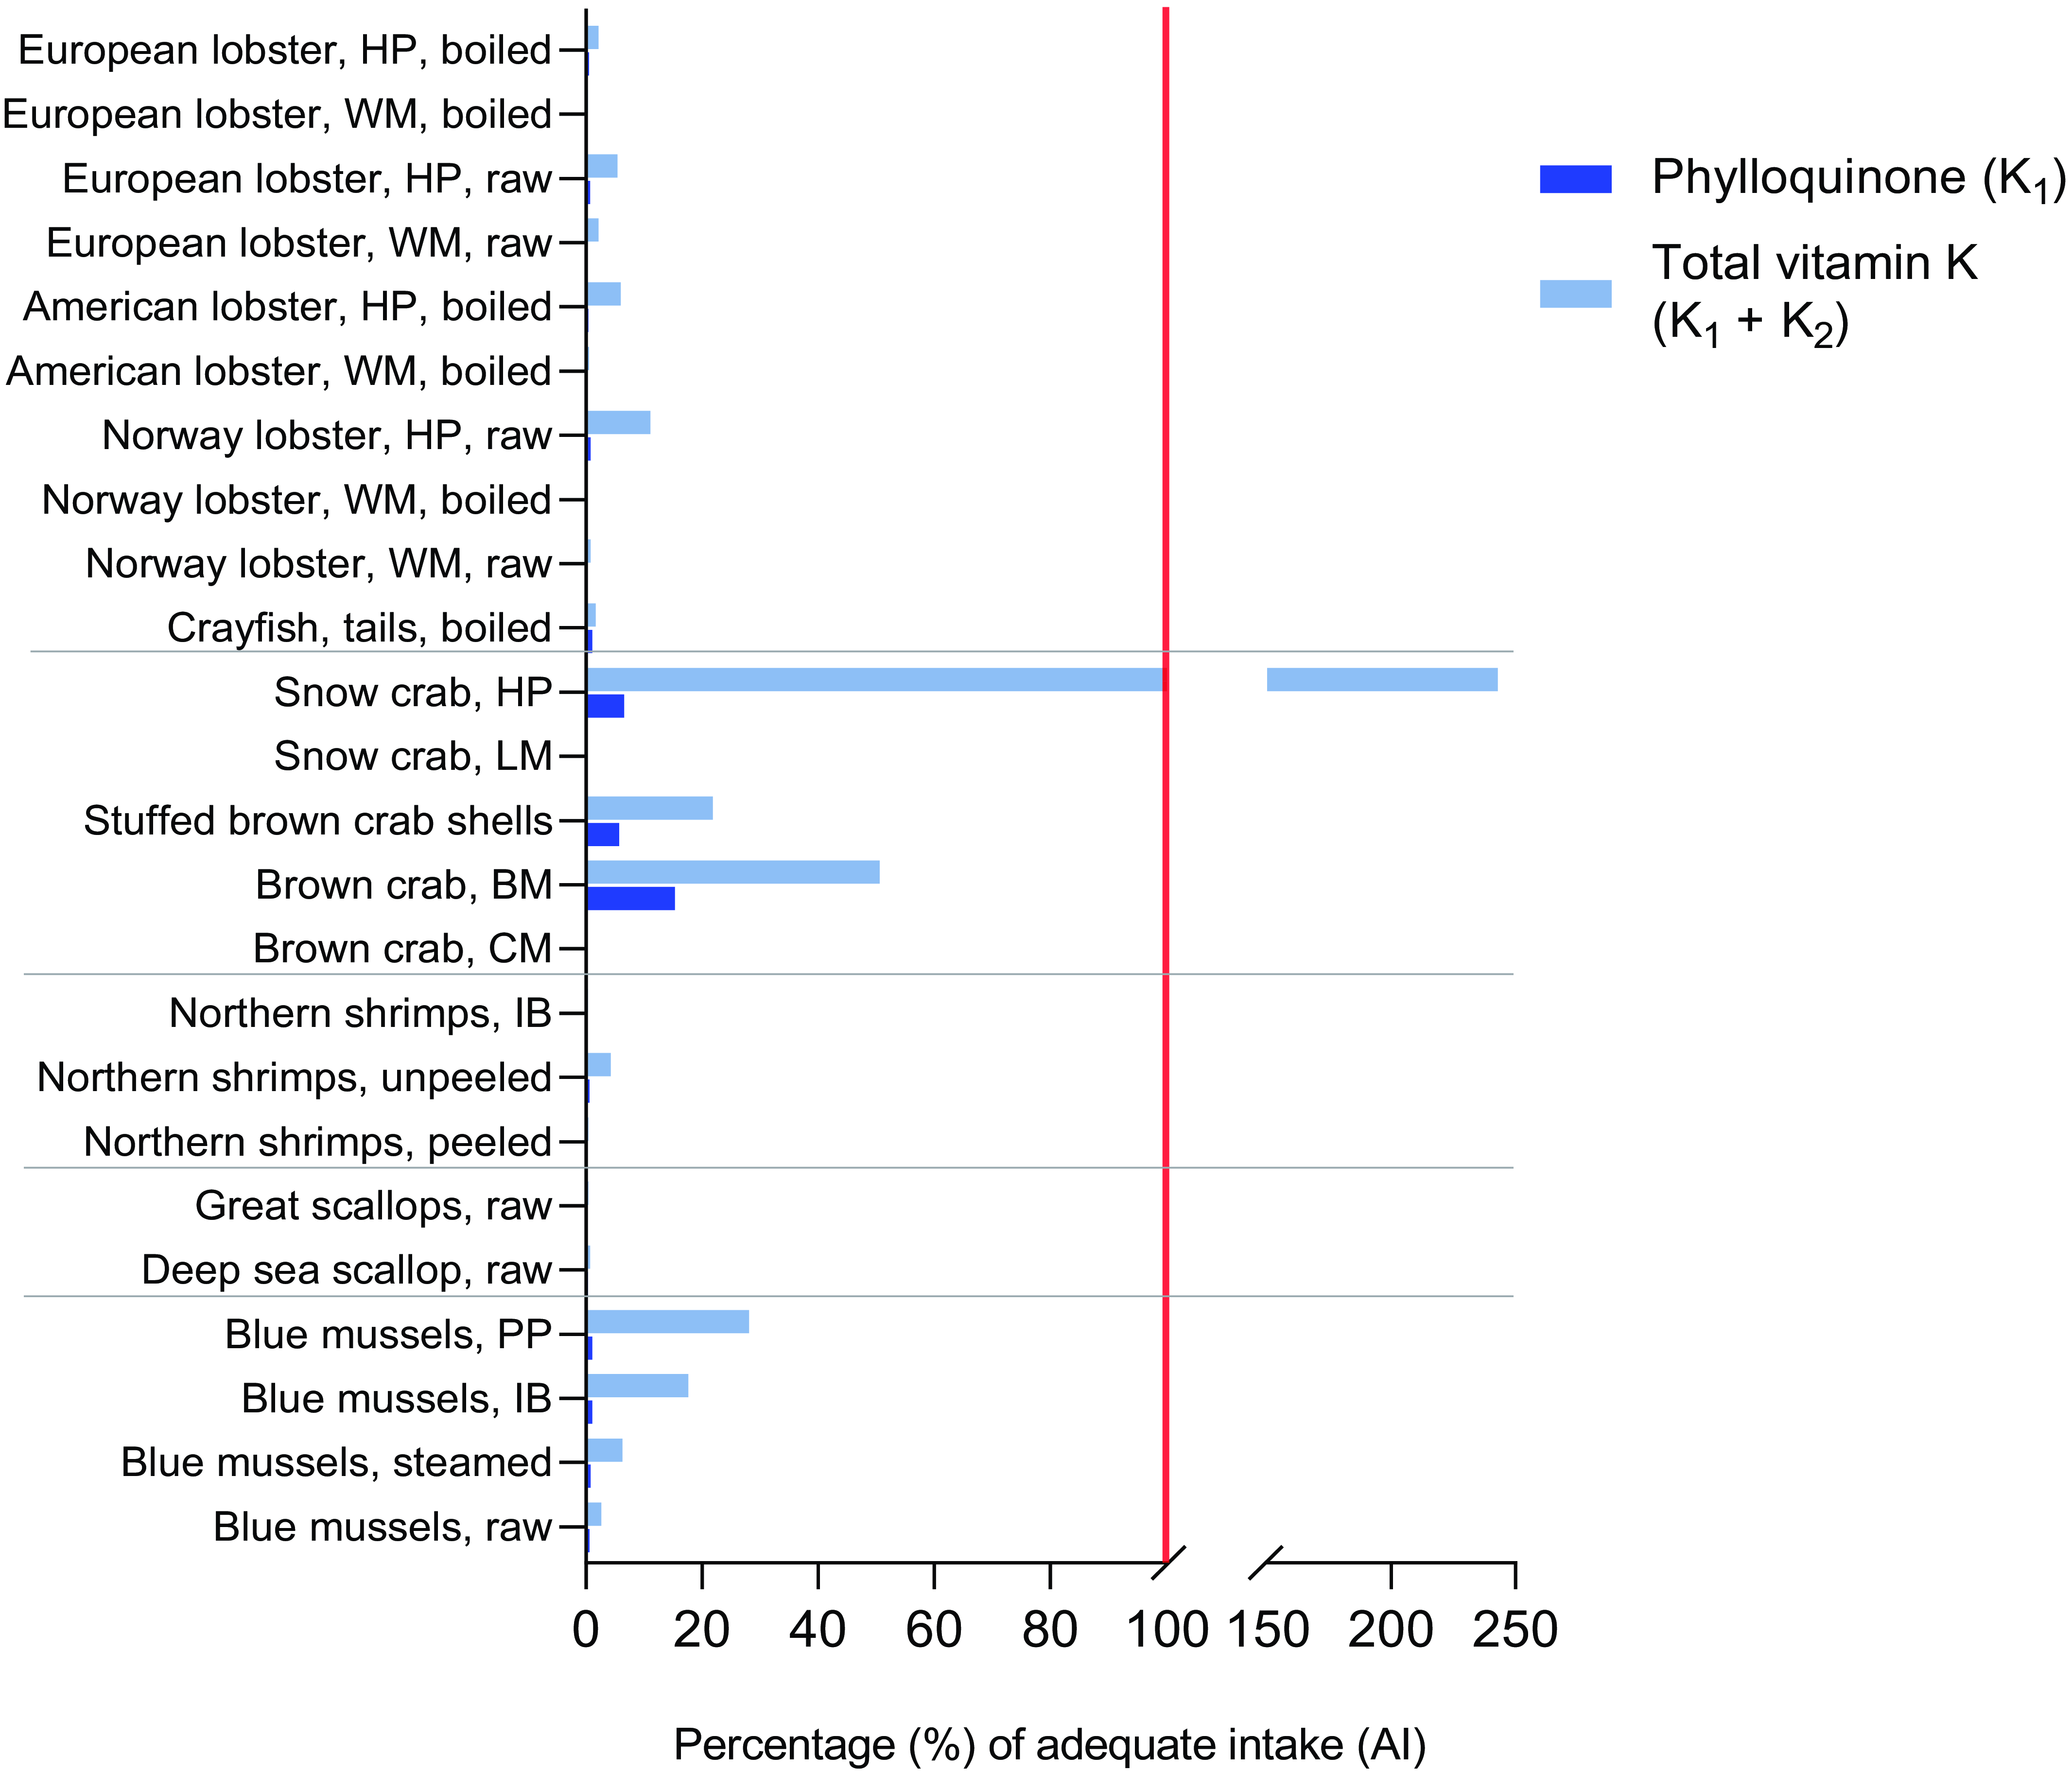
Figure 2. The estimated contribution of a 100 g serving of the shellfish products (median contents) to the adequate intake (AI) of phylloquinone is presented in dark blue. The red line indicates 100 % of the AI. A hypothetical scenario where the total vitamin K content (vitamin K1 + vitamin K2) is compared against the AI of phylloquinone is presented in light blue. BM, brown meat; CM, claw meat; HP, hepatopancreas; IB, in brine; LM, leg meat; PP, pre-packaged; WM, white meat.
Comparison with other foods
The analysed contents of PK and MK-4 to MK-10 in the shellfish included in this study were compared with those of other foods recognised to be high in vitamin K (Figure 3). Several of the shellfish samples included in this study contained vitamin K contents comparable to, or exceeding, foods recognised as good sources of vitamin K. For instance, the hepatopancreas of snow crab (total vitamin K: 170 µg/100 g) was surpassed only by natto (1138 µg/100 g), goose liver paste (380 µg/100 g), kale (817 µg/100 g) and spinach (387 µg/100 g). The particularly high content of MK-6 observed in the hepatopancreas of snow crab (59·9 µg/100 g) exceeded that of any foods previously reported in the literature. Furthermore, many of the analysed shellfish products exceeded the total vitamin K content of the majority of meat products, such as beef, chicken breast, pork steak and liver, deer, duck, lamb and veal, as well as dairy products such as milk and yoghurt. Conversely, many of the shellfish products, such as scallops, peeled shrimps and shrimps in brine, the claw meat and leg meat of crabs and the white meat of most lobster species, did not surpass the majority of foods recognised as good sources of vitamin K.
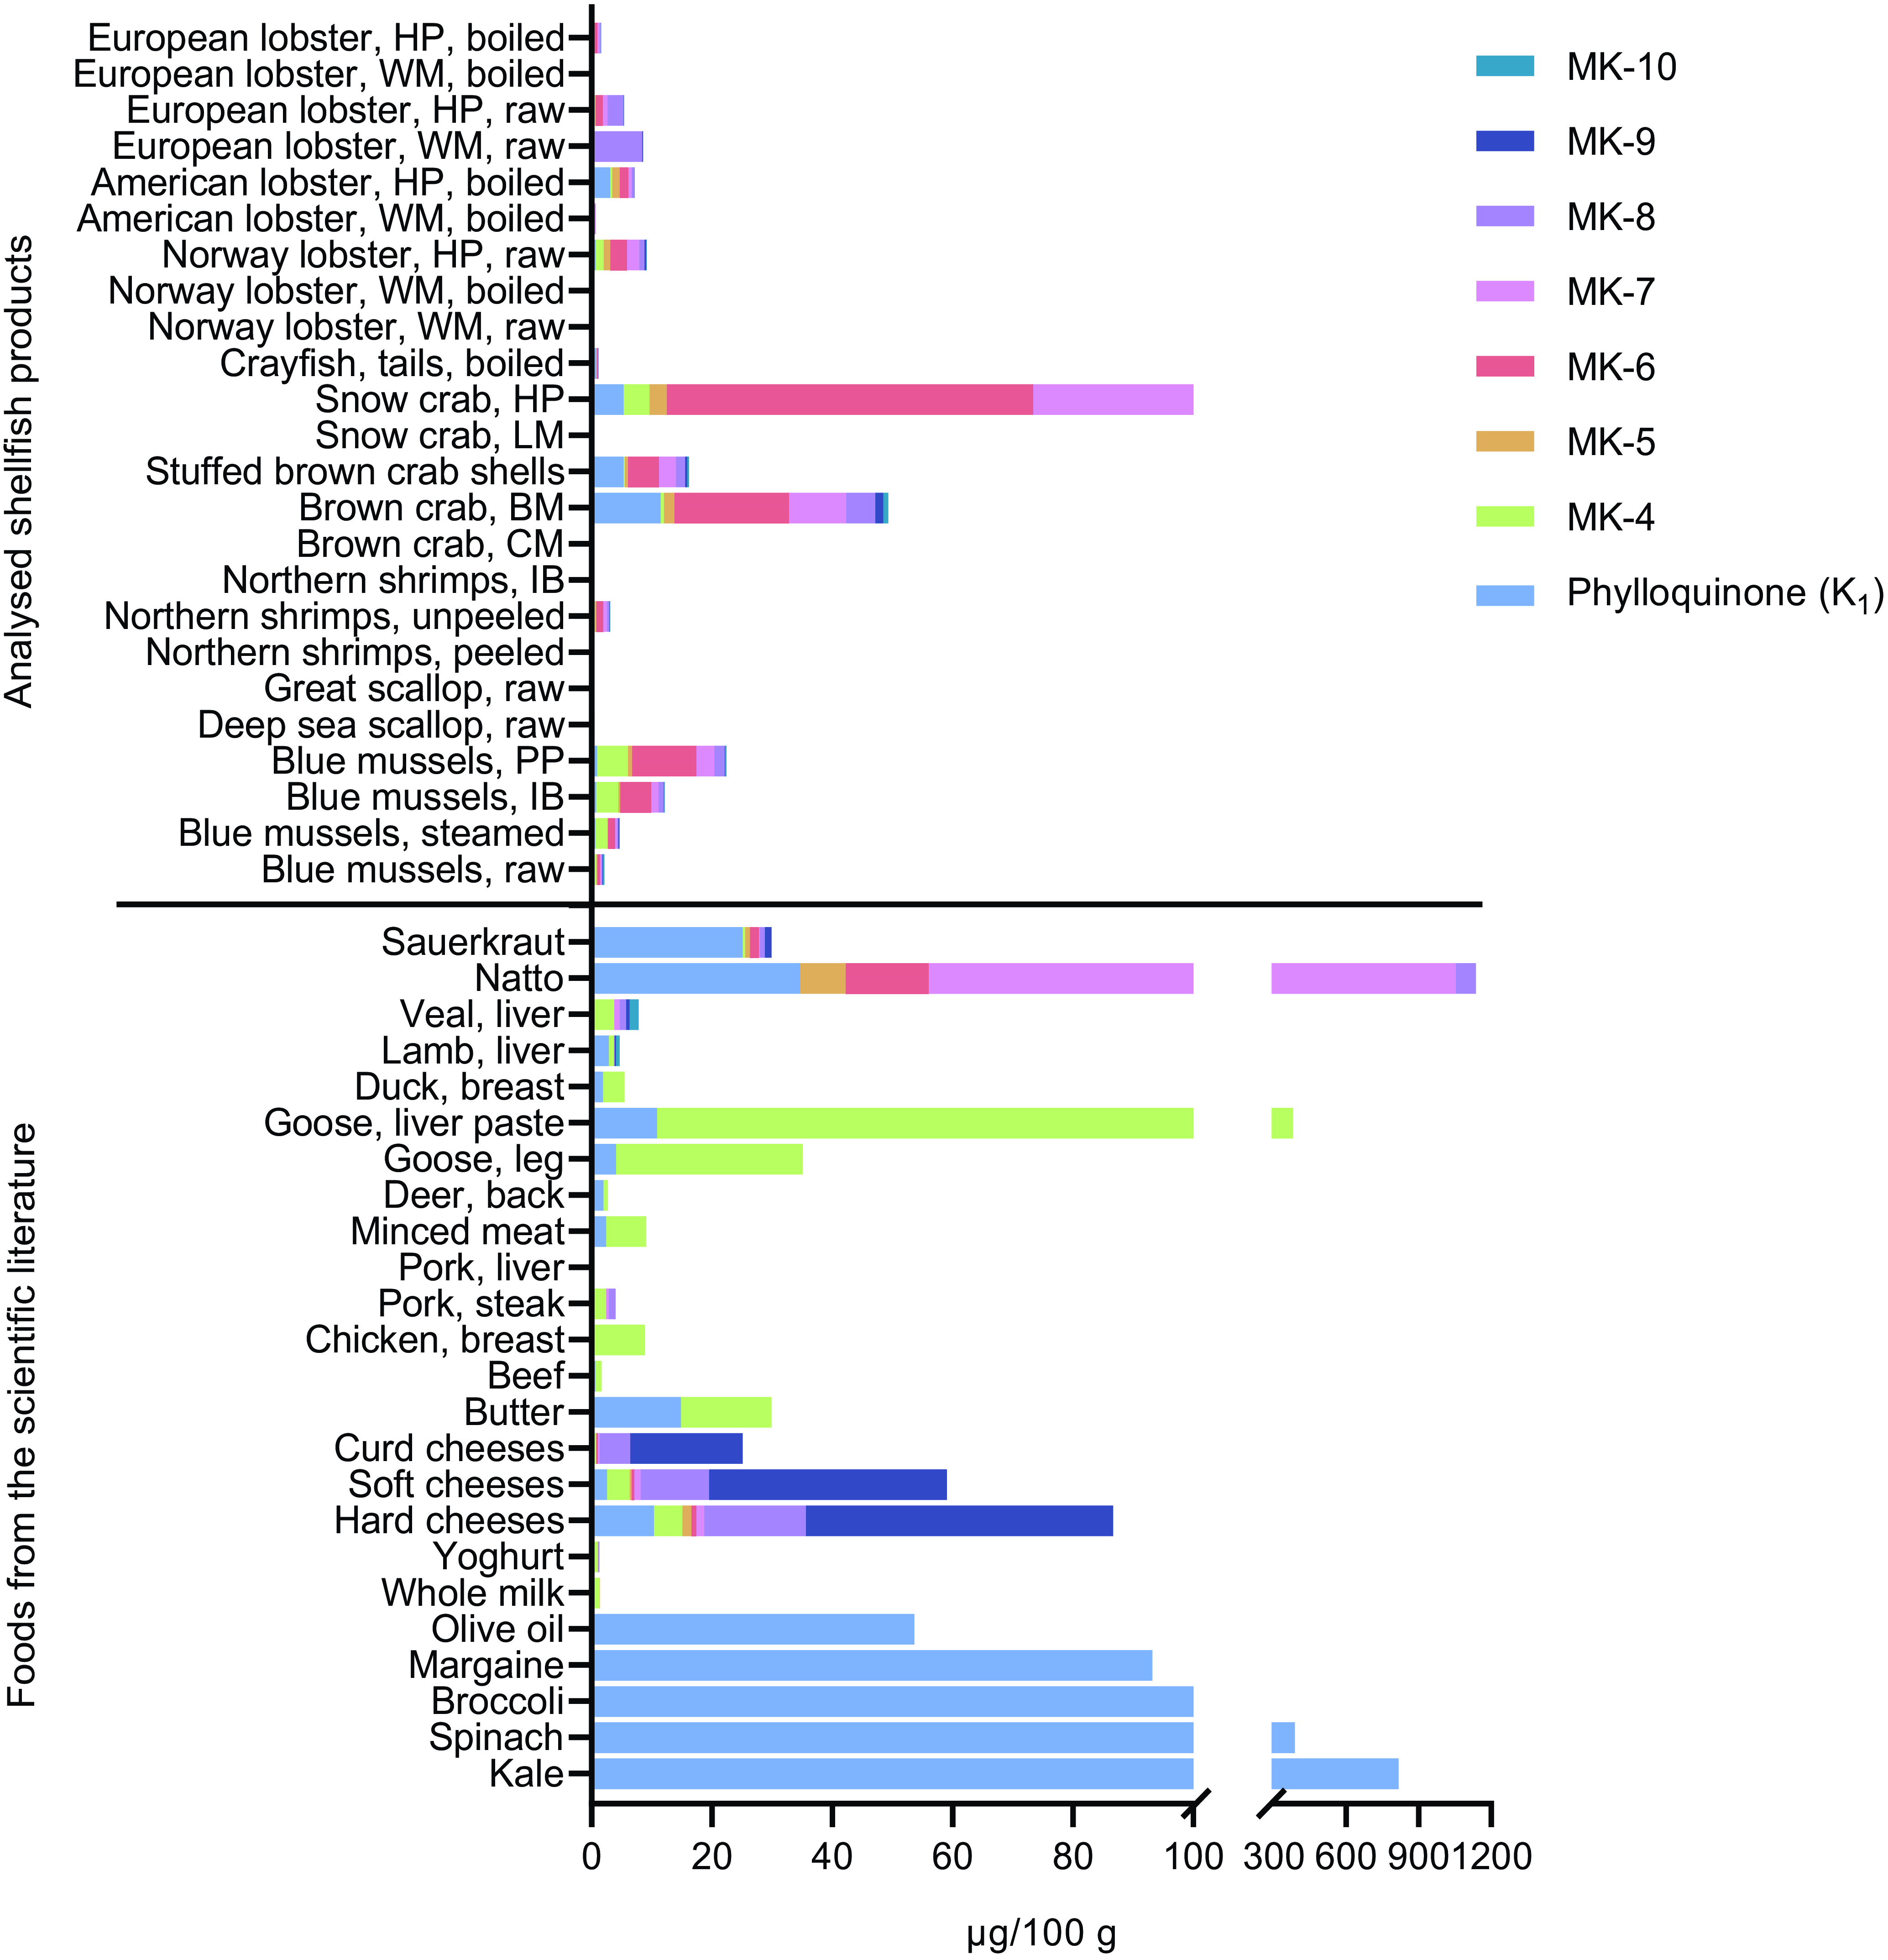
Figure 3. Comparison of the mean content of vitamin K in different shellfish and other foods recognised as good sources of vitamin K. The analytical mean values of other foods were obtained from Schurgers and Vermeer(Reference Schurgers and Vermeer4). BM, brown meat; CM, claw meat; HP, hepatopancreas; IB, in brine; LM, leg meat; PP, pre-packaged; WM, white meat.
Seasonal variations of vitamin K content of blue mussels
The seasonal variations in vitamin K between raw blue mussels sampled at the same geographical locations during spring and late summer, respectively, are presented in Figure 4. No significant differences (P > 0·05) were observed for any of the vitamers. The largest differences were found for the median contents of PK (0·27 µg/100 g in spring and 0·55 µg/100 g in late summer) and MK-6 (0·42 µg/100 g in spring and 0·15 µg/100 g in late summer) although not significant. When evaluating the differences in total vitamin K contents (vitamin K1 + K2), no significant differences were found either. Furthermore, the samples were evaluated in terms of geographical location (North/South), revealing no significant differences in vitamin K contents between samples collected in the Northern v. Southern regions of Norway.
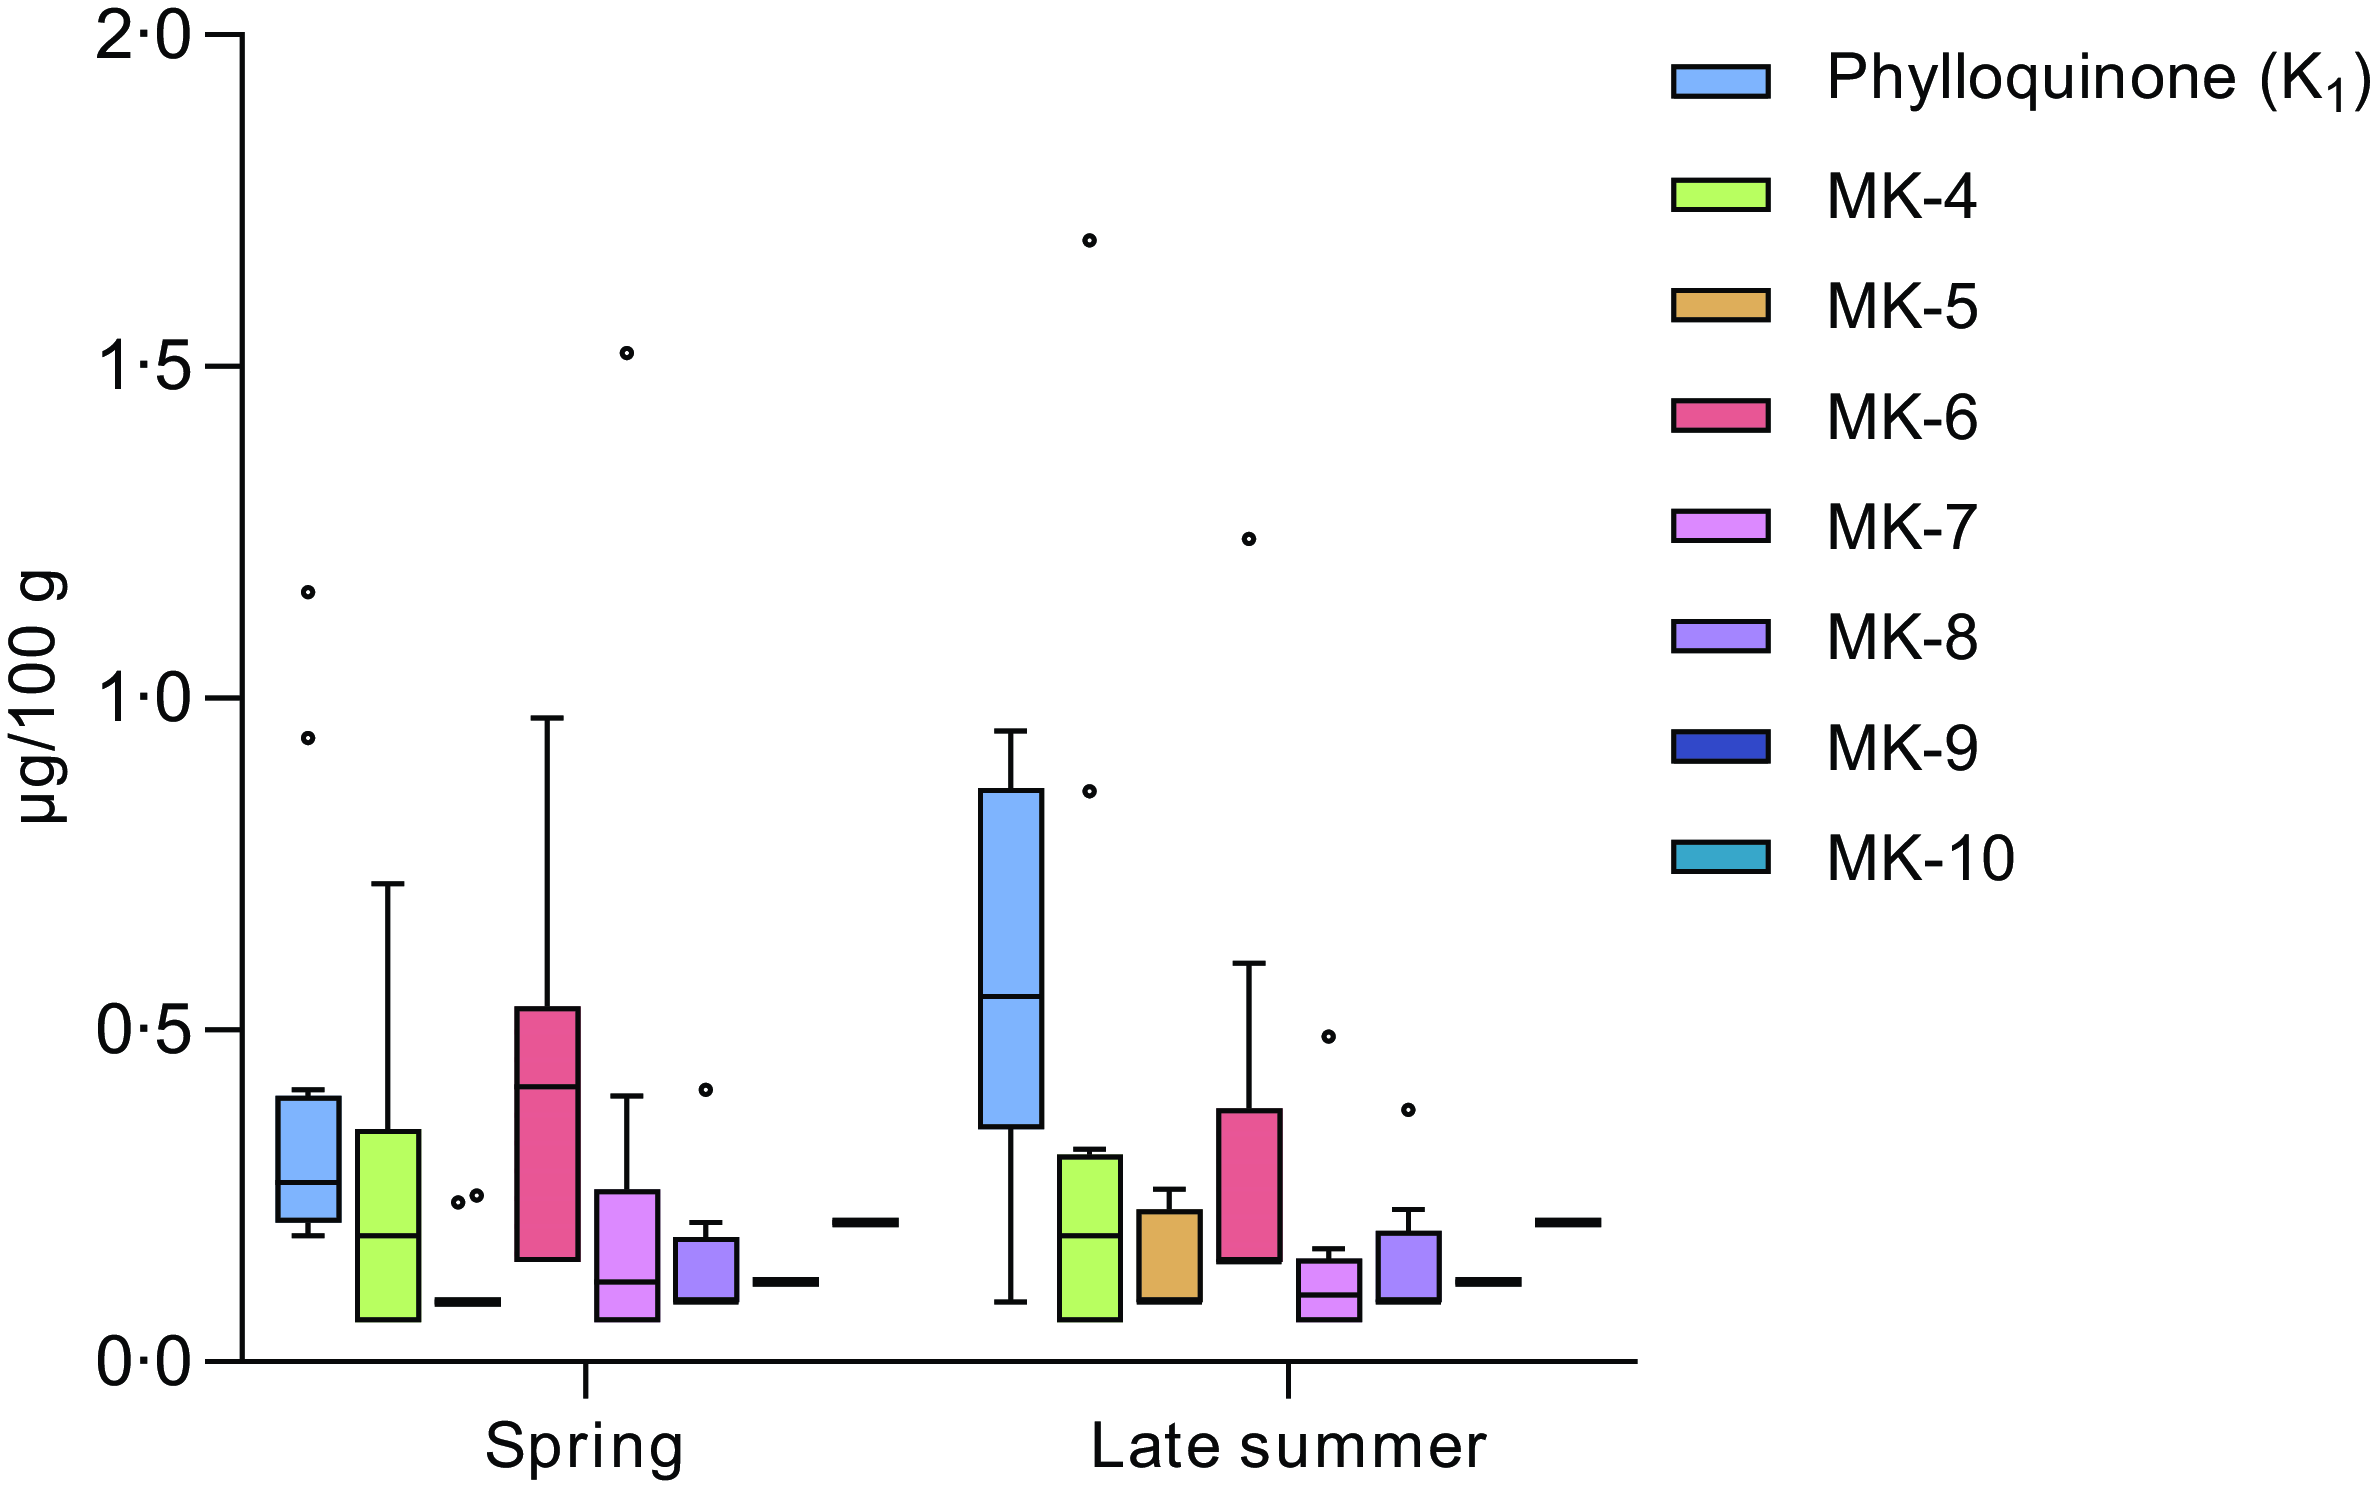
Figure 4. Seasonal differences between the blue mussels (Mytilus edulis) sampled during spring v. late summer. Each box represents the interquartile range (IQR), the median is denoted by the black line within the box, the whiskers denote variability (values within 1·5 IQR) and dots denote observations outside the range of 1·5 IQR.
All raw blue mussels sampled in 2023 were also compared in terms of monthly variations (Figure 5). An increasing trend was observed, indicating an increase in vitamin K content throughout the year, with higher levels recorded in the autumn compared with the spring. The total vitamin K content of the mussels sampled in the months of January–May was also found to be significantly lower (P = 0·003) than that of the blue mussels sampled in August–October. In terms of monthly variations, significant differences were observed in the PK content between several of the months, as indicated in Figure 5. For MK, differences were observed between August and October for MK-5 (P = 0·042), March and October for MK-7 (P = 0·043) and March (P = 0·003), August (P = 0·007) and September (P = 0·025) in comparison to October for MK-8.
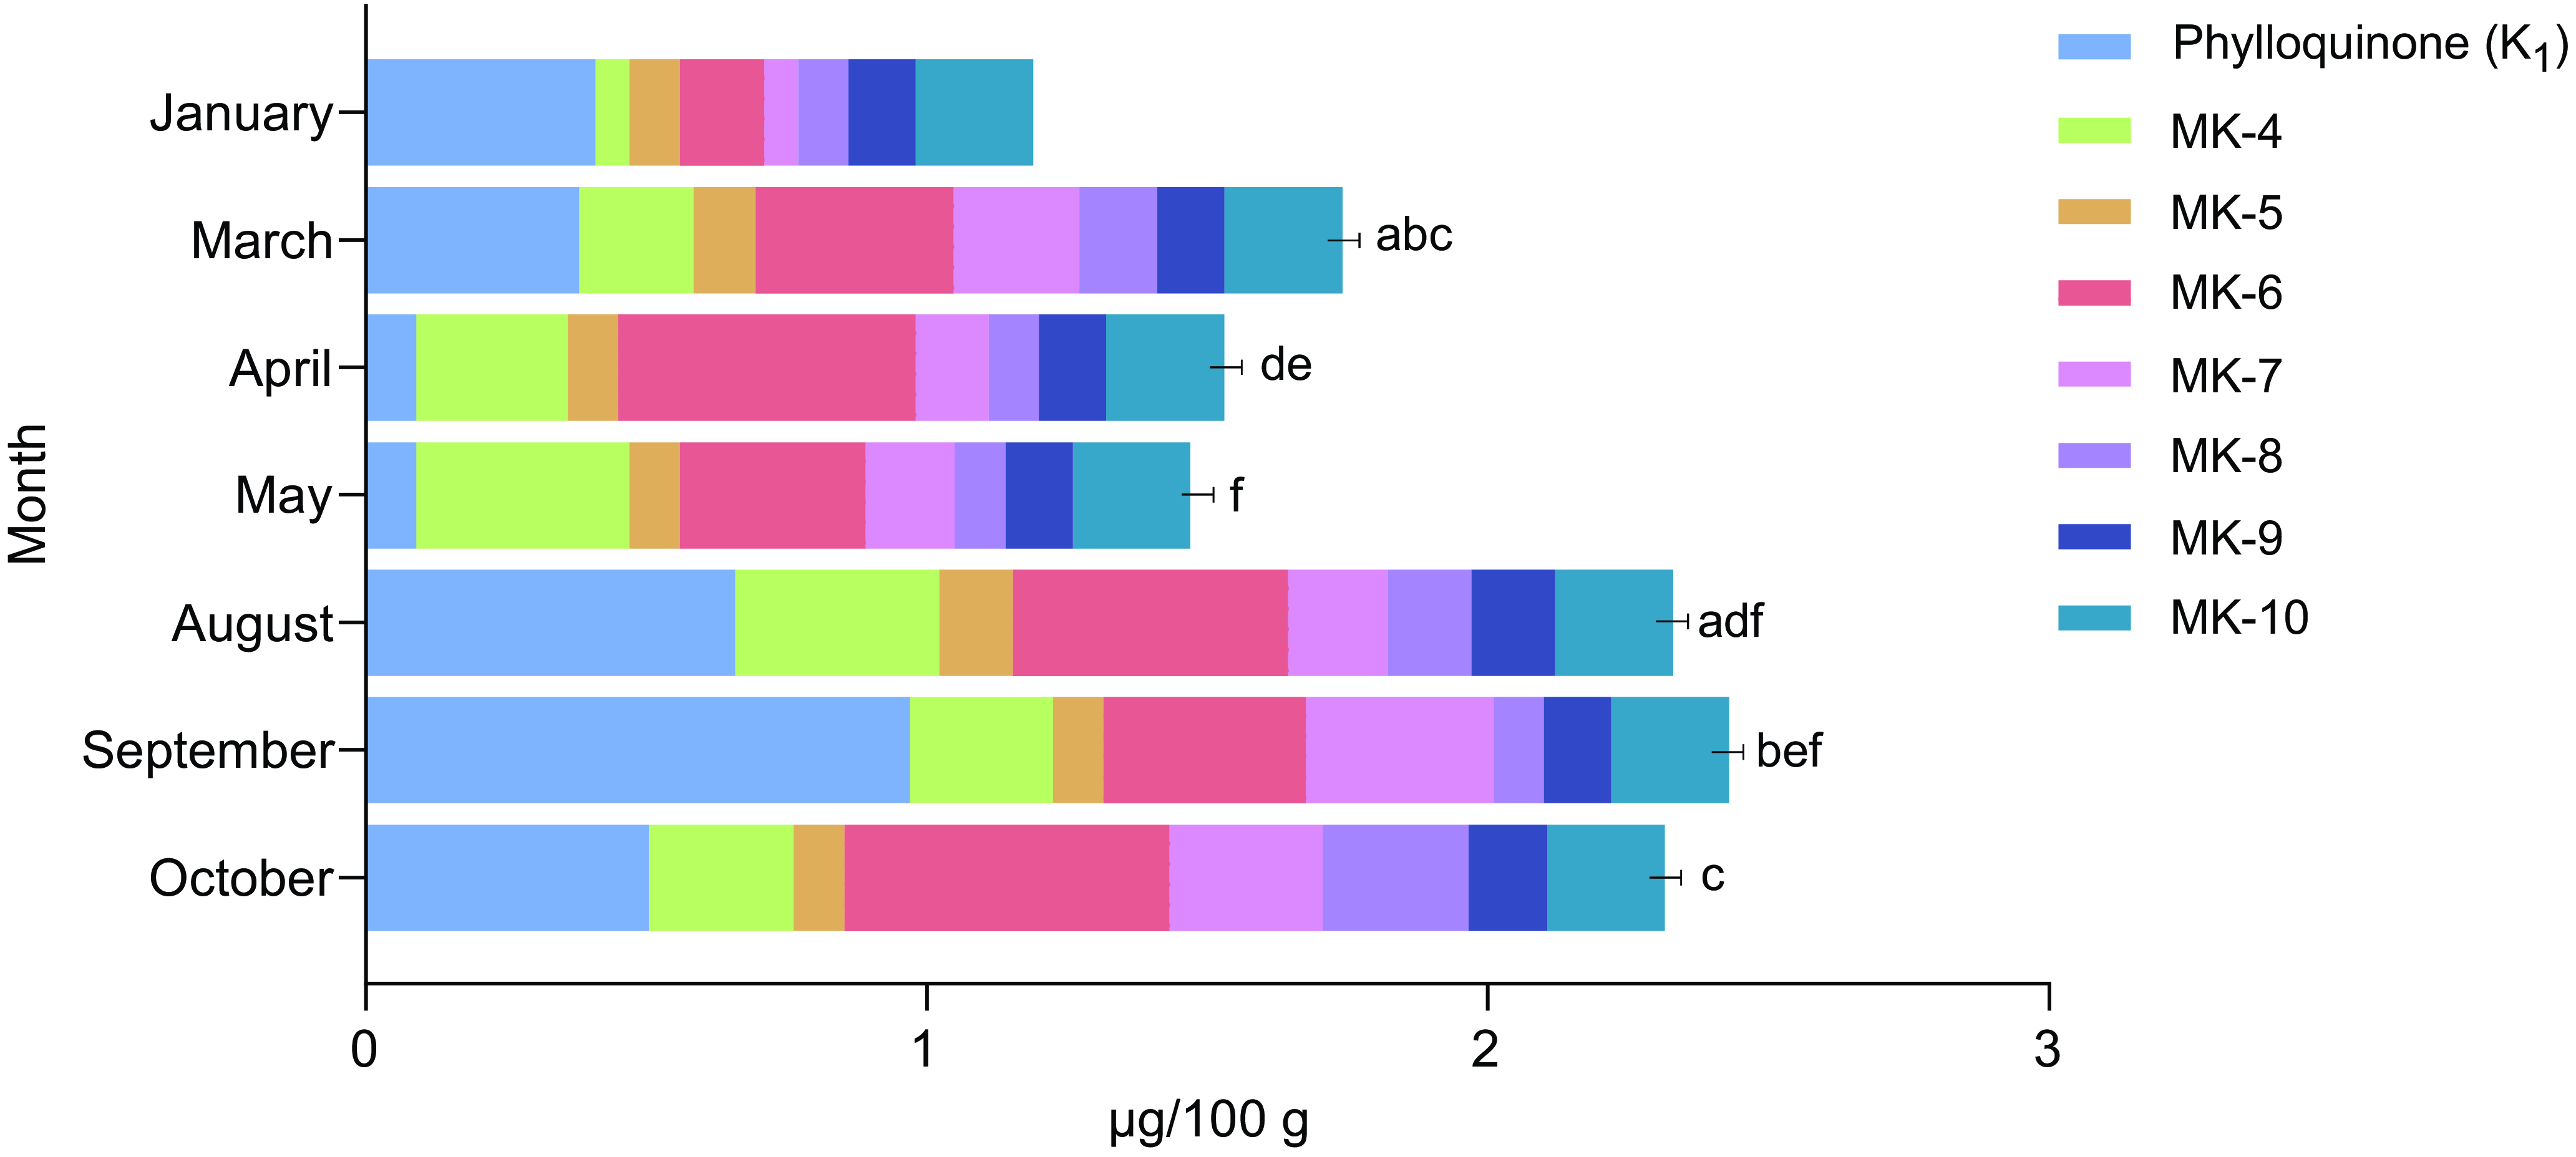
Figure 5. The contents of phylloquinone (PK) and menaquinones (MK-4 to MK-10) in blue mussels (Mytilus edulis) sampled during various months of the year. Statistically significant differences (P < 0·05) for PK are indicated using letters. If two or more bars are marked with the same letters, significant differences were found between these months.
Discussion
This study provides novel analytical insights into the vitamin K content of shellfish, a food group not previously investigated. Thus, our study contributes to the limited food composition data on vitamin K worldwide, particularly in Norway. Furthermore, whereas existing scientific literature typically reports the content of PK and only one or two MK, our study provides analytical data on PK, dihydro-K1 and MK-4 to MK-10 in more than 300 samples. The total vitamin K content was generally < 10 µg/100 g for most shellfish products, with the exception of blue mussels in brine and pre-packaged blue mussels, the brown meat of brown crab, stuffed brown crab shells and the hepatopancreas of snow crab. Among these, the hepatopancreas of snow crab displayed the clearly highest content of total vitamin K (170 µg/100 g), followed by the brown meat of brown crab (35·4 µg/100 g). When comparing our results with foods recognised as good sources of vitamin K(Reference Schurgers and Vermeer4), many of the shellfish products exceeded the total vitamin K contents found in most meat products and some dairy products. Overall, the hepatopancreas of crustaceans, the brown meat of brown crab (including stuffed crab shells) and blue mussels may particularly be considered good sources of vitamin K when compared with other foods acknowledged for their vitamin K content. The predominant MK detected in most shellfish products was MK-6, followed by MK-4. The hepatopancreas of snow crab exhibited a notably high content of MK-6, a feature not observed in any of the foods already acknowledged as good sources of vitamin K. Moreover, as dihydro-K1 is formed during the hydrogenation of plant oils, which is an industrial process(Reference Peterson, Muzzey and Haytowitz30), it is not surprising that all samples of shellfish had dihydro-K1 contents below the LOQ. Furthermore, no significant differences in the content of any vitamin K vitamer were observed between blue mussels sampled during spring v. blue mussels sampled during late summer. Conversely, significant monthly variations were observed from January through October, with a trend towards higher contents in the autumn months.
To the best of our knowledge, previous studies have not extensively investigated the vitamin K contents in shellfish. In the study by Schurgers and Vermeer(Reference Schurgers and Vermeer4), which assessed the vitamin K contents in various foods, only seven samples of ‘prawn’ (without further specification) were analysed. In that study, the mean content of PK was determined to be 0·1 µg/100 g, whereas the contents of all MK were reported as ‘not detectable’. Although comparison is difficult due to lack of documentation on sampling and sample preparation, these findings align with the results presented in our study, where the total mean content of vitamin K in peeled shrimps and shrimps in brine was found to be low (< 0·1 µg/100 g). Similarly, in a study by Elder et al. (Reference Elder, Haytowitz and Howe31), which analysed the contents of PK, dihydro-K1 and MK-4 in a range of foods in the USA, low vitamin K contents were reported in one sample (n 1) of cooked and canned shrimps (MK-4:0·2 µg/100 g, not detectable contents of PK and dihydro-K1). Additionally, one sample of canned crab (n 1) was analysed in the same study, yielding non-detectable contents of all three analytes. Moreover, although several other studies have analysed the contents of vitamin K across a diverse range of various food groups(Reference Palmer, Koch and Shinde3,Reference Fu, Harshman and Shen23,Reference Kamao, Suhara and Tsugawa32–Reference Koivu-Tikkanen35) , shellfish have not been previously examined. Despite limited investigation, in other seafood such as fish, the content of vitamin K2 is considered generally low (but detectable), and MK other than MK-4 have only been identified in a small number of fish species(Reference Walther, Karl and Booth17,Reference Walther, Chollet and Gordeladze36–Reference Ostermeyer and Schmidt38) .
White meat v. hepatopancreas of crustaceans
Our results revealed considerably higher contents of vitamin K in the brown meat and hepatopancreas of crustaceans than in their white meat counterparts. In a previous study, the MK content was found to vary by the percentage of fat present in dairy products(Reference Fu, Harshman and Shen23), with a significantly higher content of MK in full-fat products than in dairy products with a reduced fat content. Higher contents of vitamin K in fatty fish than in lean fish have also been reported(Reference Ostermeyer and Schmidt38). The fat content in the claw meat and leg meat (white meat) of brown crab and snow crab is substantially lower than in the brown meat and hepatopancreas, with values of 1·1 v. 9·8 g/100 g for brown crab, and 1·3 v. 24 g/100 g for snow crab, respectively(Reference Moxness Reksten, Wiech and Aakre25). As a fat-soluble vitamin, it is not surprising that the highest contents of vitamin K were found in tissues with the highest fat content. However, despite having similarly high-fat contents as the hepatopancreas of brown crab and snow crab, elevated vitamin K contents were not observed in the hepatopancreas of Norway lobster, American lobster or raw and boiled European lobster, with fat contents of 9·3, 11, 23 and 25 g fat/100 g, respectively(Reference Moxness Reksten, Wiech and Aakre25). This implies that additional factors, such as diet, environmental conditions or other external or internal influences, may affect the content of vitamin K in shellfish. In terrestrial animals, MK and particularly long-chained MK, have previously been reported in the liver(Reference Schurgers and Vermeer4,Reference Elder, Haytowitz and Howe31,Reference Koivu-Tikkanen, Ollilainen and Piironen37) , which is thought to be the largest storage organ of vitamin K(1,Reference Shearer39) . This may also partly explain the high contents of MK-6 to MK-9 found in the brown meat of brown crab and in the hepatopancreas of snow crab, as both of these tissues comprise the liver. Considerably higher contents of MK-4 have also previously been reported in goose liver paste (370 µg/100 g) compared with goose leg (31·0 µg/100 g)(Reference Schurgers and Vermeer4). Moreover, given that many of the shellfish included in this study have a diet rich in phytoplankton(Reference Riisgård, Egede and Barreiro Saavedra40–Reference Strohmeier42), the dominating prevalence of MK-4 in shellfish such as blue mussels, scallops and shrimps could potentially be a result of the conversion of PK (or other MK) to MK-4. For instance, for deep sea scallops, nearly all values were below the LOQ, except for values for PK and MK-4, where none were below the LOQ. Although there is limited data on the vitamin K content in phytoplankton, certain algae have been reported to contain very high contents of PK(Reference Jensen, Rød and Švarc22,Reference Kamao, Suhara and Tsugawa32,Reference Tarento, McClure and Vasiljevski43) . Whereas the conversion of menadione in fish feed to MK-4 has been reported in various fish species(Reference Krossøy, Waagbø and Ørnsrud44), this has not yet been documented in shellfish, indicating a need for further research to clarify this aspect.
Variations in vitamin K contents
For several of the shellfish products analysed in this study, considerable intra-species variation was observed. For instance, in the hepatopancreas of snow crab, the content of MK-6 varied from 23·4 to 95·6 µg/100 g, whereas the content of MK-7 varied from 19·6 to 70·8 µg/100 g. Large variations were also evident in products with relatively low median total vitamin K contents, such as the white meat of raw European lobster, where the content of MK-8 ranged from 0·012 (< LOQ) to 56·0 µg/100 g. The median value for raw white meat of European lobster is based on twenty composite samples, with ten samples collected in Hvaler (Eastern Norway) and the other ten in Austevoll (Western Norway). In lobsters sampled from Eastern Norway, the range for MK-8 varied from 2·4 to 56 µg/100 g, whereas for those sampled from Western Norway, all values were below the LOQ. All samples were collected in November, suggesting that factors other than season, such as geographic location, differences in diet or other unknown factors might account for the observed variability. No substantial differences were observed in the contents of PK or the other MK between the samples. Moreover, large variations have been observed in various food products from terrestrial animals, where the country of origin and regional disparities have been found to affect the content of vitamin K(Reference Palmer, Blekkenhorst and Lewis5). While these differences have previously been attributed to the use of menadione in animal feeds and disparities in food production, such factors cannot account for the variations observed in the shellfish products analysed in this study.
Seasonal variations in vitamin K contents of blue mussels
When examining seasonal differences between blue mussels harvested at the same geographic location, we found no significant differences between spring and late summer. However, when evaluating monthly variations across the year, significant differences were observed for several of the vitamers, with a clear trend of higher vitamin K contents in the autumn months, particularly in September. As blue mussels are suspension feeders and thus primarily feed on phytoplankton present in the surrounding water(Reference Riisgård, Egede and Barreiro Saavedra40,Reference Strohmeier42) , the onset of seasonal algal blooms is one plausible explanation for this. Along the Norwegian coast, algal blooms typically occur from spring to late summer(Reference Silva, Counillon and Brajard45). As food availability primarily controls the growth of filter-feeding bivalves(Reference Strohmeier42,Reference Cranford, Armsworthy and Mikkelsen46) , the increased availability of algae in the water during early summer months may result in blue mussels accumulating more nutrients, including vitamin K, towards late summer and early fall compared with preceding months. For example, the blue mussel sample analysed in May (n 1) was considerably smaller in size and lighter in weight than the samples collected in all other months. It should, however, also be noted that the number of samples varied considerably between the different months (from 1–18 samples), resulting in a less-than-optimal setup for evaluating monthly variations. Additionally, samples were not collected from all months of the year. Another limitation is the storage temperature of –20°C applied to all blue mussels assessed for seasonal variations, which may have impacted the vitamin K contents of the samples. Significantly lower PK and MK-4 contents have previously been reported in samples of plaice – which have a similar low-fat content to blue mussels (< 3 g/100 g(Reference Moxness Reksten, Wiech and Aakre25)) – when stored at –20°C, as opposed to –80°C(Reference Oveland, Bøkevoll and Araujo47). Furthermore, the disparities in vitamin K contents may also be attributed to geographical variances, a factor not comprehensively assessed in our study, given that the majority of samples were collected in close proximity to each other within the same geographic area of mid-Norway. Consequently, further research should be conducted on the impact of seasonal and geographic variations on the content of vitamin K in blue mussels, and in other shellfish.
Degree of processing
We further observed a trend of higher contents of vitamin K in steamed blue mussels than in raw blue mussels, with an even higher content observed in blue mussels in brine, and, ultimately, pre-packaged blue mussels. The experimental design of this study does not facilitate an exact assessment of the effect of processing on the content of vitamin K, given that identical samples were not analysed across all categories. Nonetheless, some hypotheses can be proposed. The observed increase in vitamin K contents with the degree of processing may be attributed to several factors. In general, cooking (boiling/steaming) may reduce the water content in foods(Reference Greenfield and Southgate29), which may lead to an increase in the content of vitamin K per 100 g sample, as the relative proportion of nutrients in the food becomes more concentrated. For the samples used in this study, the dry matter/water content of all blue mussel samples has been analysed previously(Reference Moxness Reksten, Wiech and Aakre25); however, no clear trend could be observed. As expected, the median water content was highest in raw samples (81·8 g/100 g) and decreased in steamed blue mussels (76·2 g/100 g). For blue mussels in brine, the water content was higher than steamed samples (79·3 g/100 g), likely attributed to the presence of brine water surrounding the mussels. In pre-packaged blue mussels (78·6 g/100 g), however, the water content was also increased, posing a challenge in correlating the high content of vitamin K with the decrease in water content. Limited data regarding the impact of cooking or processing on the content of MK in foods is available in the scientific literature; however, some studies have investigated the effect of cooking on the content of PK in various vegetables(Reference Lee, Choi and Jeong48,Reference Damon, Zhang and Haytowitz49) . A general trend towards higher contents of PK in cooked compared with raw vegetables was found in both studies, although this was not consistent across all food comparisons.
Contribution to adequate intakes
Very few of the shellfish products were found to significantly contribute to the AI of PK. The brown meat of brown crab presented the highest contribution, of which a 100 g serving was estimated to provide 15 % of the AI of PK. Despite their relatively low PK content, many shellfish products contained high amounts of MK. In a hypothetical scenario, this resulted in an estimated potential contribution of several shellfish products to the AI ranging from 15 to 243 % when accounting for the presence of MK. As both forms of vitamin K activate vitamin K-dependent proteins(1,Reference Lyytinen and Linneberg6,Reference Halder, Petsophonsakul and Akbulut15) , this hypothetical scenario consisted of simply combining the contents of PK and MK and comparing them to the established AI for PK. However, it is important to note that this scenario has limited value, as the current AI is based solely on the nutritional requirements for PK and does not incorporate MK. Moreover, it has been suggested that higher recommendations for vitamin K intake should be established, as higher dietary vitamin K intakes are required for adequate carboxylation of extrahepatic Gla proteins, than what is necessary to maintain coagulation(Reference Vermeer12,Reference Halder, Petsophonsakul and Akbulut15) . Additionally, the need for establishing a dietary reference value for MK separate from PK, contending that the beneficial effects of vitamin K2 are not adequately covered by the current AI, has been argued(Reference Akbulut, Pavlic and Petsophonsakul16). This is also in relation to the absorption, half-life and carboxylation efficiency of vitamin K2 in relation to vitamin K1. Furthermore, the brown meat of brown crab and the hepatopancreas of other crustaceans should be noted as potential sources of contaminants. For brown crab in particular, high contents of cadmium have been reported(Reference Wiech, Frantzen and Duinker50). Therefore, despite the high contents of vitamin K, a cautionary approach should be applied regarding the consumption of brown meat and hepatopancreas. For vulnerable groups such as pregnant women and children, caution is particularly warranted.
Conclusions
The analytical contents of PK, dihydro-K1 and MK-4 to MK-10 in a range of various shellfish species and tissues of varying degrees of processing are described in this paper. Despite considerable variations, the majority of shellfish products contained low contents of total vitamin K (< 10 µg/100 g). High contents of vitamin K were found in the hepatopancreas of snow crab, the brown meat of brown crab, stuffed brown crab shells, pre-packaged blue mussels and blue mussels in brine. In general, the hepatopancreas of crustaceans contained considerably higher contents of vitamin K than their white meat counterparts. Furthermore, compared with other foods recognised as sources of vitamin K, such as meat and dairy products, many of the shellfish products exceeded the contents of total vitamin K found in these foods. This was particularly attributed to a high content of MK, as most shellfish products contained little PK, as highlighted by the insignificant contribution to the AI for adults. Furthermore, the content of vitamin K in blue mussels did not significantly differ between spring and early summer. To the best of our knowledge, this is the first study where shellfish have been extensively analysed for their contents of vitamin K, and as the majority of shellfish species analysed in this study are prevalent and commonly consumed in several regions of the world, these data provide an important contribution to the limited food composition data on vitamin K worldwide. However, we observed considerable variability in vitamin K contents both among and within shellfish species, which may impact the external validity of our results. Consequently, more research should be conducted to explore the substantial variations in the vitamin K contents of shellfish, which may be affected by factors such as geography, season and diet.
Supplementary material
For supplementary material/s referred to in this article, please visit https://doi.org/10.1017/S0007114525000261
Acknowledgements
The authors would like to acknowledge Dr. Mike Zhu for his assistance in creating the map used in this article. Additionally, we would like to express our gratitude to Manfred Torsvik for his efforts in preparing the blue mussels used in the assessment of seasonal variations.
This research received no specific grant from any funding agency, commercial or not-for-profit sector.
A. M. R.: Formal analysis, Investigation, Methodology, Validation, Visualisation, Writing – original draft, Writing – review & editing. K. E. R.: Methodology, Writing – review & editing. I. A.: Supervision, Writing – review & editing. L. M.: Supervision, Writing – review & editing. K. H.: Writing – review & editing. S. H.: Writing – review & editing. E. O.: Methodology, Writing – review & editing. L. D.: Conceptualisation, Funding acquisition, Methodology, Project administration, Supervision, Writing – review & editing.
The authors declare none.


 Open access