The term conjugated linoleic acid (CLA) describes a group of linoleic acid isomers whose double bonds are not separated by a methylene group, but are conjugated. Some of these isomers are present in small amounts in foods derived from ruminant animals(Reference Lin, Boylston and Chang1). In recent years, CLA has received a great deal of attention because of the multiple beneficial health-related effects reported in various animal models, especially with reference to cancer, obesity and atherosclerosis(Reference Martin and Valeille2Reference Pariza, Park and Cook3). Despite these positive effects, adverse effects of CLA such as lipid peroxidation(Reference Riserus, Vessby and Arnlov4), insulin resistance(Reference Riserus, Vessby and Arnlov4–Reference Riserus, Smedman and Basu6), fatty liver(Reference Clement, Poirier and Niot5, Reference Poirier, Niot and Clement7, Reference Tsuboyama-Kasaoka, Takahashi and Tanemura8) and oxidative stress(Reference Riserus, Basu and Jovinge9) remain a matter of concern. Particularly, many studies using the mouse as a model have reported deleterious effects on the liver associated with chronic consumption of the trans-10, cis-12-CLA isomer. These effects are usually accompanied by a dramatic loss of adipose tissue and the development of insulin resistance(Reference Clement, Poirier and Niot5, Reference Poirier, Niot and Clement7, Reference Ide10, Reference Liu, Purushotham and Wendel11). As a result, the liver is one of the main target organs in studies examining the impact of the trans-10, cis-12-CLA isomer on health outcomes.
Not all species are as CLA sensitive as the mouse with regard to liver enlargement and steatosis, and the origin of such a species-specific discrepancy is largely unknown at present(Reference Poirier, Niot and Clement7). Therefore, any complete extrapolation of the mouse findings to man would be inappropriate. The body fat reduction observed in the hamster in response to dietary CLA is not as dramatic as that observed in the mouse, and this effect in the hamster seems to be intermediate between that of mice and man(Reference Bhattacharya, Banu and Rahman12). In addition, unlike mice, consumption of CLA in hamsters brings about a moderate liver enlargement that is not due to fat deposition(Reference de Deckere, van Amelsvoort and McNeill13, Reference Macarulla, Fernández-Quintela and Zabala14). Hence, the hamster model could make new and complementary contributions to our understanding of the effects of trans-10, cis-12-CLA on the liver.
Increased lipogenesis(Reference Poirier, Niot and Clement7, Reference Gavrilova, Haluzik and Matsusue15), inflammation(Reference Diehl16), lysosomal deficiency(Reference Du, Heur and Duanmu17), changes in lipid oxidation(Reference Poirier, Niot and Clement7, Reference Reddy18) and oxidative stress(Reference Robertson, Leclercq and Farrell19) all stand out among the pathways in the liver that may accompany liver enlargement and be affected by trans-10, cis-12-CLA feeding. In the present study, we aimed to determine the expression levels of thirty-six representative genes of these pathways in the liver of hamsters fed a diet enriched with either linoleic acid or two doses of trans-10, cis-12-CLA (0·5 or 1 %, by weight). This is the first study to provide such a comprehensive gene expression pattern in the hamster liver. Gene expression profiling was carried out by the means of multivariate statistical analysis to improve interpretation of the results.
Materials and methods
Animals, diets and experimental design
The experiment, conducted with thirty male Syrian Golden hamsters aged 9 weeks and purchased from Harlan Iberica (Barcelona, Spain), took place in accordance with Spanish guidelines for the use and care of laboratory animals and was approved by the Ethical Committee of the University of País Vasco. The animals were individually housed in polycarbonate metabolism cages (Techniplast Gazzada, Guguggiate, Italy) and placed in an air-conditioned room (22 ± 2°C) with a 12 h light–dark cycle. The experiments were initiated after a 6 d adaptation period.
After the 6 d adaptation period, hamsters were randomly divided into three dietary groups of ten animal each, and each group was fed a designated dose of trans-10, cis-12-CLA as NEFA (0, 0·5 and 1·0 g/100 g diet) in a semi-purified atherogenic diet. The diet consisted of (per kg): 200 g casein (Sigma, St Louis, MO, USA); 4 g l-methionine (Sigma); 200 g wheat starch (Vencasser, Bilbao, Spain); 405 g sucrose (local market); 100 g palm oil (Agra-Unilever, Leioa, Spain); 30 g cellulose (Vencasser), 4 g choline-HCl (Sigma); 1 g cholesterol (Sigma). Trans-10, cis-12-CLA (95 %) was supplied by Natural Lipids Ltd (Hovdebygda, Norway). Vitamin (11 g/kg) and mineral (40 g/kg) mixes were formulated according to AIN-93 guidelines and supplied by ICN Pharmaceuticals (Costa Mesa, CA, USA). The experimental diets were freshly prepared once per week, gassed with N2, and stored at 0–4°C to avoid rancidity. All animals had free access to food and water and were killed in the middle of the dark period.
Sampling
At the end of the experimental period, blood samples were collected under inhalation anaesthesia (diethyl ether) by cardiac puncture. Serum was obtained by centrifugation (1000 g for 10 min at 4°C) and stored at − 80°C until analysis.
Adipose tissue from different anatomical regions (perirenal, epididymal and gluteal subcutaneous) and liver were dissected and weighed.
Serum analysis
Serum cholesterol, TAG and glucose levels were measured by spectrophotometry using commercial kits (BioSystems, Barcelona, Spain). Insulin levels were measured by RIA (Linco, St Charles, MO, USA).
Liver analysis
Total lipids were extracted from the liver following the method described by Folch et al. (Reference Folch, Lees and Sloane Stanley20). The lipid extract was dissolved in isopropanol. Total, non-esterified and esterified cholesterol was determined as previously described(Reference Macarulla, Fernández-Quintela and Zabala14), and phospholipids and TAG were measured by spectrophotometry using a commercial kit (BioSystems, Barcelona, Spain).
Liver glycogen was analysed spectrophotometrically by the method described(Reference McGarry, Kuwajima and Newgard21).
Extraction and analysis of RNA from liver and quantification by real-time polymerase chain reaction
Total RNA was extracted from the livers of the hamsters using Trizol, according to the manufacturer's instructions. The RNA concentration was determined from the absorbance at 260 nm. A quantity of 1·5 μg of total RNA from each sample was reverse-transcribed to cDNA in a final volume of 30 μl by using an iScriptTH cDNA synthesis kit (BioRad).
Gene expression was determined by real-time PCR (Stratagene Mx 3005; La Jolla, CA, USA) using the SYBR Green method(Reference Valeille, Ferezou and Amsler22), quantified using 18S as the reference gene, and expressed as mean normalised expression (MNE) using the qgene application(Reference Simon23). The formula MNE = ErefCTref, mean/EtargetCTtarget, mean (where E is PCR efficiency, CT mean is cycle threshold mean of duplicate or triplicate) was used to transform the cycle threshold unit into a linear unit of normalised expressions. The choice of the oligonucleotide sequences was based on available hamster data, or on the most conserved sequences among mice, and/or rat and/or human aligned sequences when hamster data were missing (see supplementary on-line material Table 1). Primer design was performed with Primer express (Applied Biosystems, Foster City, CA, USA) for quantitative RT-PCR, whenever necessary. Basic Local Alignment Search Tool (BLAST) analysis indicated that there was no similarity with other known hamster sequences when other species were used to obtain primers for unpublished hamster gene sequences.
Statistical analysis
From each group of ten hamsters, we obtained a complete set of results for seven to eight hamsters. Although partial least square (PLS) statistical methods (see explanation below) can handle missing data, hamsters with too many missing genes (expression of over three genes missing per hamster) were discarded. Results are presented as mean values and standard deviations in Tables. Statistical analysis of physiological parameters and gene expression data was performed by one-way ANOVA followed by the Fisher post hoc test, using Statview (SAS Institute, Inc., Cary, NC, USA). Statistical significance was set with a P level at 0·05 (see on-line supplemental Fig. 1).
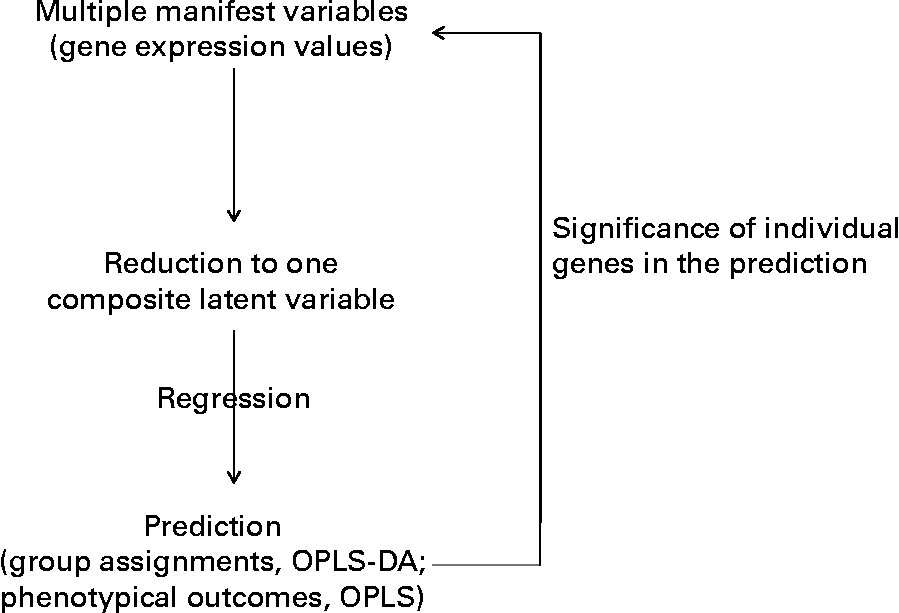
Fig. 1 Outline of the multidimensional statistical analysis. OPLS-DA, orthogonal partial least square-discriminant analysis.
Moreover, an additional multifactorial statistical analysis that took into account the effects of the trans-10, cis-12-CLA on all the genes together was performed. This statistical procedure allowed us to linearly reduce the gene expression profile of each hamster (thirty-six genes or variables) down to one score (one variable) (Fig. 1). We then examined how these scores could predict hamsters' class membership (Y response, for example, dietary treatment), or predict phenotypic outcomes (biochemical assays or tissue weights as Y responses). From this analysis, it was possible to retrospectively determine which of the original RT-PCR variables (gene expression values) had prediction values over all genes that were most consistent with Y. This approach allowed us to identify CLA target genes (Fig. 1).
The concept of megavariate statistics for biological purposes is also depicted in simple concepts by Grainger (DJ Grainger, personal communication; http://www.graingerlab.org/Research/Minireviews/reviews.html), and detailed in Trygg et al. (Reference Trygg, Holmes and Lundstedt24). A similar approach was applied to study the CLA effects on the liver proteome of mice(Reference de Roos, Rucklidge and Reid25). In this approach, all genes were considered collectively with regard to gene expression response to dietary CLA, and not separately, as in ANOVA analysis. The two methods can give rise to some dissimiliarities (see on-line supplemental Fig. 1), but the multivariate analysis appears more appropriate when addressing a multicomponent biological response.
Multivariate statistics were performed using SIMCA P-11 (Umetrix, Umea, Sweden), after centring and unit variance scaling of the data. The characterisation of the effects of CLA on the gene expression pattern was examined by using a projection on latent structure discriminant analysis (PLS-DA), with diet as the class determinant. In addition, we examined the relationships between gene expression (X variables) and phenotypic outcome (Y variables) using PLS regression. These methods are principal component based-methods. We specifically used the orthogonal PLS-DA and orthogonal PLS procedures, which allow for filtering out of the variations among the X variables that are not correlated to Y, thus making the orthogonally treated data more precise and easier to interpret(Reference Trygg and Vold26). The significant relevance of the variables of interest was determined by jack-knifing(Reference Chavance27), using 99 % CI.
The relationships between genes targeted by CLA were then examined by clustering methods, using permutmatrix (www.lirmm.fr/~caraux/PermutMatrix/)(Reference Caraux and Pinloche28), with the Ward method as clustering conditions, and using Euclidian distances. Values were calculated relative to the linoleic acid control hamster values, and log2-transformed to offset skewed distribution.
Results
Physiological parameters
No differences in food intake (6·0 (sd 0·1) g/d in the control group, 5·7 (sd 0·1) g/d in the 0·5 % trans-10, cis-12-CLA group and 5·7 (sd 0·1) g/d in the 1·0 % trans-10, cis-12-CLA group) were observed among the three experimental groups. Although no significant differences in final body weight were found between hamsters fed the CLA diets and those fed the control diet (121 (sd 3) g in the control group, 119 (sd 1) g in the 0·5 % trans-10, cis-12-CLA group and 124 (sd 2) g in the 1·0 % trans-10, cis-12-CLA group), hamsters fed the 1 % CLA diet showed significantly greater final body weight than those fed the 0·5 % CLA diet.
Data describing tissue weights, liver composition and serum parameters are shown in Table 1. Both doses of trans-10, cis-12-CLA led to a significant reduction in adipose fat pad mass and a significant increase in liver size (P < 0·05). With regard to liver lipids, both CLA doses increased non-esterified cholesterol (P < 0·01), whereas only the highest dose significantly increased phospholipids. Both doses decreased the cholesteryl ester concentration (P < 0·01) in liver lipid stores, but the low dose only reduced TAG content (P < 0·05). By contrast, no changes in liver glycogen content were observed in CLA-fed groups. CLA feeding did not modify serum parameters.
Table 1 Tissue weights, liver composition and serum parameters in hamsters fed on the experimental diets for 6 weeks
(Mean values and standard deviations for eight to ten hamsters per group)

CLA, conjugated linoleic acid.
a,b Mean values within a row with unlike superscript letters were significantly different (P < 0·05; one-way ANOVA).
* Adipose tissue mass refers to the sum of epididymal, perirenal and gluteal subcutaneous fat depots.
Gene expression analysis
We selected thirty-six genes in the liver that could be targeted by trans-10, cis-12-CLA feeding and that cover a wide range of biological function (Fig. 2). Two were not significantly detected in the liver (cyclo-oxygenase-2 and PPARγ), and this was not due to a primer failure, as indicated by a validation of the assay.
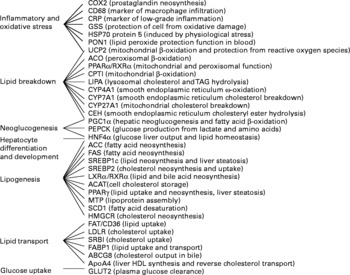
Fig. 2 Gene names and functions, as well as their expression levels in the liver, as determined by real-time PCR. COX2, cyclo-oxygenase 2; CD68, cluster of differentiation 68; CRP, C-reactive protein; GSS, glutathione S-transferase; HSP70 protein 5, heat-shock protein-70 kDa-protein 5; PON1, paraoxonase-1; UCP2, uncoupling protein 2; ACO, acyl CoA oxidase; RXRα, retinoic acid X receptor α; CPTI, carnitine palmitoyl-transferase I; LIPA, acid lipase; CYP4A1, cytochrome P450 4A1; CYP7A1, cytochrome P450 7A1; CYP27A1, cytochrome P450 27A1; CEH, cholesteryl ester hydrolase; PGC1α, PPARγ coactivator 1α; PEPCK, phosphoenolpyruvate carboxykinase; HNF4α, hepatocyte nuclear factor 4 α; ACC, acetyl CoA carboxylase; FAS, fatty acid synthase; SREBP1c, sterol regulatory element binding protein 1c; SREBP2, sterol regulatory element binding protein 2; LXRα, liver X receptor α; ACAT, acylcholesterol acyltransferase; MTP, microsomal transfer protein; SCD1, stearoyl CoA desaturase 1; HMGCR, hydroxymethyl-glutaryl CoA reductase; FAT/CD36, fatty acid transporter/cluster of differentiation 36; LDLR, LDL receptor; SRBI, scavenger receptor type BI; FABP1, fatty acid binding protein 1; ABCG8, ATP binding cassette G8; apoA4, apoprotein A4.
Discriminant analysis showed a significant shift of gene expression upon CLA feeding, allowing for clear group assignment (Fig. 3 and Fig. 4 (a)). From this model we determined which genes were preferentially targeted at 0·5 or 1 % dietary CLA over all genes, by reference to control linoleic acid-fed hamsters. The main responsive genes after CLA feeding were thus identified among the thirty-six genes analysed. The results are displayed as a heat map showing the association (PLS regression values) between gene expression and selected outcomes (Figs. 4 (a), (b) and (c)). The statistical levels were defined by jack-knifing at 99 % of CI. In this situation, twelve genes were especially important for differentiation between the 0·5 % CLA treatment and the control diet (Fig. 4 (a)). Twelve genes were additionally up-regulated when the amount of the trans-10, cis-12-CLA given to hamsters was raised to 1 %. Thus, the most significant gene activation occurred at the 1 % dose, including genes involved in lipid transport, catabolism and synthesis, together with markers of inflammation and oxidative stress (Fig. 4 (a)).
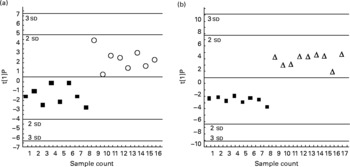
Fig. 3 Orthogonal projection on latent structure-discriminant analysis of the genes expressed in the liver of hamsters given either 0·5 % of linoleic acid (control; ■), 0·5 % of trans-10, cis-12-conjugated linoleic acid (CLA) (○) or 1 % of trans-10, cis-12-CLA (Δ) (by weight). The score plots display the complete separation of the hamsters fed with 0·5 % (a), or 1 % CLA (b), from those fed with linoleic acid. Plots are based on overall gene expression profiles. t[1]P, multigeric score value for individual hamsters.
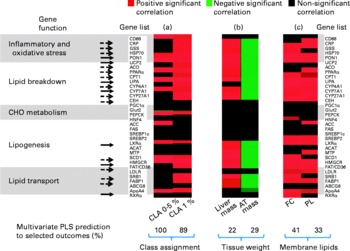
Fig. 4 Heat map displaying the statistical significance of the partial least square (PLS) regression coefficients among individual gene expression and selected outcomes. Significant coefficients (determined by jack-knifing with 99 % CI) are represented as red boxes (for positive correlation), green boxes (for negative correlation) or black boxes (NS). Colour intensity indicates lower (dark) to higher (bright) correlation coefficients. (a) PLS regression coefficients among gene expression and class membership, for example, hamsters fed with 0·5 or 1 % conjugated linoleic acid (CLA) (groups built as dummy dependent variables). (b) PLS regression coefficients among gene expression and tissue masses. (c) PLS regression coefficients among liver membrane lipids. Genes are clustered according to biological functions. Arrows indicate the CLA-responsive genes associated with the observed phenotypic outcomes (––>, genes activated at the 0·5 % CLA dose; [ → ], genes activated at both the 0·5 and 1 % CLA dose). There were eight to nine hamsters per group. CD68, cluster of differentiation 68; CRP, C-reactive protein; GSS, glutathione S-transferase; HSP70, heat-shock protein-70 kDa-protein 5; PON1, paraoxonase-1; UCP2, uncoupling protein 2; ACO, acyl CoA oxidase; CPTI, carnitine palmitoyl-transferase I; LIPA, acid lipase; CYP4A1, cytochrome P450 4A1; CYP7A1, cytochrome P450 7A1; CYP27A1, cytochrome P450 27A1; CEH, cholesteryl ester hydrolase; PEPCK, phosphoenolpyruvate carboxykinase; HNF4, hepatocyte nuclear factor 4; ACC, acetyl CoA carboxylase; FAS, fatty acid synthase; SREBP1c, sterol regulatory element binding protein 1c; SREBP2, sterol regulatory element binding protein 2; LXRα, liver X receptor α; ACAT, acylcholesterol acyltransferase; MTP, microsomal transfer protein; SCD1, stearoyl CoA desaturase 1; HMGCR, hydroxymethyl-glutaryl CoA reductase; FAT/CD36, fatty acid transporter/cluster of differentiation 36; LDLR, LDL receptor; SRBI, scavenger receptor type BI; FABP1, fatty acid binding protein 1; ABCG8, ATP binding cassette G8; ApoA4, apoprotein A4; RXRα, retinoic acid X receptor α; CHO, carbohydrate; AT, adipose tissue; FC, non-esterified cholesterol; PL, phospholipids.
The phenotypic outcomes of the genes with modified expression at the 0·5 and the 1 % trans-10, cis-12-CLA doses were then examined by the means of multivariate PLS regression models. The multivariate gene expression analysis indicated that 22 % of both the liver mass changes and of the adipose fat pad mass were associated with the CLA-induced gene expression in the liver (P < 0·02) (Fig. 4 (b)). Interestingly, the same set of genes that were up-regulated by CLA feeding and that were associated with increased liver mass also corresponded to a decrease of adipose fat mass (Fig. 4 (b)). Specifically, nine out of the twelve genes up-regulated at 0·5 % CLA, and eighteen out of the twenty-four genes up-regulated at 1 % CLA, were associated with changes in liver mass and/or adipose fat pad masses.
We also found some positive relationships between the gene expression pattern and liver membrane lipids, namely non-esterified cholesterol and phospholipids (multivariate prediction coefficient R 2 0·41, P = 0·0018 and R 2 0·32, P = 0·0082 with non-esterified cholesterol and phospholipids, respectively, with 0·5 and 1 % CLA), but not with liver cytosolic stored lipids (non-significant statistical model prediction with TAG and cholesteryl esters) (Fig. 4 (c)). Overall, these genes were related to the oxidant stress defence and to lipid metabolism (breakdown, synthesis and transport). Interestingly, none of the genes involved in carbohydrate metabolism were related to any of the phenotypic outcomes observed.
Pathways of co-regulation were further identified by performing a hierarchical clustering analysis of CLA-targeted genes. This analysis revealed three main gene clusters. One of these was most specifically targeted at the lower CLA dose, and the two others mostly corresponded to the higher dose. These clusters indicate that genes related to lipid uptake, and/or lipid synthesis and lipid breakdown, and the oxidative stress defence pathways were co-expressed (Fig. 5).
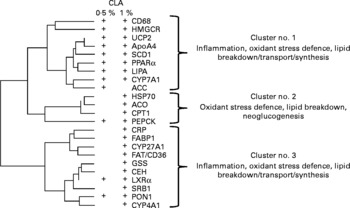
Fig. 5 Hierarchical cluster analysis of the conjugated linoleic acid (CLA)-responsive genes. Calculation was made using the clustering conditions of Ward and Euclidian distances. Data for clustering analysis were calculated from the ratio of gene expression found in linoleic acid-fed hamsters over that in CLA-fed hamsters, and after log2 transformation. Three main clusters can be calculated, in which the physiological functions of the clustered genes are indicated. There were twenty-five hamsters. Genes responsive to either dose as determined in Fig. 3 (a) are shown (+). CD68, cluster of differentiation 68; HMGCR, hydroxymethyl-glutaryl CoA reductase; UCP2, uncoupling protein 2; ApoA4, apoprotein A4; SCD1, stearoyl CoA desaturase 1; LIPA, acid lipase; CYP7A1, cytochrome P450 7A1; ACC, acetyl CoA carboxylase; HSP70, heat-shock protein-70 kDa-protein 5; ACO, acyl CoA oxidase; CPTI, carnitine palmitoyl-transferase I; PEPCK, phosphoenolpyruvate carboxykinase; CRP, C-reactive protein; FABP1, fatty acid binding protein 1; CYP27A1, cytochrome P450 27A1; FAT/CD36, fatty acid transporter/cluster of differentiation 36; GSS, glutathione S-transferase; CEH, cholesteryl ester hydrolase; LXRα, liver X receptor α; SRBI, scavenger receptor type BI; PON1, paraoxonase-1; CYP4A1, cytochrome P450 4A1.
Discussion
The liver is a target organ in the study of the impact of CLA, and especially in the study of the effect of the trans-10, cis-12-CLA isomer on health. Many studies carried out in the mouse model have reported deleterious effects on liver, resulting from the consumption of this isomer. These effects are usually accompanied by a dramatic loss of adipose tissue and the development of hyperinsulinaemia and insulin resistance(Reference Clement, Poirier and Niot5, Reference Poirier, Niot and Clement7). Consumption of CLA in hamsters brings about a less severe liver enlargement than is observed in mice, which is not due to steatosis(Reference de Deckere, van Amelsvoort and McNeill13, Reference Macarulla, Fernández-Quintela and Zabala14). Thus, we studied this species to obtain additional information on the biochemical pathways targeted by the trans-10, cis-12-CLA. Since variation in a given gene does not usually affect a biological process on its own, we analysed the variation of thirty-six genes representative of key metabolic pathways together, in order to obtain a wide display of the possible biological consequences of CLA intake, and to look for dominant effects over minor ones. We primarily used a probabilistic approach, identifying gene expression patterns that were modified by CLA consumption, and assigning this pattern to phenotypic outcomes. Such a wide gene screening of potent biochemical pathways targeted by CLA and influencing hepatomegaly has never been performed in this model.
Our statistical models (PLS regression) predicted that 22–42 % of the overall variation in tissue weight changes or liver biochemical changes were due to CLA feeding. This relative weakness could partly arise from the time-displacement and time-scale that exist between gene, protein, metabolic and physiological events, and the sampling points. These influences may hamper correlation studies(Reference Nicholson, Holmes and Lindon29). Retrospectively, it is likely that several sampling times would have improved the prediction.
Compared with linoleic acid, feeding the two doses of trans-10, cis-12-CLA produced the same physiological effect: a reduction in adipose tissue mass (15–24 %) with a commensurate liver enlargement (21–28 %). Unlike what has been observed in mice, this was not followed by dramatic liver steatosis and hyperinsulinaemia(Reference Poirier, Niot and Clement7). In good accordance with the present study, we and others previously found that liver enlargement in hamsters fed with 0·5 % trans-10, cis-12-CLA was due to hyperplasia (published in Macarulla et al. (Reference Macarulla, Fernández-Quintela and Zabala14) for the hamsters of the present study), with no signs of steatosis(Reference de Deckere, van Amelsvoort and McNeill13, Reference Macarulla, Fernández-Quintela and Zabala14). Indeed, one of the main features that leads to hepatic steatosis in mice fed trans-10, cis-12-CLA is the dramatic increase in hepatic PPARγ and sterol regulatory element binding protein 1c (SREBP1c) due to hyperinsulinaemia, and to the fatty acid synthase gene FAS(Reference Clement, Poirier and Niot5). None of this took place in the present study, as insulin and SREBP1c and FAS gene expression remained unaffected, and PPARγ was undetectable. An additional difference can be accounted for by the efficient lipid oxidation in the hamster, which is impaired in the mouse liver through malonyl-CoA inhibition of the mitochondrial β-oxidation(Reference Degrace, Demizieux and Gresti30). Nevertheless, we did not directly address this inhibition pathway in the present study.
We observed a marker of liver infiltration by potent inflammatory Kupffer cells upon CLA feeding (increase in CD68 gene expression). Such infiltration does not occur in CLA-fed mice (Liu et al. (Reference Liu, Purushotham and Wendel11)). In other situations where this takes place in the mouse model, it has been implicated in liver enlargement and steatosis(Reference Du, Heur and Duanmu17). This was not the case in the present study on hamsters. Another marker of inflammation, C-reactive protein, was found associated with liver enlargement. This effect could occur through CLA-induced adipose tissue inflammation(Reference Heilbronn and Clifton31, Reference Poirier, Shapiro and Kim32) and may be related to observations of higher circulating C-reactive protein levels in human subjects given the trans-10, cis-12-CLA(Reference Riserus, Arner and Brismar33, Reference Smedman, Basu and Jovinge34).
Importantly, the gene activation in the liver that we observed in response to CLA feeding was not only associated with steatosis-free hepatomegaly and adipose fat pad loss, but also with non-esterified cholesterol and phospholipids, which are primarily cell membrane components. This latter observation suggests that the increase in gene expression specifically related to lipid uptake and lipid synthesis may in part participate in the building of new membranes. Lipid degradation (fatty acid oxidation, cholesterol breakdown) would also help in preventing cytosolic accumulation and steatosis. This hypothesis is consistent with the hyperplasia observed in the hamsters of the present study(Reference Macarulla, Fernández-Quintela and Zabala14), thus resulting in liver enlargement. We predict that liver enlargement would increase the organ's total metabolic capacity, potentially allowing it to process the fatty acids derived from the mobilised adipose stores. Doubling the trans-10, cis-12-CLA from 0·5 to 1 % seemed to raise the metabolic rate to a higher level. This is indicated by the number of genes activated and involved in lipid synthesis and breakdown. This number was dramatically increased when the diet was increased from 0·5 to 1 % CLA. In turn, an increase in liver metabolic activity has been suggested to produce reactive oxygen species. This results in the activation of genes involved in the oxidant stress defence as an adaptative response(Reference Cortez-Pinto, Zhi Lin and Qi Yang35, Reference Kohjima, Enjoji and Higuchi36). This was also observed more prominently at the 1 % CLA dose (paraoxonase-1, heat-shock protein-70 kDa-protein 5, glutathione S-transferase, uncoupling protein 2) in the present study. It should be also emphasised that part of the inflammatory/antioxidant stress defence induction in the liver could also be the result of release of pro-inflammatory adipokines, as observed both in vitro (Reference LaRosa, Miner and Xia37) and in vivo (Reference Poirier, Shapiro and Kim32). This has nevertheless not been addressed in the hamsters fed with the trans-10, cis-12-CLA.
Interestingly, the increased potential activity of the reverse cholesterol pathway that we observed at the gene expression level (increased in apoA4, and SR-BI gene expression), may participate in the improvement of atherogenic status that has been reported in hamsters fed with CLA preparations containing trans-10, cis-12-CLA(Reference Mitchell, Langille and Currie38–Reference Wilson, Nicolosi and Chrysam40).
The present results thus provide genomic evidence of the concerted regulation of metabolic pathways in hamsters that were chronically exposed to dietary trans-10, cis-12-CLA. An overview of the present results is summarised in Fig. 6, integrating the changes that can account for the trans-10, cis-12-CLA effects observed in our hamster model at the gene transcription level, and the biochemical and tissue levels. Particularly, trans-10, cis-12-CLA induced a liver enlargement that could improve the metabolic capacities of this organ, in order to process the fatty acids from the mobilised adipose stores. In turn, this overall increase of metabolic activity could trigger inflammation and the oxidant stress defence pathways mainly at the 1 % dose, without improvement in fat loss observed from the 0·5 % CLA dose. The multidimensional statistical approach developed here has opened novel perspectives for understanding the mechanisms by which trans-10, cis-12-CLA could affect pathways related to liver functions. Targeted mechanistic studies are nevertheless required to confirm our findings and hypothesis.
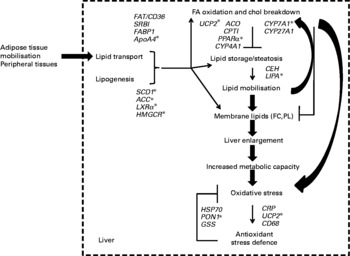
Fig. 6 Summary of the conjugated linoleic acid (CLA) effects on liver outcomes at both doses (0·5 and 1 %) of the trans-10, cis-12-CLA isomer, integrated with associated gene activation. * Genes activated from the lower CLA dose (0·5 %). There were twenty-five observations (hamsters) and twenty-three variables (liver gene expression). FA, fatty acid; chol, cholesterol; FAT/CD36, fatty acid transporter/cluster of differentiation 36; SRBI, scavenger receptor type BI; FABP1, fatty acid binding protein 1; ApoA4, apoprotein A4; SCD1, stearoyl CoA desaturase 1; ACC, acetyl CoA carboxylase; LXRα, liver X receptor α; HMGCR, hydroxymethyl-glutaryl CoA reductase; UCP2, uncoupling protein 2; ACO, acyl CoA oxidase; CPTI, carnitine palmitoyl-transferase I; CYP4A1, cytochrome P450 4A1; CYP7A1, cytochrome P450 7A1; CYP27A1, cytochrome P450 27A1; CEH, cholesteryl ester hydrolase; LIPA, acid lipase; FC, non-esterified cholesterol; PL, phospholipids; HSP70, heat-shock protein-70 kDa-protein 5; PON1, paraoxonase-1; GSS, glutathione S-transferase; CRP, C-reactive protein; UCP2, uncoupling protein 2; CD68, cluster of differentiation 68.
Palm oil was a generous gift from Agra-Unilever Foods España S.A. (Leioa, Spain).
Acknowledgements
The present study was supported by grants from the Ministerio de Ciencia y Tecnología (BFI2002-00 273) and the University of País Vasco (00 101.125-15 340/2003). V. N. has a doctoral fellowship from the Spanish Government (Ministerio de Educación y Ciencia). Part of the experiment was funded by the Institut National de la Recherche Agronomique (INRA) and by the Institut National de la Recherche Médicale (INSERM), France.
M. P. P. and M. T. M. designed the study and contributed to the drafting of the paper. J.-F. L. and A. M. designed the primer database and contributed to the drafting of the paper. D. L. contributed to the drafting of the paper. V. N. did the experimental work, designed the primer database and contributed to the drafting of the paper. J.-C. M. contributed to the design of the study, to the drafting of the paper and performed the statistical analysis.
The authors report no conflict of interest in the present study.
The supplementary material for this article can be found at http://www.journals.cambridge.org/bjn


