Glycaemic index (GI), developed by Jenkins et al.( Reference Jenkins, Wolever and Taylor 1 ), and glycaemic load (GL) have been used as proxy indicators for insulinaemia. The GI represents the postprandial glycaemic increase after consumption of a food with carbohydrates compared with a reference, which is glucose or white bread( Reference Foster-Powell, Holt and Brand-Miller 2 ). The GL was developed to reflect the quality and the quantity of the consumed carbohydrates by multiplying the consumed carbohydrates with their respective GI. The GL is usually considered a better indicator of the postprandial glucose and insulin secretion, because it takes into account the quantities of carbohydrates consumed( Reference Salmeron, Manson and Stampfer 3 ).
Prospective cohort studies usually measure at baseline how often predefined foods are consumed. Using a reference table with GI that were measured for each nutrient during human experiments( Reference Foster-Powell, Holt and Brand-Miller 2 ), and with the weighted sum of consumed carbohydrates from the FFQ, the GI and the GL of a dietary pattern can be calculated. However, many prospective cohort studies assess the nutritional exposure only once in time, that is, at the start of the study, presuming a stability in nutritional consumption during the course of the study. Other prospective cohort studies assess nutritional exposure multiple times during the study, presuming instability in nutritional consumption. This difference in nutritional assessment could influence the relation with an outcome. In the prospective cohort study of Sieri et al.( Reference Sieri, Pala and Brighenti 4 ), after 12 years of follow-up the authors found an increased risk of colorectal cancer associated with a high-GI dietary pattern (RR=1·45; 95 % CI 1·04, 2·03). Nutritional assessment was performed at baseline using FFQ. This is in contrast with the results of Michaud et al.( Reference Michaud, Fuchs and Liu 5 ), who assessed nutritional exposure every 4 years during a prospective study. They found no relation between GI and colorectal cancer.
The aim of the current study is to investigate the reproducibility of GI and GL. To test this reproducibility, data of a prospective cohort study with two nutritional assessments in 2002 and in 2012 were used.
Methods
Subjects
The Flemish Policy Research Centre Sport, Physical Activity and Health collected all the data( Reference Duvigneaud, Wijndaele and Matton 6 ). One aim of the Research Centre was to investigate the relationship between nutritional behaviour, physical health, mental health and physical fitness in an adult population. For this purpose, forty-six Flemish municipalities were selected by clustered random sampling. Within these municipalities, a random sample of men and women between 18 and 75 years of age was selected and invited to participate. Detailed establishment and description of this sample have been given elsewhere( Reference Duvigneaud, Wijndaele and Matton 7 ). Subjects were asked to visit the central test laboratory to have anthropometric measurements taken and to complete questionnaires. A 3-d food record was sent about 2 weeks before their visit to the laboratory, and subjects were requested to bring their completed record on the day of their appointment. The first visit to the laboratory took place in 2002, and the second visit took place in 2012. Of the original 1569 participants in 2002, 562 (36 %) returned for participation in 2012. In general, men and women from the follow-up study had a lower adiposity than the dropouts( Reference Mertens, Deforche and Mullie 8 ). The Ethical and Medical committee of the Catholic University of Leuven (Belgium) approved the study. All participants signed an informed consent form and received information about the tests and measurements.
Dietary assessment
Participants noted all foods and drinks consumed during 2 non-consecutive weekdays and 1 weekend day. The participants were instructed to weigh the amount of foods and drinks consumed. If weighing was not possible, the participants were instructed to estimate the amount of the foods and drinks they consumed by using standard household measures (e.g. a spoon, glass, cup and so on). All information about the food record was included in the 3-d record booklet. Diet records were analysed using the Becel Nutrition software (Unilever Co.). Total energy intake and macronutrients were calculated using quantities of foods and beverages consumed.
The GI of foods was obtained from international tables using white bread as reference( Reference Foster-Powell, Holt and Brand-Miller 2 ). We calculated daily GI by multiplying the GI value of each food item with its carbohydrate content and frequency of consumption, and dividing the sum of these values over all food items by the total amount of carbohydrate consumed. Daily GL was calculated in the same manner but without dividing by the total amount of carbohydrate consumed.
Anthropometric measurements
Anthropometric measurements were performed by trained staff using standardised techniques and equipment according to the International Society for the Advancement of Kinanthropometry( Reference Stewart, Marfell-Jones and Olds 9 ). Participants were measured barefoot and in minimal clothing. Body weight was recorded to the nearest 0·1 kg with a digital balance (Seca 841; Seca GmbH) and body height with a Holtain stadiometer (Holtain) to the nearest 0·1 cm. BMI was calculated using the following formula: BMI=body weight (kg)/(height (m))2.
Statistical analysis
SPSS 21.0 (SPSS Inc.) statistics software was used for data analysis. Mean values and standard deviations were used to describe the characteristics of the participants in 2002 and 2012. Reproducibility and cross-classification between quintiles between the two measurement periods were tested with Pearson’s correlation coefficient for GI and GL. A two-sided 0·05 level of significance was defined. P for trend across the quintiles of GI and GL were estimated by ANOVA.
Results
Characteristics in function of quintiles of GI are presented in Table 1. Means of GI were 63·6 (sd 7·4) and 80·2 (sd 2·9) (P<0·001) for the lowest and highest quintiles in 2002 and 63·7 (sd 3·6) and 79·1 (sd 2·3) (P<0·001) in 2012, respectively. There was no statistically significant difference in age and BMI between the GI quintiles. For both periods, intake of energy was higher for the highest quintile of GI (P<0·001). Energy-adjusted intake of proteins and added sugar was lower for the highest quintiles of GI (P<0·001). For both periods, energy-adjusted intakes of SFA were higher in the highest quintiles of GI (P<0·01).
Table 1 Characteristics of the 562 participants across quintiles of glycaemic index calculated from 3-d food records in 2002 and 2012(Mean values and standard deviations)

* P trend (ANOVA).
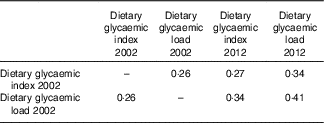
Table 2 presents the Pearson correlation coefficients for GI and GL between 2002 and 2012. The correlation coefficients were 0·27 for GI and 0·41 for GL.
Table 2 Reproducibility of glycaemic index and glycaemic load in 562 middle-aged Belgian adultsFootnote *

* All Pearson’s correlation coefficients were significantly different from zero (P<0·05).
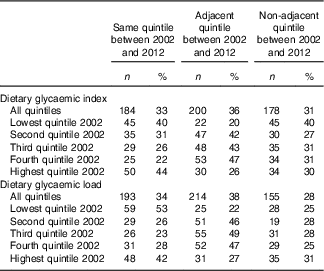
Table 3 presents the cross-classification between 2002 and 2012 for GI and GL. For GI, 33 % of the participants were in the same quintile between 2002 and 2012, and 31 % moved to a non-adjacent quintile. For GL, this was 34 and 28 %, respectively. The lowest and the highest quintiles of GI were the most stable, with 40 and 44 % of the participants staying in the same quintile. This was only 22 % for the fourth quintile. The same tendency was present for GL – that is, the most extreme quintiles were the most stable.
Table 3 Cross-classification of glycaemic index and glycaemic load for 562 middle-aged Belgian adults(Numbers and percentages)

Discussion
This study shows a low 10-year reproducibility of GI and GL, with correlation coefficients below 0·50 and a cross-classification between quintiles, with only one out of three participants staying in the same quintile. This cross-classification was higher for the most extreme quintiles of consumption, that is, the first and fifth quintiles, with more than 40 % of participants correctly classified. This low 10-year reproducibility should be taken into account in prospective cohort studies with only one nutritional assessment at baseline. Many prospective cohort studies do not consider changes in food intake during the observation period, thus assuming that nutritional intakes are stable during follow-up. Our results show that changes in intakes during follow-up do not necessarily depend on amounts consumed at baseline. Relating a specific outcome after 10 years to baseline nutritional assessment can underestimate a possible underlying true relationship between quintiles of GI, GL and the outcome under study, and this is owing to occurring misclassification between quintiles. Multiple nutritional assessments and limiting the analysis to the extreme quintiles of GI and GL will attenuate this misclassification.
Comparing our observed reproducibility of GI and GL with other studies is not evident, because very few studies assess the reproducibility during a long period. Assessing the nutritional exposure with FFQ, Du et al.( Reference Du, van der and van Bakel 10 ) studied the reproducibility of GI and GL on 134 subjects out of 960 invited. They found a crude Pearson’s correlation coefficient of 0·69 for GI and of 0·83 for GL after 6 months. Levitan et al.( Reference Levitan, Westgren and Liu 11 ) found between two FFQ a crude correlation of 0·67 for GL and GI after 6 months among 141 participants out of 790 invited. Murakami et al.( Reference Murakami, Sasaki and Takahashi 12 ), using dietary records on 184 Japanese participants, found a crude correlation between 0·59 and 0·65 for GI and 0·47–0·66 for GL after 1 year. In both studies, with follow-up periods of 6 months to 1 year, the crude correlation coefficients were higher than those observed in our study after 10 years – that is, 0·27 for GI and 0·41 for GL. In our study, nutrition was assessed with dietary records. It can be hypothesised that the nutritional assessment method can influence the reproducibility of GI and GL. However, the correlation coefficients of Levitan et al.( Reference Levitan, Westgren and Liu 11 ) with FFQ and Murakami et al.( Reference Murakami, Sasaki and Takahashi 12 ) with dietary records are comparable. In this study, nutrition was recorded with dietary records, and this is because this assessment tool has a better estimate of dietary intake than the FFQ( Reference Park, Dodd and Kipnis 13 ).
A limitation of this study is that, of the original 1569 participants in 2002, 36 % returned for participation in 2012. However, this participation rate is comparable to the proportions of cohort subjects included in statistical analyses of major prospective studies. For instance, Pan et al.( Reference Pan, Malik and Hao 14 ) included in their analyses 40–45 % of the participants of the Nurses’ Health Studies and the Health Professional Follow-up Study. The aim of our study was not statistical inference of our results to the general population, but to examine the consequences of the variability in ways exposure data are reported and analysed. For this reason, the representativeness of the used sample is of less priority. A strong point of this study is the long follow-up period and the number of participants.
In conclusion, this study shows 10-year correlation coefficients below 0·50. Multiple nutritional assessments and limiting the analysis to the extreme quintiles of GI and GL will limit a possible misclassification owing to the low reproducibility.
Acknowledgements
The authors thank the participants of the study.
This research is accomplished at the Policy Research Centre Sport and funded by the Flemish government. The study funder had no role in the study design; in the collection, analyses and interpretation of data; in the writing of the report; and in the decision to submit the article for publication.
B. D., J. L. and P. C. worked on the original idea for the study. P. M. analysed the data, and drafted the first version of the manuscript, corrected by P. C. All authors read and approved the final version of the manuscript. P. M. is the guarantor. All authors had full access to all data (including statistical reports and tables) in the study and can take responsibility for the integrity of the data and the accuracy of the data analysis.
The authors declare that there are no conflicts of interest.


