In recent years, methane production from the livestock has gained considerable attention due to the significant role of methane in global warming(Reference Johnson and Johnson1). The methane generated from livestock contributes to 19 % of the total methane production from anthropogenic sources(Reference Jouany and Martin2). Fermentation of feeds in the rumen is the largest source of methane from enteric fermentation. In the rumen, methane is produced by archaeal micro-organisms known as methanogens, which utilises predominantly CO2 and hydrogen in the rumen to form methane, thereby maintaining the lower partial pressure of hydrogen in the rumen. This methane production from archaea in the rumen results in a 2–12 % loss of metabolisable energy(Reference Johnson and Johnson1). Therefore, decreasing methane production from ruminants is desirable for reducing the greenhouse gas emission with improved efficiency of digested energy utilisation. The strategies for methane reduction include chemical inhibitors (such as organic acids, oils, ionophores, etc.), feeding diets rich in unsaturated fatty acids and modifying feeding practices(Reference Hegarty3, Reference Sharma4). Among these chemical inhibitors, the halogenated methane analogue, bromochloromethane (BCM), has been used in a few studies to inhibit methanogenesis. This compound is believed to react with reduced vitamin B12 and results in the inhibition of cobamide-dependent methyl group transfer in methanogenesis(Reference Wood, Kennedy and Wolfe5, Reference Chalupa6). Sustained reduction in methane, with improved feed efficiency has been reported with this compound when used in in vivo studies in cattle and sheep(Reference May, Payne and Stewart7); however, so far, no report is available on its effect on different microbial communities and accompanied rumen fermentation characteristics. Therefore, the present study aimed to analyse the effect of BCM on rumen fermentation and microbial community structure in in vitro batch fermentation and continuous fermentation systems. The batch incubation was used to optimise and evaluate the BCM concentration and the continuous fermentation system was used to analyse the persistency of the anti-methanogenic activity of the compound.
Materials and methods
Rumen liquor
The rumen liquor from two rumen-fistulated non-lactating Friesian–Holstein cattle was collected manually by squeezing the feed mat into pre-warmed (approximately 39°C) thermos flasks. The cattle were maintained on a diet containing 2 kg of concentrate mixture and roughage was fed ad libitum, with free access to drinking-water. The concentrate mixture (in g/kg) comprised of rapeseed cake (360), maize (200), wheat (200), molasses (200), and vitamin and mineral mixture (40). The rumen liquor was collected from the cattle just before the morning feed and brought in warm (approximately 39°C) insulated flasks, strained through a 100 μm nylon net and used as the source of inoculum.
Bromochloromethane solution
A stock solution (0·1:0·9, v/v) of BCM (Sigma Aldrich, St Louis, MO, USA) in ethanol was prepared. The stock solution was further diluted with distilled water (0·005:0·995, v/v), and freshly diluted suspension was used in the experiment at concentrations of 5 μm (BCML) and 10 μm (BCMH) in the incubation medium.
Batch fermentation
Method
The in vitro Hohenheim gas test apparatus(Reference Menke and Steingass8) was used according to the protocol of Makkar et al. (Reference Makkar, Blümmel and Becker9). Three sets of syringes, i.e. blank, control and test, were prepared using hay (380 mg) as a substrate in the control and test syringes and not in the blank. BCM was added to the test syringes to give a final concentration of 5 and 10 μm. Each set had its respective blank syringes, with only buffered medium without any BCM and hay (for the control syringe), and one with buffered medium without the hay but containing BCM at 5 and 10 μm concentrations (for the test syringes). The buffered medium (40 ml) containing rumen microbes was dispensed into the syringes and incubated at 39°C for 24 h(Reference Makkar, Blümmel and Becker9). On a single day, each treatment was performed in three syringes and the experiment was repeated on three different days.
Analysis of fermentation characteristics
After incubation for 24 h, the batch fermentation was analysed for gas, methane, SCFA, protozoal numbers and truly degraded substrate (TDS), as described in Goel et al. (Reference Goel, Makkar and Becker10). The values of net gas, net methane and TDS were used for the calculation of methane reduction and the partitioning factor (PF; TDS/net gas produced), as described in Goel et al. (Reference Goel, Makkar and Becker10).
Hydrogen recovery
The hydrogen recovery was calculated as hydrogen consumed/hydrogen produced(Reference Demeyer and Jouany11). The hydrogen produced as fermentation end products and hydrogen consumed to form methane were determined from the amount and molar proportions of acetate (C2), propionate (C3), butyrate (C4), isovalerate (Ci5) and valerate (C5), and methane produced as described in the following:
For example, as in the present study, the net production of SCFA in 24 h was 1·8 mmol with a molar proportion of 0·66 (acetate), 0·22 (propionate), 0·08 (butyrate), 0·0037 (isovalerate) and 0·01 (valerate), and a methane volume of 12 ml (0·4684 mm with a molar concentration of 0·99).
The methane values were converted in mmol as
The values for hydrogen produced and utilised in the fermentation, using the afore-mentioned example, are 1·94 and 1·63, respectively, resulting in 84 % recovery of hydrogen.
Analysis of microbial population
For DNA isolation, an aliquot (1·8 ml) of fermentation fluid from the syringe was taken using a wide-bore pipette, while the contents were being stirred to obtain a homogeneous sample containing plant particles and liquid. The sample aliquots were preserved at − 70°C until analysed. The DNA isolation was carried out using a modified method of Denman & McSweeney(Reference Denman and McSweeney12). Briefly, an aliquot (1·5 ml) from the preserved sample was placed in the 2 ml capacity screw-capped microcentrifuge tube containing 1 g of zirconium beads (0·1 mm; BioSpec Products, Inc., Roth, Karlsruhe, Germany). One millilitre of lysis buffer (0·2 % SDS, 100 mm-Tris–HCl, 5 mm-EDTA, 200 mm-NaCl) was then added and the tubes were placed in liquid nitrogen ( − 196°C) for 1 min. The sample tubes were then thawed at room temperature and vortexed for 2 min. The freeze–thawing step was repeated twice to enhance the efficiency of DNA extraction. Thereafter, the samples were incubated at 4°C for 10 min and then centrifuged at 14 000 g for 15 min at 4°C. The supernatants (0·3 ml in duplicate) were transferred to 1·5 ml capacity Eppendorf tubes and an equal volume of the glass milk (5 g silica in 30 ml guanidine isothiocyanate (3 m), pH 6·0–6·5) was added to it. The tubes were shaken gently for 5 min for allowing the DNA to bind. The glass milk suspension was then centrifuged at 10 000 g for 1 min and then washed with aqueous cold ethanol (70:30, ethanol:nanopore water, v/v). In the final step, the DNA was eluted with 100 μl of PCR grade water (Sigma) and stored at − 20°C until analysis. The purity and concentration of DNA in the extracted sample was determined as A 260/A 280.
The different microbial groups such as total bacteria, total fungi, methanogens, Fibrobacter succinogenes and Ruminococcus flavefaciens were determined in the samples using a SYBR green quantitative PCR assay. The PCR machine used was from Biorad (Veenendaal, The Netherlands; iQ5 Real-Time PCR detection system) with a 96-well plate. The PCR conditions and primers for different communities used were from Denman & McSweeney(Reference Denman and McSweeney12) and Denman et al. (Reference Denman, Tomkins and McSweeney13). The reaction mixture (25 μl) comprised of a SYBR green mix (12·5 μl), primers (forward and reverse, 0·71 μl each), PCR grade water (8·58 μl) and the template (2·5 μl). Total microbial rumen DNA was diluted to a concentration of 10 ng/ml before use in the quantitative PCR assays. The assay was conducted with the following cycle conditions: one cycle at 50°C for 2 min and 95°C for 2 min for initial denaturation; 40 cycles at 95°C for 15 s and 60°C for 1 min for primer annealing and product elongation. The dissociation curve analysis of PCR end products was performed with 71 cycles at 95°C for 1 min, followed by 60°C for 10 s. A negative blank (without the DNA template) was also run for each primer pair. For batch incubations, relative population sizes of R. flavefaciens, F. succinogenes, total rumen fungi and methanogens were expressed as a proportion of total rumen bacterial 16S rDNA at 24 h. The threshold cycle (ΔCt) values were calculated by subtracting the Ct value of the target gene from the Ct value of the reference gene (16S rDNA of total bacteria at 24 h). The relative expression(Reference Denman and McSweeney12) of different groups has been calculated from the ΔCt values as 2− ΔCt. The shifts in microbial communities(Reference Goel, Makkar and Becker14) due to the addition of BCM in the batch system were determined by taking the respective microbial population in the substrate (control) as 100.
Continuous fermentation
System description
The continuous fermenter system(Reference Selje, Hoffmann and Becker15) consisted of six water-jacketed glass vessels (HWS Labortechnik, Mainz, Germany), each having a capacity of 2 litres, with a working volume of nearly 950 ml. The vessels were provided with an outlet at a 45° angle, which allowed the outflow from the fermenter to a 2 litre capacity bottle placed in cold water (4°C). The fermenters were equipped with combined probes for monitoring temperature and pH (Jumo GmbH & Co., Fulda, Germany), stainless steel stirrers and a buffer-providing system. Temperature was adjusted to 39°C by a circulating water-bath linked to a water jacket. Stirring speed and period and buffer inflow rate were controlled individually via a computer program. The pH measurement was carried out with the software Autoferm, provided with the fermenter.
Incubation conditions
The fermentation was carried out for 15 d with a daily addition of hay as a substrate (20 g/d; 10 g each at 09.00 and 17.00 hours). Before inoculation, four fermenters were pre-filled with 600 ml of buffer and a half-day ration of substrate (10 g), and were flushed with CO2. Rumen fluid was collected and processed as described in Section ‘Rumen liquor’ and used as a source of inoculum (300 ml in each fermenter). Rumen buffer solution(Reference Selje, Hoffmann and Becker15) was added continuously at a rate of 1 litre in 24 h, controlled through a computer program. The fermenter liquid was stirred at a slow speed of 60 rpm for 12 min during feeding periods, with an intermittent (after every cycle of 12 min) fast shaking (500 rpm) for 3 s. After a cycle of slow and fast shaking, the fermenter contents were stirred slowly for 1 min in every 30 s. The outflow collected in the 2 litre capacity bottle kept in cold water-bath was sampled and the bottle was emptied every 24 h.
After an adaptation period of 6 d, the fermenters were run for the next 9 d. During this period, two fermenters (F1 and F3) were taken as a control, while in the other two fermenters (F2 and F4), BCM was added once in a day during morning feeding to bring its concentration to 5 μm.
Sampling and analysis
For the analysis of fermentation characteristics after the adaptation period, the samples were withdrawn from the outflow and the fermenter vessel. The sampling was done for 9 d of the experimental period. Some disturbance in the buffer flow was recorded on 2 d and hence the samples collected were not analysed for these 2 d. The protocol followed for different sampling ports is as follows:
(a) Samples from fermenter vessels. On a daily basis, a uniform sample/aliquot (10 ml) from the fermentation liquor was taken directly from the fermenter at 08.45 hours just before the morning feed with a 20 ml wide-bore pipette. Just before taking the aliquot, the contents in the fermenters were shaken thoroughly using the inbuilt stirrers at a fast speed for 15 s. Different aliquots from the withdrawn sample were processed for the determination of SCFA, protozoa and microbial communities as described previously. The sampling was done daily for the whole experimental run of 9 d.
(b) Methane production in fermenters using syringes. It was not possible to measure gas production directly from the fermenters; therefore, the contents were taken from the fermenters and incubated in 100 ml capacity calibrated syringes used in the batch fermentation.
After 2 h of feeding, two 20 ml uniform aliquots of the fermented liquid from the fermenters were taken in pre-warmed (39°C) syringes for gas and methane measurements. An aliquot of 20 ml was incubated along with 10 ml of fresh carbonated bicarbonate buffer for 24 h, while the other was analysed immediately as a 0 h sample (SCFA and substrate incubated at the start of the incubation). The substrate in the syringes comprised of a portion of the feed which came with 20 ml of the aliquot from the fermenters. In order to keep the volume of the fermenter to 1 litre, 40 ml of fresh carbonated bicarbonate buffer was added to each fermenter. After 24 h, the incubated syringe sample was analysed for gas and methane as described in Goel et al. (Reference Goel, Makkar and Becker14).
(c) Samples from the outflow. The volume of the overflow was recorded and the vessel was emptied daily. An aliquot of 30 ml taken from overflow vessels was centrifuged (17 000 g, 20 min) to obtain a pellet. This pellet (undigested feed plus microbial mass) was freeze-dried and weighed. The pellet was digested with neutral detergent solution for 1 h with heating and refluxing to dissolve microbial mass. The undigested residue obtained on the crucible, after thoroughly washing with distilled water, was dried and weight recorded. The weight of this pellet after subtraction from the weight of the pellet obtained after freeze-drying gave the weight of microbial mass in 30 ml of the outflow. The weights of microbial mass and undigested feed so obtained were converted to the total volume of the overflow obtained in 24 h. From these values, the following characteristics were determined:
The per cent true degradability of the feed = ((hay DM added to the fermenter in 24 h minus weight of the undigested feed in 24 h) × 100)/hay DM added to the fermenter in 24 h.
Microbial interactions
The DNA extraction and the quantitative PCR assay was performed as described previously. The effect of BCM on microbial population was evaluated using relative quantification as described under batch incubation. The shifts in microbial communities(Reference Goel, Makkar and Becker14) due to the addition of BCM in the continuous fermentation system were determined by taking the respective microbial population in the control fermenter as 100. The values for the relative expression of different microbial communities for the fermenters running under similar conditions were pooled and subjected to statistical analysis as discussed in the following.
Statistical analysis
The results for gas, methane, SCFA, true degradability and microbial mass efficiency were analysed by a one-way ANOVA using Statistica® software (version 5.1; Statsoft Inc., Tulsa, OK, USA). The differences between means were compared using Duncan's multiple range test (P < 0·05). Dunnett's test was used to compare the microbial population from batch (control syringe v. syringe with BCM) and continuous fermentations (control fermenter v. fermenter with BCM). Significant effects of the addition of BCM on microbial communities were reported at P < 0·05.
Results
Batch fermentation
Gas, methane and true substrate degradability
The results on the effect of BCM on the partitioning of nutrients into gases and microbial mass (PF) are presented in Table 1. There was an increase in the PF value from 3·55 to 3·73 (P < 0·05) in the syringes, where BCM was added at the lower concentration when compared with the control. Similarly, the TDS also did not change significantly (P>0·05; data not shown).
Table 1 Methane production and partitioning factor values on the addition of bromochloromethane in the batch system

x, mg of truly degraded substrate (TDS)/ml gas; z, ml methane produced (m)/mg of truly digested substrate; y, ml net methane/100 ml net gas; MR, methane reduction on a volume basis; MRTD, methane reduction on the basis of TDS.
a,b Values in the same column with different superscript letters are significantly different at P < 0·05.
*BCML = 5 μm; BCMH = 10 μm.
Bromochloromethane significantly (P < 0·05) reduced methane production values when calculated as the proportion of total gas as well as when expressed as methane per unit of TDS when compared with the control. A reduction of 89–94 % in methane was observed on both the volume and TDS basis at both concentrations (Table 1). The methane on a volume basis shows the concentration of methane in the gas released, and the methane on a truly degraded basis is a measure of channelisation of substrate carbon to methane production.
SCFA
The addition of BCM did not influence the total SCFA content (1·77–1·79 mmol/syringe; P>0·05; Table 2). A significant decrease in the acetate:propionate (C2:C3) values, from 2·80 to 2·21 was observed on the addition of BCM (P < 0·05). The molar proportion of different SCFA varied among the treatments, and an unexceptional high concentration of isovalerate was observed in the samples where methane was inhibited using BCM. The molar proportion of isovalerate increased from 0·0019 in the control to 0·021 in the syringes with BCM (P < 0·05).
Table 2 SCFA production and molar proportion of individual fatty acids in the batch system

a,b Values in the same column with different superscript letters are significantly different at P < 0·05.
*BCML = 5 μm; BCMH = 10 μm.
A 92–94 % of hydrogen recovery was observed in the control syringes, while these values were only 58–64 % and 38–40 % in the syringes containing BCM at a concentration of 5 and 10 μm, respectively (Table 2).
Microbial communities
The addition of BCM resulted in complete inhibition of methanogens (Fig. 1) as indicated by their higher Ct values comparable with the negative blank (data not shown). This change was accompanied by a decrease in the R. flavefaciens population by 48 % (P < 0·05). However, a 68 % increase in F. succinogenes (P < 0·05) and a 30 % increase in rumen fungi (P>0·05), relative to the total bacterial population, were observed. There was no change in the protozoal population (49·9 × 103–52·1 × 103/ml, data not shown; P>0·05).
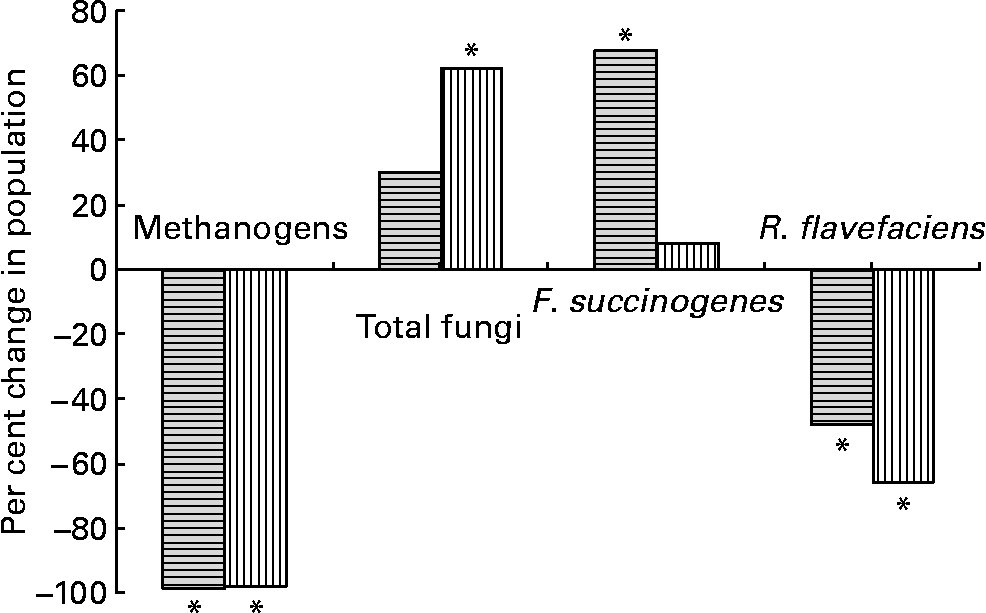
Fig. 1 Per cent changes in microbial population on the addition of bromochloromethane (BCM) in batch (![]() ) and continuous (
) and continuous (![]() ) fermentation systems. *Significant difference in the treatment from their respective controls (P < 0·05).
) fermentation systems. *Significant difference in the treatment from their respective controls (P < 0·05).
Continuous fermentation
The effect of BCM addition on rumen fermentation was studied for 9 d, excluding the 6-d adaptation period. An adaptation time was indicated by irregular fluctuations in the pH, just before the morning feed (09.00 hours), during the first 4 d of incubation (from 6·05 to 7·05). Thereafter, the pH stabilised (between 6·7 and 6·8 just before the morning feed) in all fermenters, indicating the stabilised fermentation conditions (Fig. 2). Daily fluctuations were obtained according to the feeding schedules (09.00 and 17.00 hours) as reflected in pH values. pH dropped steeply (approximately from 6·5 to 6·1) after the morning and afternoon feeding periods with a slight increase in between (approximately 6·0–6·1), and an increase during the night-time to a maximum just before the next morning feed (approximately 6·5–6·6). The outflow turnover from all the fermenters was 1 litre/d.

Fig. 2 Daily fluctuations in the pH at 12 h interval in one fermenter. Arrows with the solid line represent the pH values during the adaptation period, while arrows with the dashed line represent the pH values after adaptation conditions.
Gas and methane production
Gas and methane values were recorded from the contents of fermenters incubated in the syringes (Figs. 3 and 4). The first two values in the figures represent the gas and methane before the addition of BCM. One day before the addition of BCM, the total gas in the syringes from the contents of all fermenters varied between 50 and 52 ml, with methane production values ranging from 10 to 11 ml of total gas in 24 h. After 2 d of the addition of BCM, the gas values declined slightly to 45 ml and thereafter decreased to 35 ml. After 2 d, a decrease of 30 % in the total gas was observed in the syringes with contents of fermenters from F2 and F4. A complete inhibition of methane production (from 12 ml to negligible) was observed in the syringes incubated from contents of F2 and F4 on the following day of the addition of BCM and the effect was persistent during the rest of the fermentation study (P < 0·05). A 9–10 ml methane per ml of the total gas was obtained in the syringes incubated with the content of control fermenters F1 and F3 throughout the run, with a slight change in the total gas from 52 to 48 ml and 52 to 46 ml in F1 and F3, respectively.
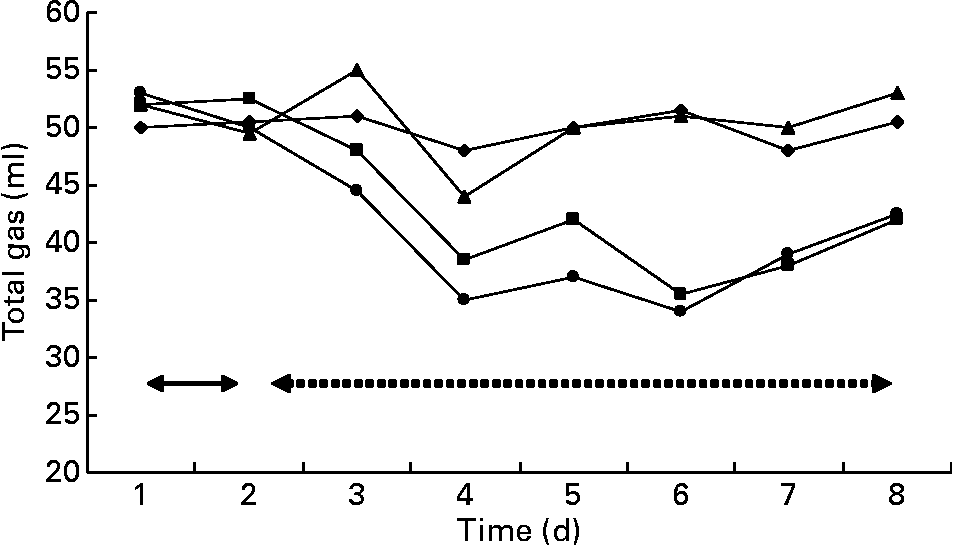
Fig. 3 Gas production in the fermenters (F1 (–♦–) and F3 (–▲–), control; F2 (–■–) and F4 (–●–), added with 5 μm-bromochloromethane (BCM). Arrows with the solid line represent the gas values 1 d before the addition of BCM, while arrows with the dashed line represent the values after the addition of BCM.
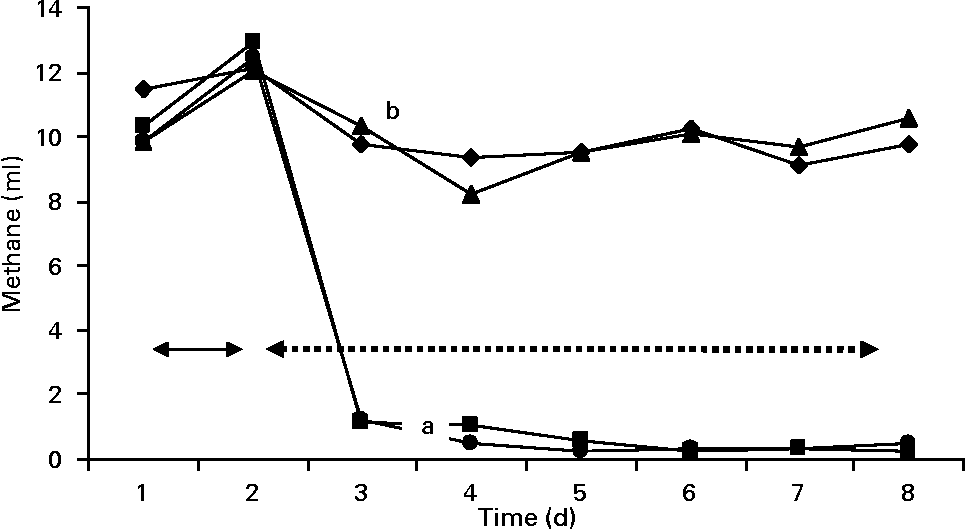
Fig. 4 Methane production values in the fermenters (F1 (–♦–) and F3 (–▲–), control; F2 (–■–) and F4 (–●–), added with 5 μm-bromochloromethane (BCM); the unlike letters represent the statistical differences among the values. Arrows with the solid line represent the value of methane 1 d before the addition of BCM, while arrows with the dashed line represent the methane values after the addition of BCM.
Feed degradability and efficiency of microbial mass synthesis
The values for true degradability of substrate obtained from the outflow of the fermenters ranged from 64 to 67 %, 71 to 74 %, 63 to 70 % and 69 to 72 % for the fermenters F1, F2, F3 and F4, respectively, throughout the study. No difference was observed in the true degradability of substrate in all the fermenters in terms of days as well as in terms of the addition of BCM (P>0·05; Fig. 5). The values for the efficiency of microbial mass produced per unit of digested feed ranged from 0·22 to 0·29, 0·20 to 0·28, 0·27 to 0·29 and 0·22 to 0·27 in the fermenters F1, F2, F3 and F4, respectively (Fig. 6). BCM addition did not affect the efficiency of microbial protein synthesis per unit feed digested (P>0·05).
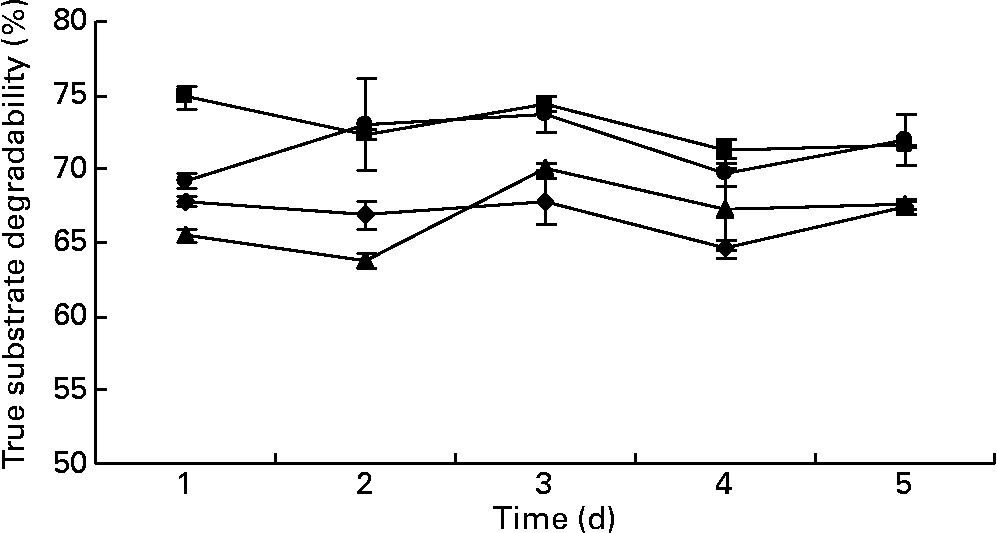
Fig. 5 Effect of bromochloromethane (BCM) on true substrate degradability (%) (F1 (–♦–) and F3 (–▲–), control; F2 (–■–) and F4 (–●–), added with BCM). The error bars represent the standard deviation.
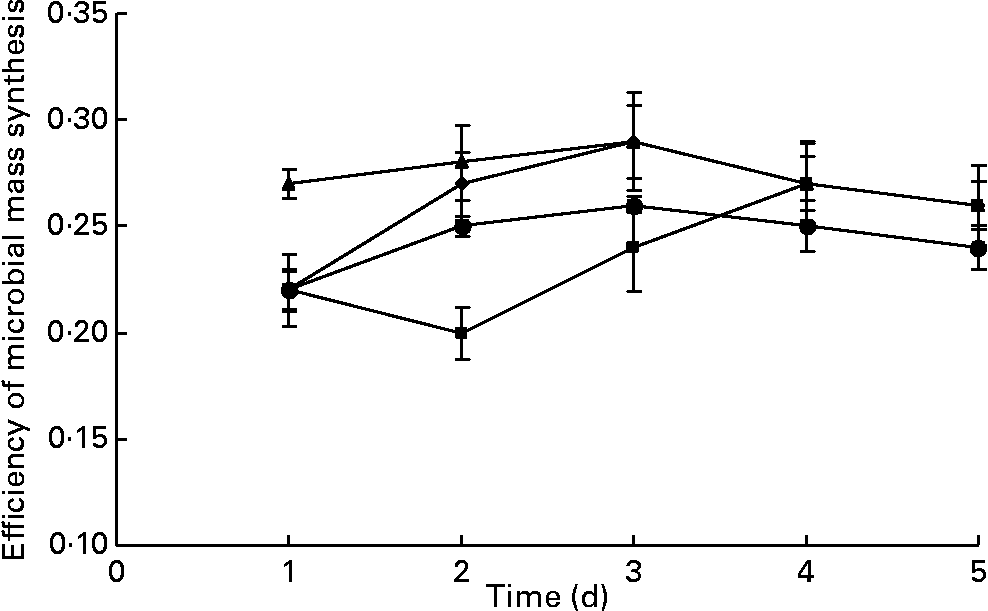
Fig. 6 Effect of the addition of 5 μm-bromochloromethane (BCM) on microbial mass synthesis in continuous fermentation (F1 (–♦–) and F3 (–▲–), control; F2 (–■–) and F4 (–●–), added with BCM). The error bars represent the standard deviation.
SCFA
The total SCFA content ranged from 65 to 87 μmol/ml in the outflow from all the fermenters. There was no difference in the overall content of SCFA in the fermenters as a function of days of incubation or the addition of BCM (P>0·05). The fermenters supplemented with BCM had slightly lower total SCFA contents (Fig. 7). Table 3 represents the mean values for the overall molar proportion of different SCFA in the outflow from all the fermenters in 9 d. There was no effect on the C2:C3 ratio; however, an unexpected increase in the isovalerate concentration was also observed, as was observed in the batch incubation (P < 0·05).
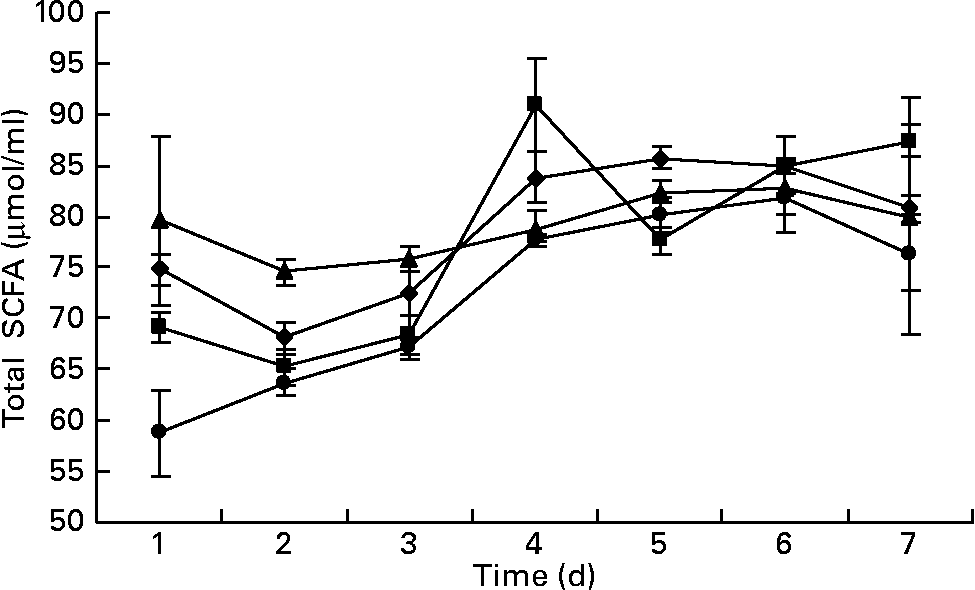
Fig. 7 Total SCFA (μmol/ml) in the fermenters (F1 (–♦–) and F3 (–▲–), control; F2 (–■–) and F4 (–●–), added with 5 μm-bromochloromethane). The error bars represent the standard deviation.
Table 3 Molar proportions of individual SCFA from the outflow of continuous fermenters
(Mean values and standard deviations)

BCM, bromochloromethane.
* Significant differences in the values of control (F1 and F3) and fermenters with 5 μm-BCM (F2 and F4) (P < 0·05).
Microbial interactions in the continuous system
Similar to that in the batch culture system, a complete inhibition of methanogens was observed (P < 0·05). The absolute Ct values obtained for total bacterial population from each fermenter at different days was similar (data not shown), suggesting that there was no change in the bacterial population. The inhibition of methanogens was accompanied by a 66 % decrease in the population of R. flavefaciens (P < 0·05), a 62 % increase in the total fungal population (P < 0·05) and an 8 % increase in F. succinogenes (P>0·05), when compared with that in the control fermenters (Fig. 1). However, the increase in the Fibrobacter population was much lower than that observed under the batch culture system. Similar to that in the batch incubations, there was no effect of BCM on the protozoal population. The protozoal population ranged between 29·13 × 103 and 33·2 × 103/ml in all the fermenters (data not shown; P < 0·05).
Discussion
The results of the present study confirm the anti-methanogenic activity of BCM under the batch and continuous fermentation systems. The novelty of the present study is the effect of BCM on the microbial populations and the persistency of its effects in the continuous fermentation system.
Effect of bromochloromethane on rumen fermentation
The batch incubation was done for 24 h and the continuous fermentation was carried out for 9 d, excluding the days of the adaptation period. In a continuous fermenter, a stable fermentation is normally achieved in 5–7 d(Reference Stanier and Davies16). In the present study, stable pH values in the fermenters were obtained within 6 d of the start of the fermentation.
Gas and methane production
The effect of BCM on methane production in the in vitro fermentation was similar to those reported in other studies(Reference Sawyer, Hoover and Sniffen17–Reference McCrabb, Berger and Magner19). In the present study, using the batch incubation, similar total gas production was observed in the control syringes and the syringes containing BCM; however, in the continuous system, the total gas production decreased after 2 d of the addition of BCM when compared with the control fermenters. This indicates that BCM has a slight negative effect on rumen fermentation under long-term incubation when studied in vitro. Sawyer et al. (Reference Sawyer, Hoover and Sniffen17) reported a significant reduction (85 %) in methane when BCM was fed to lambs. McCrabb et al. (Reference McCrabb, Berger and Magner19) did not observe any adverse effect on rumen fermentation when they administered BCM complexed with cyclodextrin in vivo in steers; however, they observed reduced methane emissions (0 ± 2·4 ml/min compared with 205 ± 5·2 ml/min for the control) for 28 d, leading to the patenting of the compound.
Similar methane reduction values (89–94 %) were obtained in the batch as well as in the continuous fermentation, which clearly indicates that BCM is a potent methane inhibitor at the concentrations tested in the present study. In the present study, we did not observe adaptive response of the methanogens to BCM unlike bromoethanesulfonate when tested against pure cultures of methanogens(Reference Ungerfeld, Rust and Boone20).
SCFA
There was no effect of complete inhibition of methane on the total SCFA content on the addition of BCM in the batch and continuous systems. A reduction in the acetate:propionate molar ratio in the rumen fluid has been described as a common feature of several anti-methanogens(Reference Mohammed, Ajisaka and Lila21, Reference Mwenya, Santoso and Sar22). This indicates a concurrent reduction of methane formation and redirection of hydrogen from methane to reduced SCFA. Similar observations for total SCFA were made by Denman et al. (Reference Denman, Tomkins and McSweeney13) when they fed BCM to steers, resulting in a methane reduction of 59 %. The total mean SCFA concentration was unaffected by the treatments but the acetate:propionate ratio was significantly higher (P < 0·01) in the BCM-treated animals. The branched-chain SCFA, isobutyrate and isovalerate as a percentage of total SCFA were higher (P < 0·01) for the BCM treatment(Reference Denman, Tomkins and McSweeney13).
The imbalance in the relocation of electrons in methane could be suggested as a reason for higher individual molar proportion of butyrate as obtained in the present study. The electrons, which were not consumed in methane, were available for the reduction of NADH that mediates the conversion of acetoacetyl CoA to butyryl CoA and finally to butyrate(Reference Macfarlane and Macfarlane23).
A comparative high concentration of isovalerate was observed on the addition of BCM in both batch and continuous fermentation studies. This increase in isovalerate production may reflect higher degradation of amino acids, as isovalerate is a product of leucine catabolism(Reference Voet and Voet24). The increased degradation of amino acids should result in higher ammonia production from the incubations. In the present study, we did not observe increased ammonia values when compared with the control (data not shown). The possible reasons for this could be the improved ammonia incorporation by rumen microbes (i.e. increased microbial protein synthesis, which is also reflected in higher PF in the batch incubations).
In the present study, the reduction in methane production and the increase in the molar proportion of branched-chain SCFA due to BCM treatment are consistent with those reported by McCrabb et al. (Reference McCrabb, Berger and Magner19). The lowered hydrogen recovery in the syringes with BCM has also been observed by other workers(Reference Rufener and Wolin25–Reference Trei, Scott and Parish27).
Efficiency of microbial protein synthesis
A significant increase in the PF (partitioning of nutrients into gases and microbial mass) from 3·55 to 3·73 in the batch incubation on the addition of BCM indicates improved efficiency of microbial mass synthesis. However, there was no effect on the substrate degradability and the microbial mass produced per unit feed degraded (P>0·05) when BCM was added in continuous fermenters. Sawyer et al. (Reference Sawyer, Hoover and Sniffen17) reported increased digestibility of DM, protein and nitrogen-free extract, when BCM was fed to lambs. The increased energy from these fractions, and that resulting from the decreased methane production, provided a significantly greater quantity of metabolisable energy for all animals when BCM was fed. McSweeney & McCrabb(Reference McSweeney, McCrabb, Takashaki, Young, Kreuzer and Solvia28) suggested that a reduction in methanogenesis in the rumen may affect the feed intake by 0–13 % depending on the dose of the inhibitor, diet and physiological state of the animal. There are contradictory reports regarding the substrate digestibility and feed conversion efficiency when a methane inhibitor was used in in vivo trials. The studies using BCM as an anti-methanogenic agent predicted an increase in the feed conversion efficiency by 0–11 %, as reviewed by McSweeney & McCrabb(Reference McSweeney, McCrabb, Takashaki, Young, Kreuzer and Solvia28). On the other hand, Sawyer et al. (Reference Sawyer, Hoover and Sniffen17) reported a significant reduction in the feed conversion efficiency by 5 % when BCM was fed to lambs. Although no improvements in daily gain were observed when the BCM complex was fed, there were improved efficiencies in feed conversion(Reference McCrabb, Berger and Magner19). No difference in the digestibility of nutrients was observed between the control and BCM (0·04 ml of BCM capsules) when fed to Muzaffarnagari rams(Reference Lalu, Bhar and Mandal29). Denman et al. (Reference Denman, Tomkins and McSweeney13) also reported that BCM fed to steers did not affect the DM intake and mean live-weight gains.
Effect on rumen microbial ecology
The interactions among microbes in complex microbial habitats are often unpredictable and complex. Studies on interactions of methanogens (hydrogen consumers) and other microbial groups (hydrogen producers) have been highly productive, leading to the understanding of the mechanisms behind interspecies hydrogen transfer in some ecosystems(Reference Stieb and Schink30, Reference Muralidharan, Rinker and Hirsh31), although for the rumen system such studies are lacking. In the present study, the inhibition of methane by BCM was accompanied by a complete inhibition of methanogen population. However, these changes did not affect the total bacterial and protozoal populations. A significant negative effect of inhibition of methane production and methanogens was observed only for R. flavefaciens populations in both the batch and continuous fermentations. On the other hand, the BCM induced the proliferation of the Fibrobacter and the total fungal populations. The ruminal methanogens are often associated with protozoa; however, in the present study, we did not observe the inhibition of protozoal numbers, which supports our previous study that the relationship between protozoal numbers and methanogenesis is not obligatory(Reference Goel, Makkar and Becker14).
Guo et al. (Reference Guo, Liu and Zhu32) used bromoethanesulfonate as a methane inhibitor and observed that a 10·4 % decrease in the methanogen population resulted in a 50 % increase in F. succinogenes and a 61·9 % decrease in the total fungal population, with no effect on total bacteria and R. flavefaciens. We observed a significant negative effect on the R. flavefaciens population, which might be due to the increased partial pressure of hydrogen accumulated in the system. This partial pressure of hydrogen has been reported to influence the metabolism of the two important fibre-degrading species(Reference McSweeney, McCrabb, Takashaki, Young, Kreuzer and Solvia28) R. flavefaciens and R. albus, inhibiting NADH oxidation in both species and diverting hydrogen to form other products such as succinate and ethanol(Reference Wolin, Miller, Stewart, Hobson and Stewart33). The adaptive changes in rumen microbial ecology due to a complete inhibition of methanogens are relatively unknown, although the increase in propionate production has been observed in most studies. We observed an increased isovalerate production as a consequence of disruption of interspecies hydrogen transfer. The role of branched-chain fatty acids (isovalerate and isobutyrate) as growth promoters for cellulolytic bacteria is well documented. Allison et al. (Reference Allison, Bryant and Doetsch34) observed that single branched-chain fatty acids can support the growth of certain strains of R. flavefaciens and R. albus, but F. succinogenes requires both a branched- and a straight-chain fatty acid.
Conclusion
In conclusion, BCM is a potent methane inhibitor. In both the batch and continuous fermentation systems, it reduced methane production without affecting the substrate degradability. The complete inhibition of methane resulted in substantial accumulation of hydrogen; therefore, a closer look on the association of methanogens with other microbial communities and interspecies hydrogen-transfer mechanisms among different microbial communities (such as reductive acetogens, not studied here) could explain the mechanism behind these complex microbial interactions. The persistent effects obtained using continuous fermenters in the present study suggest that BCM has the potential for decreasing methane production from ruminants and enhancing productivity. The results of the present study also highlight the importance of the continuous fermenters as an intermediate between batch and in vivo studies. Potential methane inhibitors could be evaluated for persistency of their effects using continuous fermenters, decreasing the cost and time of evaluation for the successful introduction of methane inhibitors in livestock diet.
Acknowledgements
We thank the international Atomic Energy Agency, Vienna, Austria for part financing this work. Excellent technical assistance of Mr Herrmann Baumgartner is also gratefully acknowledged. There are no conflicts of interest.


