Accumulating evidence supports the therapeutic potential of low-glycaemic index (GI) diets in the prevention and treatment of diabetes (Jenkins et al. Reference Jenkins, Wolever, Kalmusky, Giudici, Giordano, Patten, Wong, Bird, Hall and Buckley1987; Salmeron et al. Reference Salmeron, Ascherio, Rimm, Colditz, Spiegelman, Jenkins, Stampfer, Wing and Willett1997a , Reference Salmeron, Manson, Stampfer, Colditz, Wing and Willett b ). Oat is currently advocated as a low-GI food. The GI of various oat products varies between 42 and 80, conventional oat porridge having a value of 58 (Foster-Powell et al. Reference Foster-Powell, Holt and Brand-Miller2002). The low GI of oat has been partially explained by the high content of soluble β-glucan, which is known to blunt the increase in plasma glucose and insulin concentrations after a carbohydrate meal. This is mainly attributed to the delay and lengthening of the carbohydrate absorption time due to an increase in viscosity and a decrease in the starch digestion rate (Battilana et al. Reference Battilana, Ornstein, Minehira, Schwarz, Acheson, Schneiter, Burri, Jequier and Tappy2001).
Fat is well known to lower the glycaemic response to foods (Collier & O'Dea, Reference Collier and O'Dea1983; Welch et al. Reference Welch, Bruce, Hill and Read1987). Compared with most other cereal products, oat contains a considerable amount of fat (approximately 7 %) (Anonymous, 2005, 2006). Fat may also indirectly affect the results of the GI test, as the enzymatic analysis of available carbohydrate is usually influenced by high fat content.
We hypothesised that the low GI of oat could at least partially result from its fat content. We first carefully measured the available carbohydrate content in oat and wheat and then tested the glycaemic response to porridge made from conventional and defatted rolled oat, and compared it with similar products made from whole wheat alone and in combination with oat fat.
Subjects and methods
Subjects
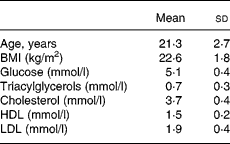
Nine healthy males with fasting glucose, triacylglycerol and cholesterol concentrations within the recommended values, and with no family history of cardiovascular diseases or diabetes, were recruited for the study (Table 1). During the study, one subject showed increased fasting glucose values, and was excluded from the data. Informed consent was obtained from each participant. The study protocol was approved by the Ethical Committee of the University Hospital of Turku.
Table 1 Fasting clinical data of subjects participating in the study (n 8) (Mean values and standard deviation)

Test meals
Each subject received four test meals in a random order. The study sessions were arranged with 2–7 d intervals. The products were porridge made from rolled oat (O) (Helsingin Mylly, Vaasa, Finland), rolled defatted oat (DO), rolled whole wheat (W) (Raisio, Raisio, Finland) and rolled whole wheat and oat fat (WF). All grains were organically produced. DO was produced from O by industrial scale CO2 extraction which efficiently extracts non-polar fat (Aromtech, Tornio, Finland), and the extracted oat fat was combined with W to produce WF. Each portion contained 50 g of available carbohydrate. The fat contents of the portions were 6·1 g (O and WF), 1·9 g (DO) or 1·8 g (W). The porridge was prepared just minutes before consumption in a microwave oven by cooking an appropriate amount with 500 ml of water first at full power (700 W) until it began to boil, followed by 2 min at 300 W.
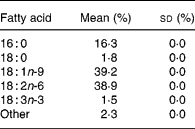
The fat content of W, O and DO was measured by modified Folch extraction (Folch et al. Reference Folch, Lees and Sloane Stanley1957). The available carbohydrate was measured with an amyloglucosidase/thermostable α-amylase method (AACC 76·13) (Total Starch, Megazyme, Bray, Ireland) from W and from O exhaustively defatted by chloroform–Soxhlett extraction. Protein was measured by the Kjeldahl method from W and O using 5·83 as the conversion factor. Carbohydrate and protein content of the other raw materials was derived by calculation from the values of O and W. The nutrient content is presented in Table 2. Oat oil fatty acid methyl esters were produced with boron trifluoride (Morrison & Smith, Reference Morrison and Smith1964) and analysed by GC-FID (Perkin-Elmer Autosystem, Boston, MA) with a J&W DB23 column (60 m × 0·32 mm id, 0·25 μm film (Agilent, Folsom, CA)) (Table 3).
Table 2 Nutrient composition of the raw materials and portions consumed (Values are presented as the mean (and standard deviation) of three analyses per 100 g of product)

W, wheat; WF, wheat+oat fat; O, oat; DO, CO2-defatted oat.
* Derived from W.
† Derived from chloroform–Soxhlett-defatted oat.
‡ Derived from O.
Table 3 Fatty acid composition of oat fat Values are presented as the mean (and standard deviation) of three analyses

Study design
Subjects were asked to avoid strenuous exercise for 48 h prior to the test, and were provided with a standardised medium-fat meal for consumption on the evening before the test day. Subjects attended the trial site at 08.00 after a 12 h fast. An intravenous cannula was placed in a forearm vein and a basal blood sample was drawn (0 min). Each day, the test meal was served at the same time (08.00–08.30) with instructions to eat it within 10 min. Additional blood samples were taken at 30, 60, 90, 120 and 180 min. Plasma was immediately separated by centrifugation. Triacylglycerol and glucose were determined by enzymatic colorimetric methods (Roche Diagnostics, Mannheim, Germany) using an automated instrument (Hitachi 917 Automatic Analyzer, Hitachi, Tokyo, Japan). Plasma insulin was measured using time-resolved fluoroimmunoassay (Wallac, Turku, Finland). The incremental area under the curve (iAUC) from 0 to 120 or to 180 min was calculated using the trapetzoidal method (Matthews et al. Reference Matthews, Altman, Campbell and Royston1990) by excluding the area below baseline, and was expressed as pmol/h per litre (insulin) or mmol/h per litre (glucose). For triacylglycerol, similar calculations were made, but as the incremental values were mostly negative, the area below the baseline was included (mmol/h per litre).
Statistical analysis
In this randomised double-blind trial, each subject consumed four test meals and served as his own control. Paired samples t test (with Bonferroni correction) was used for testing the differences in plasma time points, time series and iAUC. A statistical difference of P < 0·05 was deemed significant. Analyses were carried out with SPSS (Chicago, IL, USA). Values are expressed as the mean of eight determinations. All data were log-transformed prior to analysis.
Results
The fat content of W, O and DO were 2·1 % (sd 0·1), 6·4 % (sd 0·1) and 2·1 % (sd 0·2), respectively. The available carbohydrate and the Kjeldahl protein for W and O were 57·6 % (sd 1·2) and 12·5 % (sd 0·0), 52·4 % (sd 1·5) and 13·1 % (sd 0·2), respectively (Table 2).
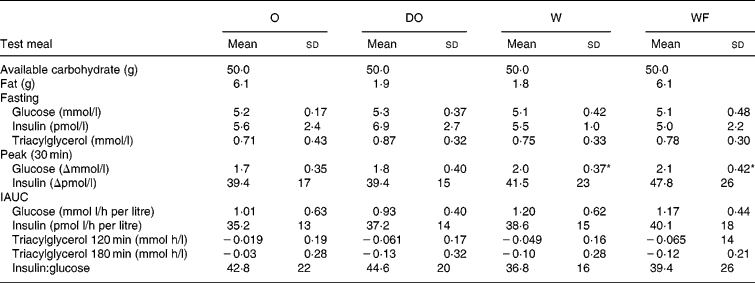
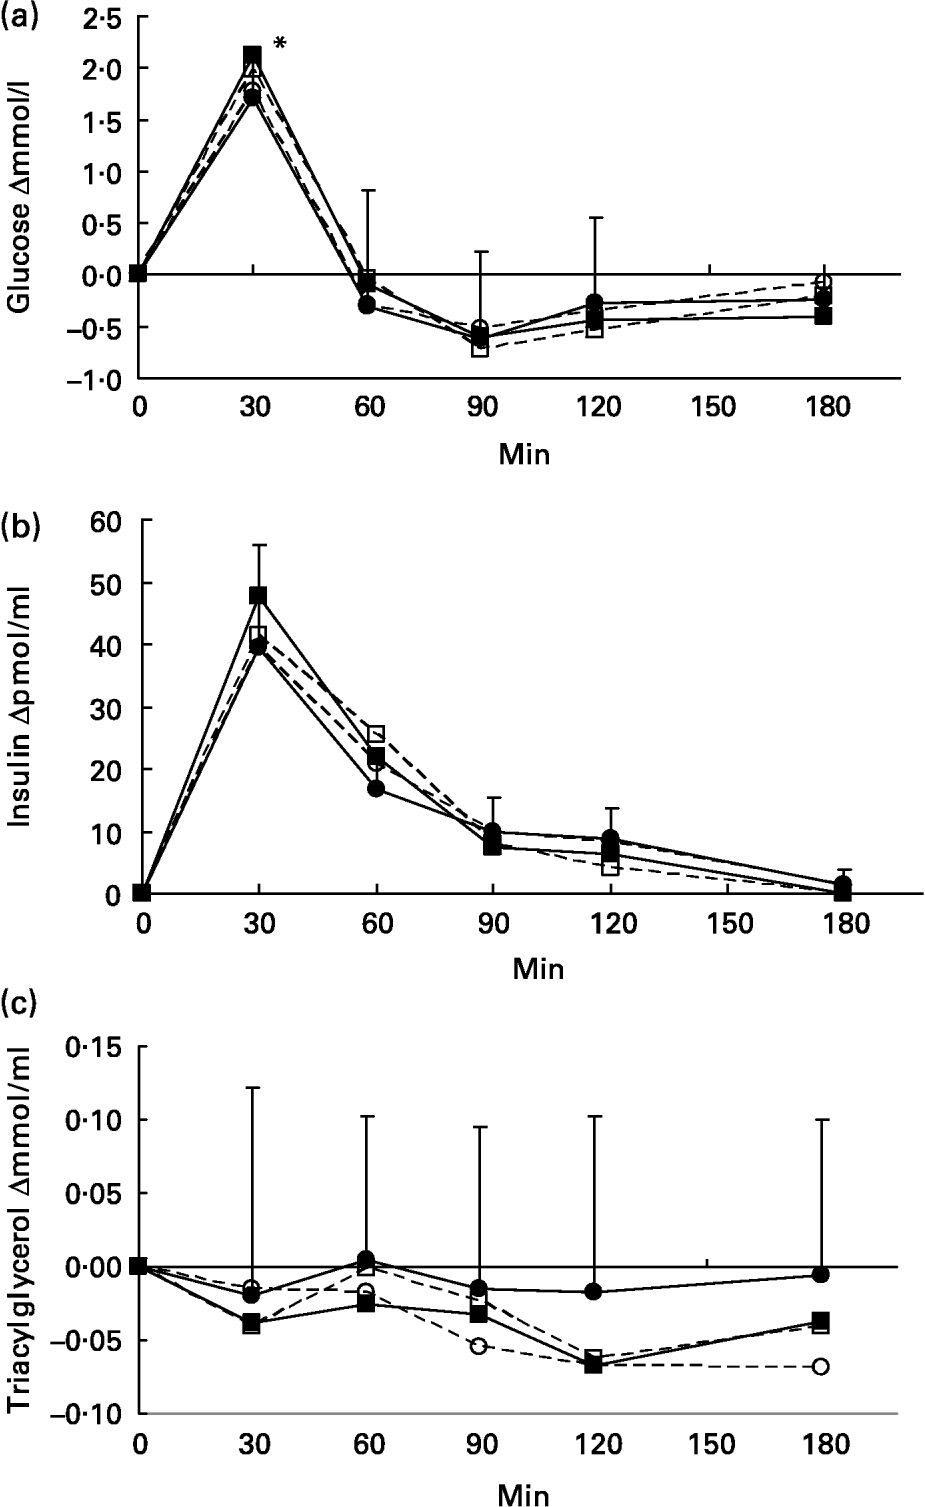
Fasting and postprandial plasma contents of glucose, insulin and triacylglycerol are given in Table 4. Incremental responses to the meals are shown in Fig. 1. All the products caused a similar rapid increase in glucose and insulin, with a peak at 30 min in all but five cases (one subject for glucose and four subjects for insulin had a peak at 60 min). W and WF caused a higher glycaemic peak at 30 min than O (P = 0·006), but no difference was found at later time points. Insulin concentrations did not differ at any of the time points. Neither the iAUC of glucose or insulin nor the corresponding insulin:glucose ratio differed between any of the test meals.
Table 4 Metabolic responses of eight healthy males to porridge meals with 50 g of available carbohydrate and approximately 1·9 g (W, DO) or 6·1 g (O, WF) of fat (Mean values and standard deviation)

W, wheat; WF, wheat+oat fat; O, oat; DO, CO2-defatted oat; iAUC, incremental area under the curve.
* Significantly different from O (P = 0·006).

Fig. 1 Blood glucose (a), insulin (b) and triacylgycerol (c) increments after the test meals. Values are presented as a mean of eight subjects. Standard deviation is depicted for O only for the sake of clarity. - - □ - -, wheat; –●– oat; - - ○ - -, CO2-defatted oat; –■–, wheat+oat fat. *Wheat and wheat+oat fat differ significantly from oat (P = 0·006).
For the triacylyglycerol concentration, there were no statistically significant differences in the time points or in the iAUCs. However, the triacyglycerol concentration after DO were consistently lower than those after O.
Discussion
Oat is appreciated as a low-GI food, with a current GI value of 58 (oat porridge) (Jenkins et al. Reference Jenkins, Wolever, Taylor, Barker, Fielden, Baldwin, Bowling, Newman, Jenkins and Goff1981; Foster-Powell et al. Reference Foster-Powell, Holt and Brand-Miller2002). Ever since Jenkins introduced GI as a basis for carbohydrate exchange in 1981, it has been acknowledged that the addition of fat to the carbohydrate load slows gastric emptying and reduces the glycaemic response (Jenkins et al. Reference Jenkins, Wolever, Taylor, Barker, Fielden, Baldwin, Bowling, Newman, Jenkins and Goff1981). However, the role of the relatively high fat content of oat in its low GI has not been studied.
We found that lowering the fat content of oat to the level of that of wheat did not change the glycaemia or insulinaemia following the ingestion of 50 g of oat carbohydrate (glucose and insulin iAUC for O and DO were 1·01 (sd 0·63) and 35·2 (sd 13), 0·93 (sd 0·40) and 37·2 (sd 14), respectively). This is in contrast to several studies demonstrating that fat can lower the glycaemic response to foods (Welch et al. Reference Welch, Bruce, Hill and Read1987; Collier et al. Reference Collier, Greenberg, Wolever and Jenkins1988; Gannon et al. Reference Gannon, Nuttall, Westphal and Seaquist1993b ). However, >15 g of fat has generally been required for a significant decrease, when at least 50 g of carbohydrates is consumed (Gatti et al. Reference Gatti, Noe, Pazzucconi, Gianfranceschi, Porri, Testolin and Sitori1992; Normand et al. Reference Normand, Khalfallah, Louche-Pelissier, Pachiaudi, Antoine, Blanc, Desage, Riou and Laville2001; Owen & Wolever, Reference Owen and Wolever2003). Unsaturated fats have been shown to be especially effective in blunting the glucose response (Gatti et al. Reference Gatti, Noe, Pazzucconi, Gianfranceschi, Porri, Testolin and Sitori1992), but in our study the highly unsaturated oat fat did not show this effect. An important finding of the present study was thus the observation that when 4·2 g of fat (69 % of total) is removed from a standard 50 g portion of oat carbohydrate, the postprandial glycaemia is not affected. It seems likely that the low GI of oat does not result from its fat content.
Further support for the observed no-effect level was obtained from the addition of 4·2 g of oat fat to wheat, which did not result in any statistically significant change in glucose or insulin iAUC or peak concentration. The potentiation of insulin secretion by the co-ingestion of fat is well established (Collier & O'Dea, Reference Collier and O'Dea1983; Collier et al. Reference Collier, McLean and O'Dea1984; Gannon et al. Reference Gannon, Ercan, Westphal and Nuttall1993a , Reference Gannon, Nuttall, Westphal and Seaquist b ), but in healthy subjects it has only been shown with substantially higher fat loads (37·5 g) (Collier et al. Reference Collier, McLean and O'Dea1984) than used in the present study. With non-insulin-dependent diabetic subjects, the addition of 15 g of fat has sufficed (Gannon et al. Reference Gannon, Ercan, Westphal and Nuttall1993a ). In the present study, the WF insulin peak at 30 min was approximately 15 % higher than that of W, but the difference was not statistically significant. Venous blood yields glycaemic and insulinaemic results similar to those of capillary blood (Jackson et al. Reference Jackson, Blix, Matthews, Morgan, Rubenstein and Nabarro1983; Wolever et al. Reference Wolever, Jenkins, Collier, Lee, Wong and Josse1988), but the latter has better accuracy and enables the detection of a smaller difference (Granfeldt et al. Reference Granfeldt, Hagander and Bjorck1995) by reducing the within-subject variation (Wolever et al. Reference Wolever, Vorster, Bjorck, Brand-Miller, Brighenti, Man, Ramdath, Granfeldt, Holt and Perry2003). It is therefore possible that the observed levels of glycaemia could have been statistically significantly different, if capillary samples had been collected in the present study.
The difference between the glucose iAUC of O and W was not statistically significant. This is in line with the study by Granfeldt et al. (Reference Granfeldt, Hagander and Bjorck1995) on kernel porridges. Heaton et al. studying the effects of rolled cereal porridges, found that oat evoked smaller glucose and insulin responses than wheat (Heaton et al. Reference Heaton, Marcus, Emmett and Bolton1988). A likely explanation for the discrepancy lies in the dosage; utilising the analysis of available carbohydrate, we, like Granfeldt et al. (Reference Granfeldt, Hagander and Bjorck1995), used doses of between 83 and 95 g (both in agreement with the current Finnish Food Composition Database (Anonymous, 2006)), whereas studies utilising carbohydrate by deduction have used clearly lower portion sizes, varying between 69 and 73 g (Jenkins et al. Reference Jenkins, Wolever, Jenkins, Thorne, Lee, Kalmusky, Reichert and Wong1983; Heaton et al. Reference Heaton, Marcus, Emmett and Bolton1988; Miller et al. Reference Miller, Pang and Bramall1992). It should be noted, however, that the oat:wheat iAUC ratio in the present study (1·19) is in line with the corresponding oat and wheat porridge GI ratio (from 1·14 to 1·28) (Foster-Powell et al. Reference Foster-Powell, Holt and Brand-Miller2002). Although the overall responses did not differ, the peak glycaemia was higher after both W and WF compared with O.
The differences in triacylglycerol concentration after the different fat loads were contradictory. Reduction of the fat content of oat resulted in a consistently lowered triacylglycerol concentration (though without a statistically significant difference), whereas manipulation of wheat with oat fat did not seem to change the lipaemia. However, the magnitude of increments in triacylglycerol concentration was very low, and thus of no practical relevance. This was expected, since 15 g or more fat has to be consumed to produce detectable changes in postprandial lipaemia (Dubois et al. Reference Dubois, Beaumier, Juhel, Armand, Portugal, Pauli, Borel, Latge and Lairon1998).
In conclusion, with 50 g of available carbohydrate from O or W, their overall glycaemia and insulinaemia did not differ, but the peak value was significantly lower after O. We found that 4·2 g of fat dosed with 50 g of cereal carbohydrate does not affect the glycaemic or insulinaemic responses and has only a minimal effect on the subsequent postprandial triacylglycerolaemia. The role of fat in high-fat, low-GI products should be further investigated because of the well-known deleterious effects it may have on the blood lipids and on the risk of coronary artery disease.


