The growing burden of obesity is primarily related to environmental changes occurring over the last decades. However, not all people are affected equally by the deleterious effects of the obesogenic environment, whereas others carry genetic variants rendering them particularly sensitive to it(Reference Blakemore and Froguel1). The genetic understanding of common obesity has increased during recent years. The fat mass- and obesity-associated (FTO) gene identified in 2007 was the first locus unequivocally associated with BMI, and, to date, large-scale genome-wide association studies have identified more than fifty genetic loci to be robustly associated with obesity-related traits(Reference Frayling, Timpson and Weedon2–Reference Heid, Jackson and Randall9). Interestingly, the genetic regulation of body fat distribution apparently involves loci that are largely distinct from those that influence BMI(Reference Heid, Jackson and Randall9). The effect sizes of the established loci are rather small. Only a few studies have investigated how the combined loci contribute to obesity risk and whether these loci can be used to improve the prediction of obesity or how these genes interact with different environmental exposures. The prospective study design provides an ideal approach to investigate the gene–environment hypothesis that a healthy diet can (partially) overcome genetic susceptibility to obesity.
In the present study, we investigated the effects of twenty-six BMI and fourteen waist:hip ratio (WHR) susceptibility variants on obesity and on 1- and 3-year weight change in the Finnish Diabetes Prevention Study (DPS). In addition, we investigated whether dietary intake and physical activity could modulate genetic effects on obesity. The effects of the variants were studied individually and in combination by calculating a genetic risk score (GRS).
Subjects and methods
Study population
The Finnish DPS was a clinical trial with five participating centres in Finland. Details of the DPS study design, methods and procedures have been published(Reference Eriksson, Lindström and Valle10–Reference Lindström, Louheranta and Mannelin12). The main aim of the DPS was to assess the efficacy of an intensive diet and exercise programme to prevent or delay the onset of type 2 diabetes among high-risk individuals with impaired glucose tolerance. The main inclusion criteria were BMI over 25 kg/m2 and age from 40 to 64 years. A total of 522 subjects were randomly assigned to an intensive diet and exercise counselling (n 265) or to a control (n 257) group. There were no differences at baseline in laboratory or anthropometric characteristics between the randomisation groups. The main goals of the intervention group were weight reduction ≥ 5 %, moderate intensity physical activity ≥ 30 min/d, dietary fat < 30 % of total energy, saturated fat < 10 % of total energy and fibre ≥ 15 g/4184 kJ ( ≥ 15 g/1000 kcal). To estimate how successfully these goals were achieved, each intervention goal was graded (0 = not achieved, 1 = achieved) at the 1-year follow-up and the ‘success score’ from 0 to 5 was computed as the sum of the grades(Reference Lindström, Peltonen and Tuomilehto13). Success in achieving the intervention goals was estimated from food records and exercise questionnaires collected at the 1-year examination.
The most intensive intervention was carried out during the first year of the study, and the study was terminated after a mean follow-up of 3·2 years at which time the risk of diabetes had been reduced by 58 % in the intervention group compared with the control group(Reference Tuomilehto, Lindström and Eriksson11, Reference Lindström, Louheranta and Mannelin12). In the present study, the baseline, 1-year and 3-year data were examined. Anthropometric measurements were performed at baseline and at the annual visits. The present study was conducted according to the guidelines laid down in the Declaration of Helsinki, and all procedures involving study participants were approved by the Ethics Committee of the National Public Health Institute in Helsinki. All participants volunteered for the study and gave their written informed consent.
Anthropometric measurements
Detailed methodologies for all measurements performed in the DPS have been described previously(Reference Eriksson, Lindström and Valle10). Weight and height were measured in light clothing, and BMI was calculated as weight (kg)/height (m2). Waist circumference was measured midway between the lowest rib and the iliac crest, and hip circumference over the great trochanters. The WHR was then calculated.
Assessment of dietary intake and physical activity
The study participants completed a 3 d food record at baseline and before each annual study visit(Reference Lindström, Louheranta and Mannelin12, Reference Lindström, Peltonen and Eriksson14). They were asked to write down everything they ate and drank using a picture booklet of portion sizes of typical foods as the reference. The completeness of the food records was checked at a session with the study nutritionist during the study visit. Nutrient intake was calculated with a dietary analysis program developed at the National Public Health Institute(Reference Ovaskainen, Valsta and Lauronen15). In the present study, the average/median intakes at baseline and at the 1-, 2- and 3-year follow-ups were used in the statistical analyses. The number of the available food records was 453, 447, 421 and 382, respectively.
Physical activity was assessed at baseline by the validated Kuopio Ischaemic heart disease Risk Factor Study 12-month Leisure-Time Physical Activity questionnaire(Reference Lakka and Salonen16). The questionnaire provides detailed quantitative information on the duration, frequency and mean intensity of the most common lifestyle and structured leisure-time physical activity as recalled over the previous 12 months.
Genotyping
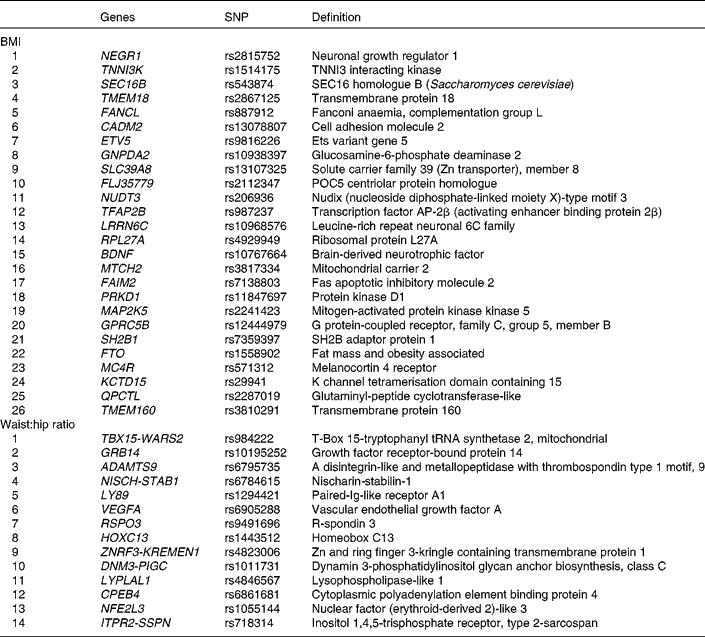
Genotypes of forty SNPs (Table 1), comprising twenty-six risk SNPs for BMI and fourteen risk SNPs for WHR, were obtained by genotyping the Metabochip(Reference Voight, Kang and Ding17), a custom Illumina© iSelect array which assays approximately 200 000 SNPs identified through genome-wide meta-analyses for metabolic and atherosclerotic/CVD and traits.
Table 1 BMI and waist:hip ratio related single nucleotide polymorphisms (SNPs) that were genotyped

Of the 522 study subjects in the Finnish DPS, 479 gave permission for the genetic analysis, and were genotyped for the Metabochip. After genotyping, twenty individuals with missing genotype data (one SNP or more) were excluded, resulting in a total of 459 study subjects (153 men and 306 women).
Statistical analyses
Statistical analyses were performed using the IBM SPSS Statistics for Windows 19.0 (SPSS, Inc.). Data are presented as means and standard deviations. P <0·05 was considered as statistically significant. Normality of variable distributions was tested with the Kolmogorov–Smirnov test or by plotting the residuals of each statistical test. Logarithmic transformation was successfully used to improve normality when necessary.
Genotypes were coded 0, 1 or 2 according to the number of published BMI/WHR-increasing alleles (resulting in a score ranging from 0 to 52 for BMI and 0 to 28 for WHR). The BMI/WHR-increasing alleles were weighted by their effect sizes published earlier (Tables 2 and 3) (Reference Speliotes, Willer and Berndt7, Reference Heid, Jackson and Randall9). The GRS was created by summing the number of BMI- or WHR-increasing alleles weighted by their effect size to estimate the total BMI- or WHR-increasing effect. The GRS was included in the statistical models as a continuous score, and in the figures the GRS is illustrated as divided into tertiles.
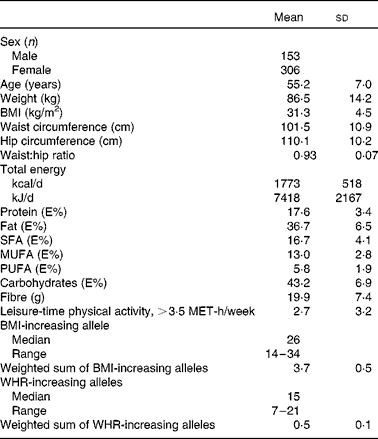
Table 2 Basic characteristics of the Finnish Diabetes Prevention Study participants at baseline (Mean values and standard deviations)

E%, percentage of energy; MET, metabolic equivalents; WHR, waist:hip ratio.
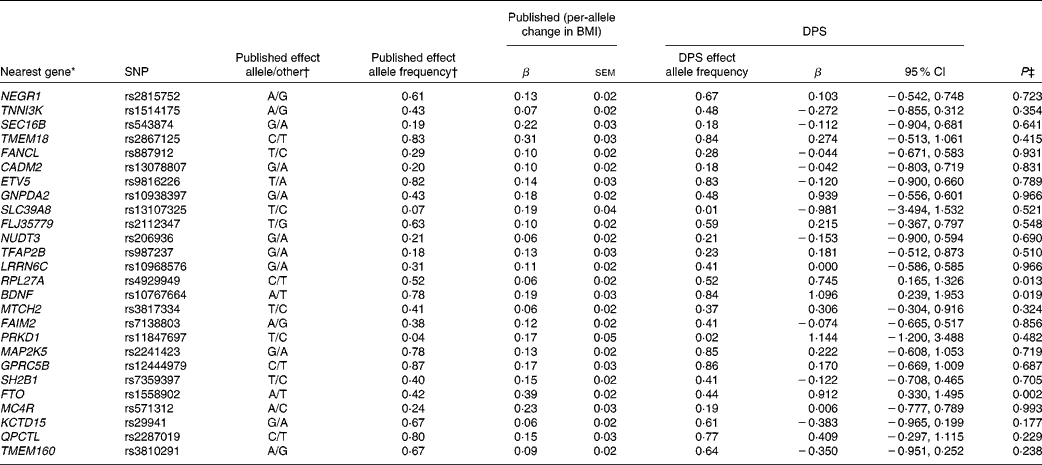
Table 3 SNPs associated with BMI, published effect alleles, allele frequencies, published effect sizes, β and 95 % CI for per-allele associations with baseline BMI in the Finnish Diabetes Prevention Study (DPS) (β Values, standard errors and 95 % confidence intervals)

* For definition of genes see Table 1.
† Speliotes et al. (Reference Speliotes, Willer and Berndt7).
‡ Univariate general linear model, unadjusted for ln-transformed values.
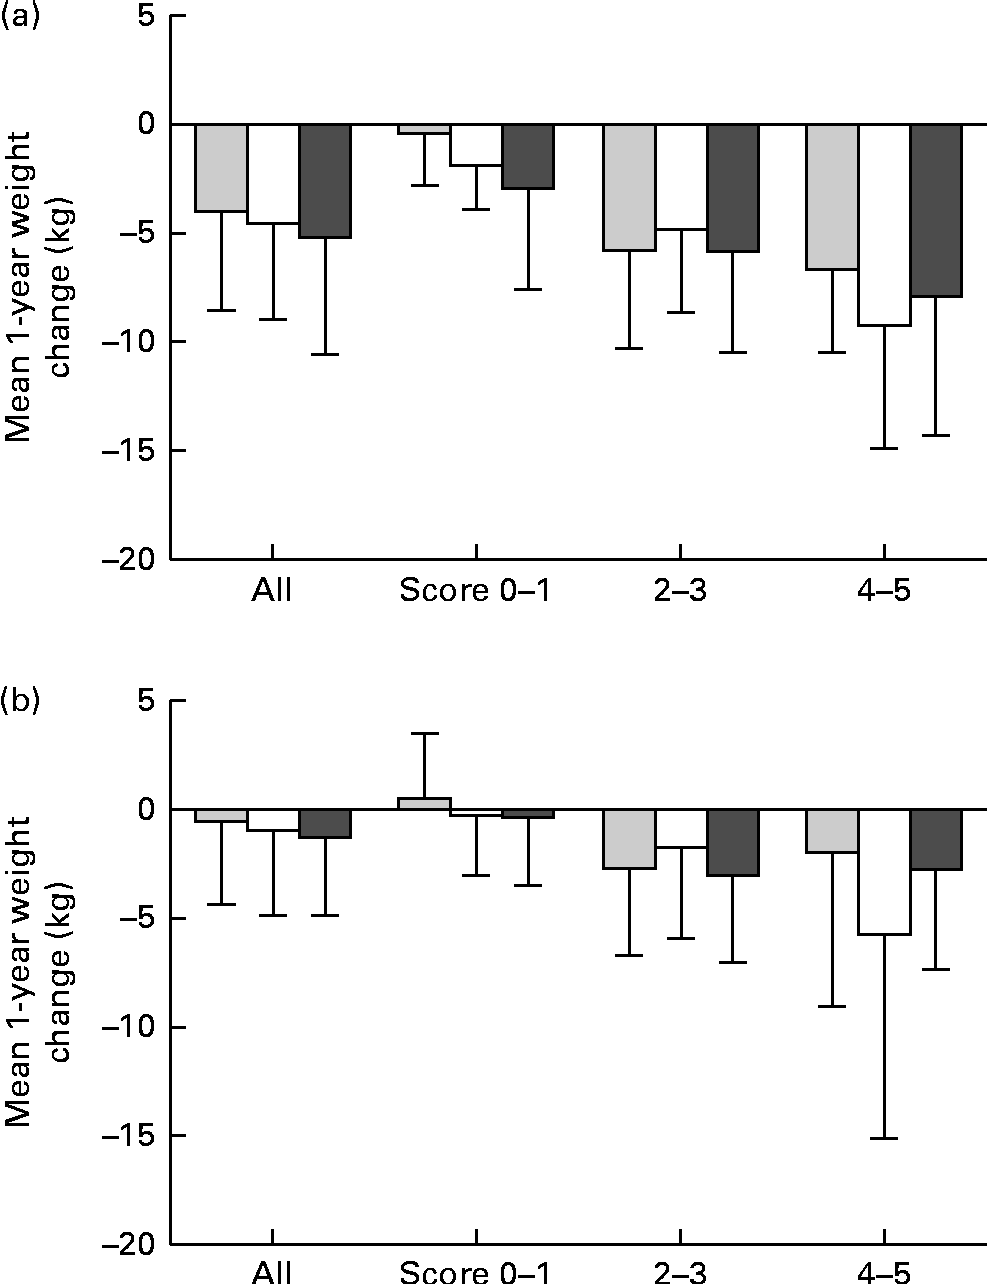
Univariate general linear model analyses were used to study the effect of the genotypes (Tables 3 and 4) and GRS (Table 5) on obesity-related traits. The genetic associations were analysed assuming an additive genetic model. The mean 1-year weight change by the GRS and intervention success scores (Fig. 1(a) and (b)) was analysed by the univariate general linear model. In addition, a separate analysis for multiple linear regression was used to assess the influence of BMI/WHR-related SNP, age, sex and intervention on the variation of BMI or WHR change during the first year. Since in the first model including all variables, sex was a significant predictor, regression analyses were also performed separately by sex.
Table 4 SNPs associated with waist:hip ratio (WHR), published effect alleles, allele frequencies, published effect sizes, β and 95 % CI for per-allele associations with baseline WHR in the Finnish Diabetes Prevention Study (DPS) (β Values, standard errors and 95 % confidence intervals)

* For definition of genes see Table 1.
† Heid et al. (Reference Heid, Jackson and Randall9), β values combined (discovery+follow-up).
‡ Univariate general linear model, unadjusted.
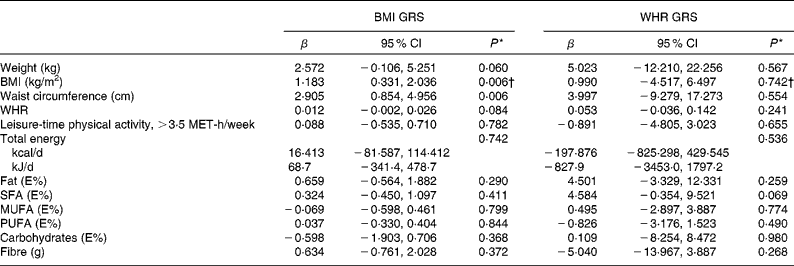
Table 5 Associations between BMI- and waist:hip ratio (WHR)-related genetic risk scores (weighted on effect sizes) and weight, BMI, waist circumference, WHR, leisure-time physical activity and dietary intake at baseline (β Values and 95 % confidence intervals)

GRS, genetic risk scores; MET, metabolic equivalents; E%, percentage of energy.
* Univariate general linear model, unadjusted.
† ln-transformed.

Fig. 1 (a) The mean 1-year weight change in (a) the intervention group and (b) the control group of the Finnish Diabetes Prevention Study (DPS) and by the genetic risk score (GRS) groups and by the achieved success scores. Scores 0–1, 2–3 and 4–5: P for interaction = (a) 0·176 and (b) 0·436. ![]() , GRS, first tertile; □, GRS, second tertile;
, GRS, first tertile; □, GRS, second tertile; ![]() , GRS, third tertile.
, GRS, third tertile.
A linear mixed model was used to assess the mean 3-year weight change by the GRS (Fig. 2 and Fig. S1 (available online)).

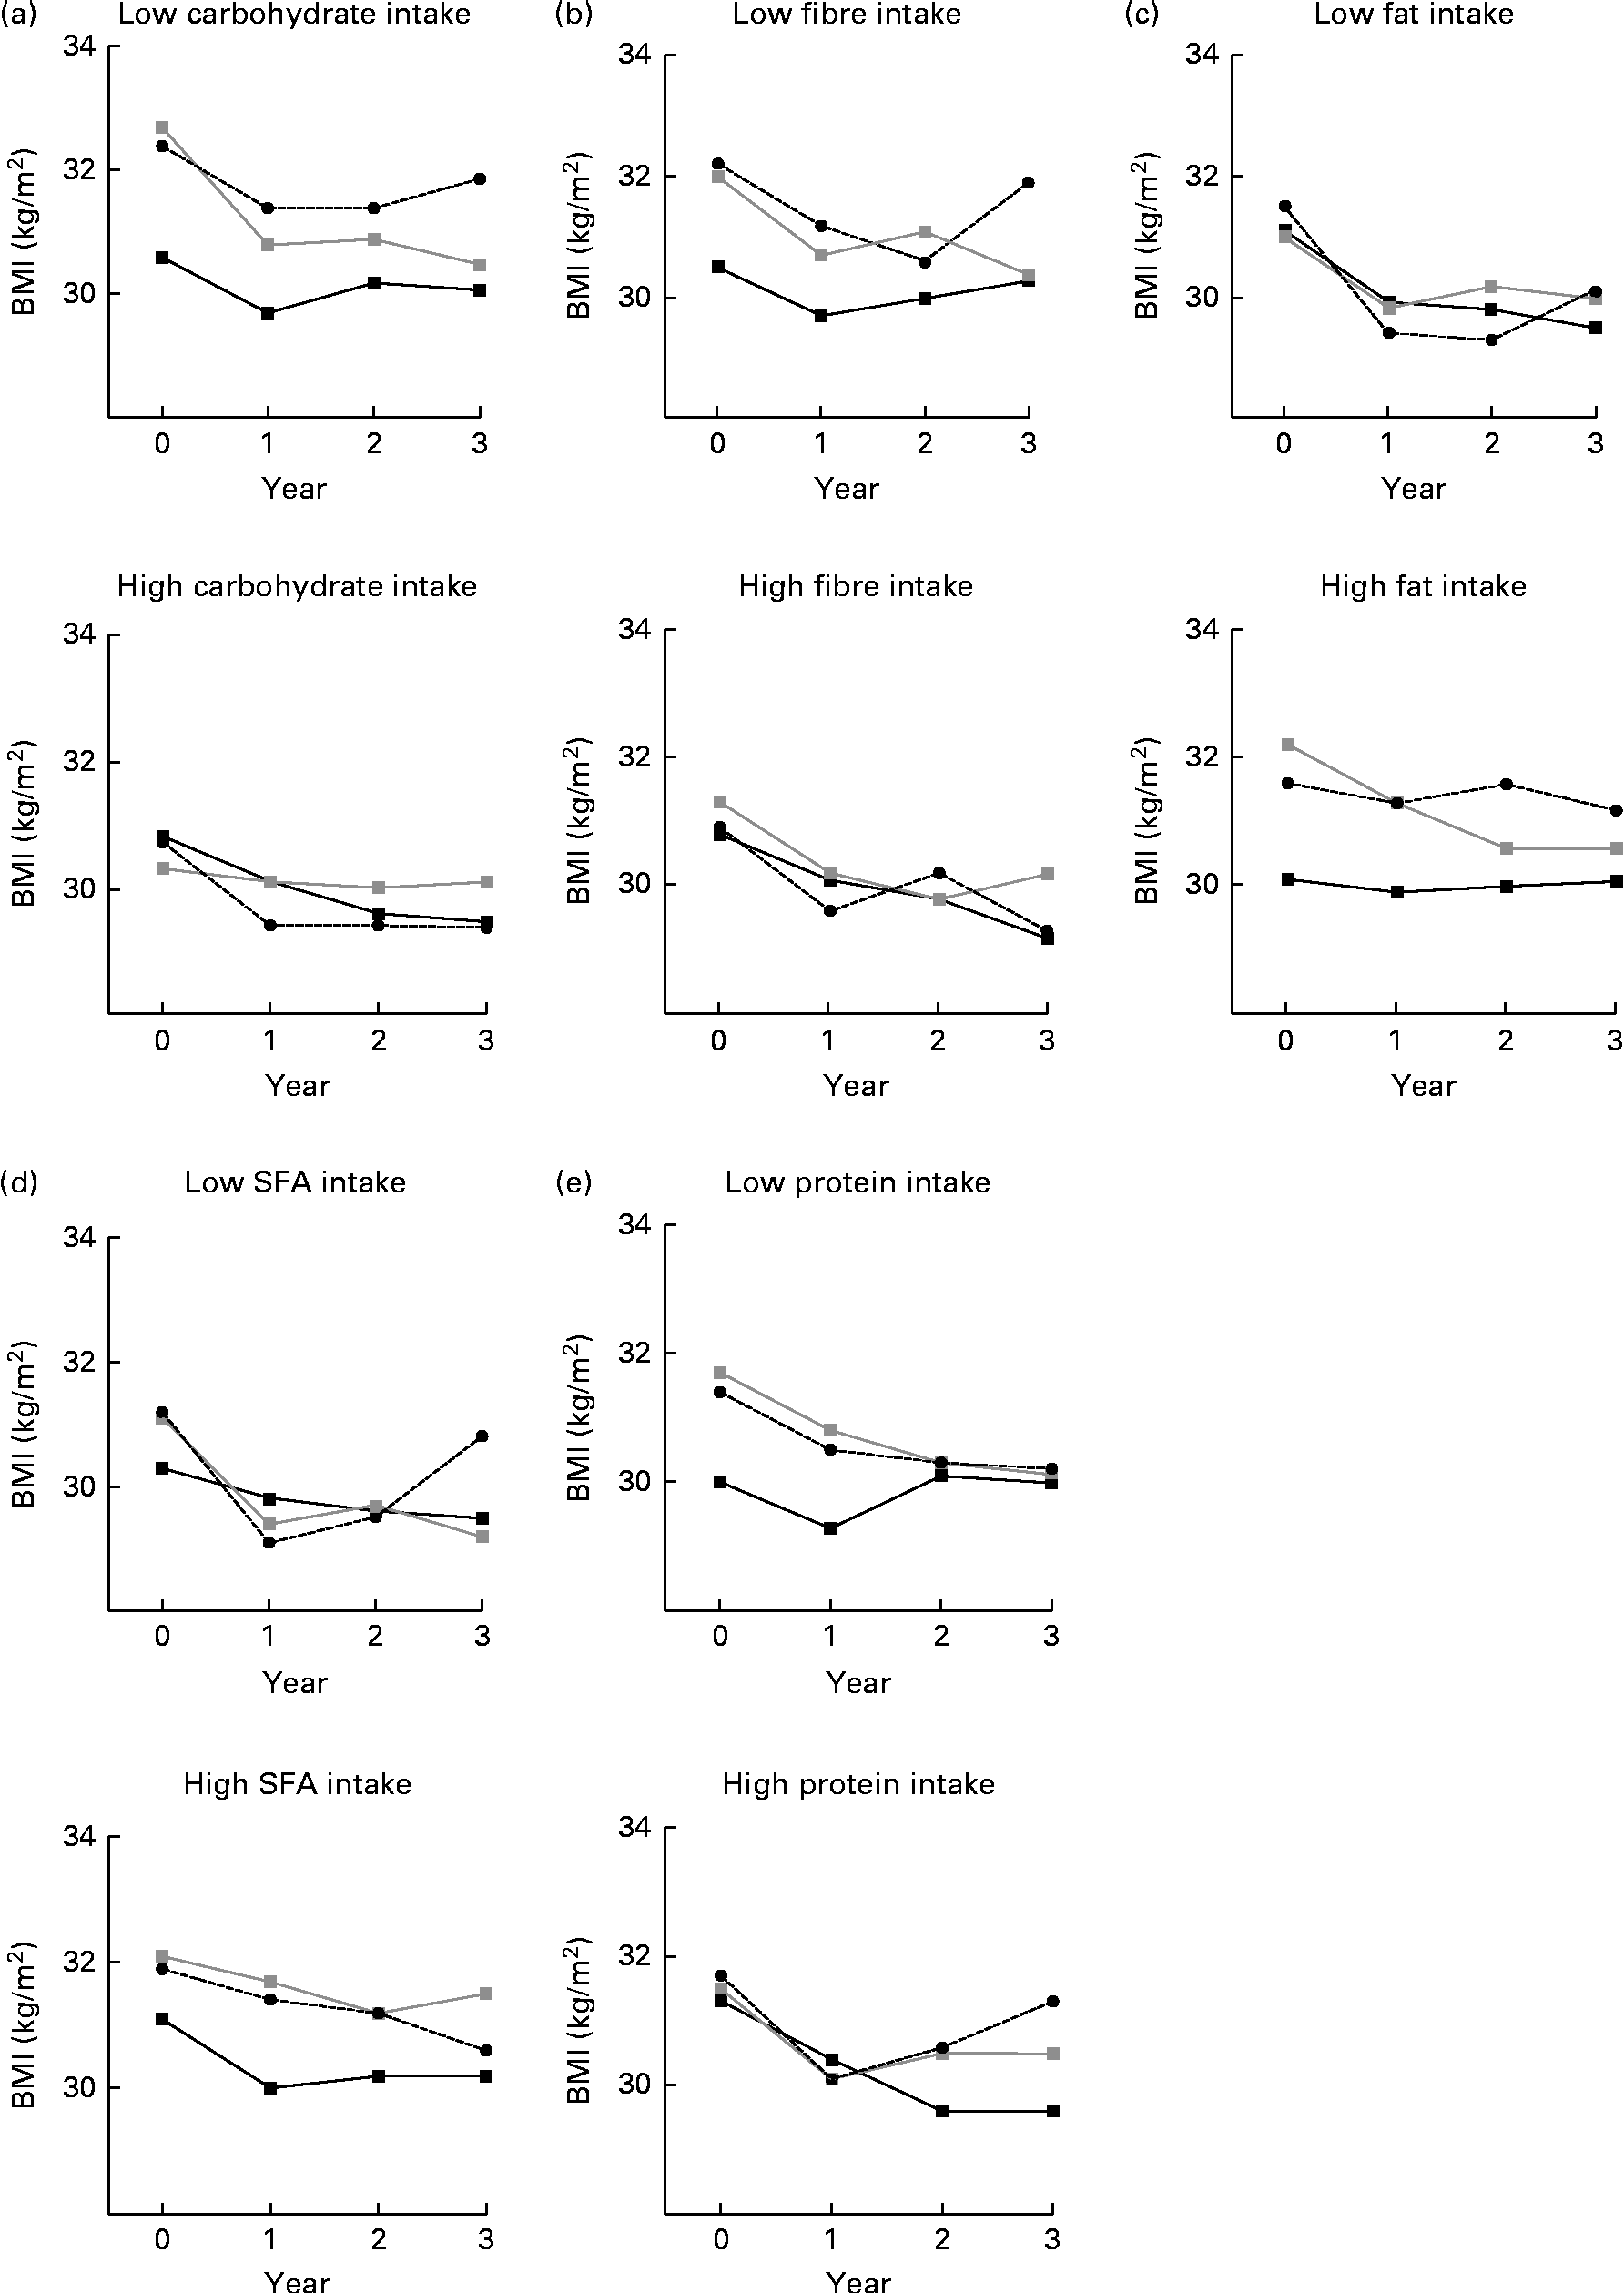
Fig. 2 BMI by (a) carbohydrate, (b) fibre, (c) fat, (d) SFA and (e) protein intake (low, high) and by BMI genetic risk score (GRS) during the 3-year follow-up. Analyses are adjusted for age, sex and randomisation group. The GRS was included as a continuous variable in the model. P for interaction = (a) 0·775, (b) 0·065, (c) 0·605, (d) 0·004 and (e) 0·479. (a) P= 0·072 (low) and P= 0·400 (high); (b) P= 0·051 (low) and P= 0·158 (high); (c) P= 0·240 (low) and P= 0·101 (high); (d) P= 0·034 (low) and P= 0·215 (high); (e) P= 0·099 (low) and P= 0·050 (high). ![]() , GRS, first tertile;
, GRS, first tertile; ![]() , GRS, second tertile;
, GRS, second tertile; ![]() , GRS, third tertile.
, GRS, third tertile.
Results
BMI- and waist:hip ratio-associated SNPs at baseline
The summary of the basic characteristics of the Finnish DPS participants at baseline are presented in Table 2. All genetic markers were consistent with Hardy–Weinberg equilibrium (P>0·0001). The BMI-associated SNPs, published effect sizes, allele frequencies and associations with baseline BMI are presented in Table 3. At baseline, FTO (P =0·002) associated with BMI and the differences in BMI by the FTO genotype have been reported previously in detail(Reference Lappalainen, Tolppanen and Kolehmainen18). Furthermore, as a novel finding in the present study population, SNPs in or near RPL27A (P =0·013) and BDNF (P =0·019) demonstrated a nominal association with BMI.
The WHR-associated SNPs, published effect sizes, allele frequencies and associations with baseline WHR are presented in Table 4. ZNRF3-KREMEN1 was associated with WHR (P =0·038).
Genetic risk score at baseline
The associations between BMI- and WHR-related GRS (weighted on effect sizes) and weight, BMI, waist circumference, WHR, leisure-time physical activity and dietary intake at baseline are presented in Table 5. BMI GRS were associated significantly with BMI and waist circumference (P =0·006 for both). WHR GRS did not show associations with any of these variables.
1-Year follow-up analyses
Of the individual BMI- and WHR-associated SNP, NUDT3 showed an association with the 1-year BMI change (β = − 0·302 (95 % CI − 0·584, − 0·019), P =0·036). LYPLAL1 (β = 0·007 (95 % CI 0·002, 0·013), P =0·012), NFE2L3 (β = − 0·007 (95 % CI − 0·013, − 0·002), P =0·013) and CPEB4 (β = − 0·006 (95 % CI − 0·011, − 0·001), P =0·020) were associated with the 1-year waist change.
The results of the mean 1-year weight loss by the GRS (created of BMI-related SNPs) are presented in Fig. 1(a) for the intervention and in Fig. 1(b) for the control group. The mean weight loss is illustrated in the entire groups and as divided by a success score as the sum of the achieved intervention goals. In both groups, there were no significant GRS × success score interactions and the mean weight loss was similar in all GRS groups. There were no significant interactions or differences between the GRS groups created of WHR-related SNPs either (data now shown).
In the linear multiple regression analyses including all variables (BMI-associated SNPs, age, sex and intervention), only intervention (P <0·001) and sex (P =0·039) explained significantly part of the variance of BMI during the first year. In the sex-specific analyses, the intervention remained a significant (P <0·001) predictor for BMI change for both sexes. In addition, RPL27A rs4929949 (P =0·023) and BDNF rs10767664 (P =0·036) were significantly associated with a variation in BMI change in men.
In the corresponding analysis for the change in the WHR, intervention (P =0·045), age (P =0·014) LYPLAL1 rs4846567 (P =0·010), CPEB4 rs6861681 (P =0·034) and NFE2L3 rs1055144 (P =0·015) were associated with the WHR during the first year.
3-Year follow-up analyses
The mean BMI during the 3-year follow-up in each GRS (created of BMI-related SNPs) group is illustrated in Fig. S1(a) (available online) for the intervention group and in Fig. S1(b) (available online) for the control group. There were no differences between the GRS groups. Changes in the WHR during the 3-year follow-up between the GRS groups (created of WHR-related SNPs) did not differ either (data not shown).
When the median dietary intake was examined in relation to GRS and BMI during the 3-year follow-up, we observed a clear trend that individuals following a diet high in fibre did not differ in BMI between the GRS groups (P for interaction = 0·065, adjusted for age, sex and randomisation group; Fig. 2(b)). Individuals who reported a diet low in fibre in the middle and highest BMI GRS tertile groups appeared to have a higher BMI than individuals in the lowest GRS group (P =0·051). For carbohydrate intake (Fig. 2(a)), the interaction was not significant (P =0·775). The corresponding interactions for fat, SFA and protein are illustrated in Fig. 2(c)–(e)). Of these analyses, only SFA intake seemed to modify the association between the GRS and BMI (P for interaction = 0·004; Fig. 2(d)). There was no evidence that total energy intake would modify the association between the GRS and BMI (P for interaction = 0·509; data not shown). There were no significant WHR–GRS interactions with any of the dietary factors (data not shown).
Discussion
Based on the present findings, it appears unlikely that the known obesity-predisposing variants modify the effect of lifestyle modification on the success of weight reduction. Furthermore, we provide novel long-term data on the modulation of the genetic risk of obesity by diet. These findings strengthen the view that obesity represents a complex multi-factorial disease resulting from the interaction of susceptibility genes with the diet. The main finding of the present study suggests that the association between the genetic variants and common obesity could be attenuated by a diet high in fibre.
Previous studies on variants in and near the FTO gene have provided evidence that the deleterious effects of obesity-predisposing polymorphisms can be suppressed by lifestyle factors, such as physical activity(Reference Kilpeläinen, Qi and Brage19). A cross-sectional study by Sonestedt et al. (Reference Sonestedt, Roos and Gullberg20) showed that an increase in BMI across FTO genotype groups was restricted to those who reported a diet low in carbohydrate and high in fat. Moleres et al. (Reference Moleres, Ochoa and Rendo-Urteaga21) showed in children that FTO risk allele carriers consuming a diet high in saturated fat had an increased obesity risk. Corella et al. (Reference Corella, Arnett and Tucker22) similarly demonstrated that a high intake of saturated fat strengthens the association between FTO and BMI, but they did not find interactions with carbohydrate intake.
To our knowledge, the present study is the first to assess the interactions between dietary macronutrient composition and obesity-predisposing variants on a large scale (twenty-six BMI- and fourteen WHR-related variants) and in the long term. At baseline, GRS (created of BMI/WHR-related SNPs) did not associate with total intakes of energy, macronutrients or fibre. However, those who reported a diet low in fibre appeared to have a higher BMI by GRS (created of BMI-related SNPs). Dietary intake was divided by median, and there were no differences in BMI between the GRS groups among individuals who consumed >19 g/d from fibre (Fig. 2(b)). However, the differences in BMI by GRS tertile groups were more obvious among individuals consuming < 19 g/d from fibre.
In general, a higher intake of whole grains is associated with a lower BMI in epidemiological studies(Reference Giacco, Della Pepa and Luongo23), and the risk of obesity may be reduced by replacing refined cereal sources with whole-grain, high-fibre foods(Reference Williams, Grafenauer and O'Shea24). In the present study, a diet low in fibre appeared to have a BMI-increasing effect, particularly in those who carried large numbers of obesity-predisposing variants. Although it is known that various nutrients modulate gene expression and thus influence the impact of genetic variants(Reference Afman and Müller25), the mechanisms behind the present observation remain to be explained. Preliminary evidence for gene–diet interaction has come from studies on the FTO locus(Reference Kilpeläinen, Qi and Brage19–Reference Moleres, Ochoa and Rendo-Urteaga21). Furthermore, we recently reported a higher BMI by the FTO risk genotype in those who reported a diet low in carbohydrates and fibre(Reference Lappalainen, Lindström and Paananen26). In the present study, genetic predisposition was estimated by the multiple well-established obesity variants rather than a single locus.
We did not observe significant interactions between the GRS and physical activity in determining BMI at baseline. Several studies have reported that the effect of common FTO variants is attenuated in active individuals in different populations(Reference Kilpeläinen, Qi and Brage19). In addition, Li et al. (Reference Li, Zhao and Luan27) have shown that living a physically active lifestyle is associated with a 40 % reduction in genetic predisposition to common obesity, as estimated by the number of risk alleles carried for the twelve genome-wide association-identified loci. In the present study, a failure to detect an interaction with physical activity may reflect the influence of population-specific characteristics such as high overall physical activity levels in the study population(Reference Jonsson, Renström and Lyssenko28) and a relatively small sample size.
At baseline, BMI/WHR GRS did not associate with total energy or macronutrient intake. Some, but not all, studies on FTO have demonstrated associations with increased energy intake or preference for energy-dense foods(Reference Cecil, Tavendale and Watt29, Reference Timpson, Emmett and Frayling30). The present study suggests instead that obesity-predisposing variants may have a macronutrient-specific effect on BMI, and a fibre-rich diet also indicates less energy-dense food choices. In the present analyses, also SFA intake seemed to modify the association between the GRS and BMI, and the differences between the GRS groups were significant (P =0·034) in the low SFA intake group. The reason for this somewhat unanticipated finding remains unexplained.
BMI GRS were associated significantly with BMI and waist circumference at baseline. WHR GRS did not show associations with any of the obesity-related variables. Of the individual variants, only FTO rs9939609 was associated with baseline BMI, as reported previously in detail(Reference Lappalainen, Tolppanen and Kolehmainen18). Furthermore, SNPs in or near RPL27A and BDNF demonstrated a nominal association with BMI at baseline. NUDT3 showed a nominal association with the 1-year BMI change. Of the WHR-associated SNPs, ZNRF3-KREMEN1 was associated with WHR, and LYPLAL1, NFE2L3 and CPEB4 were associated with the 1-year waist change. However, associations were statistically quite weak, and multiple comparisons would have attenuated the P values to a non-significant level. In the sex-specific linear multiple regression analyses including all BMI-associated SNPs, age and intervention, RPL27A rs4929949 and BDNF rs10767664 explained (P =0·023 and P =0·036, respectively) part of the variance of BMI during the first year but only in men. However, we consider these associations as statistically quite weak and acknowledge the need for further evidence to confirm the associations particularly in the Finnish population. Furthermore, it should be noted that the intervention itself remained a highly significant (P< 0·001) predictor for the 1-year BMI change for both sexes.
Relatively weak associations between SNP and obesity may be due to the fact that these individuals were already overweight/obese, differing from the population from which the variants were originally identified(Reference Speliotes, Willer and Berndt7, Reference Heid, Jackson and Randall9). Moreover, common genetic variants generally have only a modest effect, and the interaction of these variants with each other or with environmental factors is more important in determining the observed phenotype. Although it has been suggested that genetic testing has the potential to be a useful clinical or preventive tool when combined with appropriate information(Reference Meisel, Walker and Wardle31), the current focus should be on promoting a healthy environment.
GRS did not appear to modify weight reduction achieved by the lifestyle intervention. Weight development was also similar in all GRS groups divided by the achieved success scores: the individuals who reached the intervention goals lost more weight regardless of the GRS group. Changes in BMI or WHR did not differ between the tertiles of GRS during the 3-year follow-up either. Thus, it appears to be unlikely that obesity-predisposing variants substantially modify the effect of lifestyle modification on the success of weight reduction in the long term. However, Delahanty et al. (Reference Delahanty, Pan and Jablonski32) recently tested the associations of sixteen obesity-predisposing variants with weight change in Diabetes Prevention Program participants. They found three SNPs (NEGR1 rs2815752, BDNF rs6265 and PPARG rs1801282) that predicted weight regain, irrespective of the type of weight loss therapy, two of which (BDNF and PPARG) were robust to correction for multiple hypothesis testing. In the present study, PPARG was not included in the analyses; however, we have shown previously that the known Pro12Ala polymorphism of PPARG2 modifies weight loss in the Finnish DPS participants(Reference Lindi, Uusitupa and Lindström33). Furthermore, in the present study, BDNF (rs10767664) demonstrated a nominal association with baseline BMI.
In the present study, the obese and prediabetic state of the study population may limit the generalisability of the results, and the obvious limitation is also a relatively modest sample size. Thus, we acknowledge the need for larger studies with varying environment to determine the exact nature of interactions. We did not adjust for multiple comparisons since the present study is a hypothesis-testing rather than hypothesis-generating study and is strongly based on already previously reported findings. The easiest method to correct for this problem would certainly be the Bonferroni according to the number of phenotypes and inheritance models. However, this method is very conservative and stringent. There is also a problem of a high correlation between the parameters tested and the repeated measurements. Furthermore, over-adjustment for multiple comparisons may increase type II error that reduces the power to detect significant differences. Reporting only genetic association studies with strongly positive results is also particularly susceptible to publication bias. However, we would like to emphasise that the strength of the DPS population is that it is carefully selected and clinically well characterised. Furthermore, habitual nutrient intakes of the study participants were annually estimated using 3 d food records, which is a reliable and high-quality method in analysing dietary intakes. It is also notable that the present study enables the investigation of long-term gene × environment interactions, and these kinds of data are seldom available.
In conclusion, based on the present findings, it appears unlikely that obesity-predisposing variants substantially modify the effect of lifestyle modification on the success of weight reduction in the long term. As a novel finding, we suggest that individuals who are genetically predisposed to obesity would benefit in the long term more from a diet high in fibre than individuals who are genetically protected.
Supplementary material
To view supplementary material for this article, please visit http://dx.doi.org/10.1017/S0007114513001116
Acknowledgements
The authors would like to thank the FUSION researchers Michael Boehnke, Francis Collins, Karen Mohlke and Heather Stringham who contributed to the genetic analyses and commented on the manuscript.
The present study was supported by grants from the Academy of Finland (117844, 40 758, 211497 and 118590), the EVO funding of the Kuopio University Hospital from the Ministry of Health and Social Affairs (5254), the Finnish Funding Agency for Technology and Innovation (40 058/07), the Nordic Centre of Excellence on Systems Biology in controlled dietary interventions and cohort studies (SYSDIET; 070014), the Finnish Diabetes Research Foundation, the Yrjö Jahnsson Foundation (56 358), the Sigrid Juselius Foundation, the Juho Vainio Foundation and TEKES (grants 70 103/06 and 40 058/07). Genotyping services were provided by the Center for Inherited Disease Research (CIDR). CIDR was funded through a federal contract from the National Institutes of Health to The Johns Hopkins University (contract no. HHSN268200782096C).
The authors' contributions are as follows: T. J., J. P., J. L., J. T., J. G. E. and M. U. designed the research; M. U. and J. T. conducted the research; T. J. analysed the data and performed statistical analyses and wrote the manuscript; T. J. had primary responsibility for the final content. All authors critically reviewed the manuscript, read and approved the final manuscript. None of the authors reported a conflict of interest.


