Fe-deficiency anaemia is the most common and widespread nutritional deficiency in the world, and a public health problem in industrialised and non-industrialised countries with a higher prevalence in women and children( Reference McLean, Cogswell and Egli 1 ). Hb concentration has often been used in surveys as a proxy indicator of Fe status under the assumption that anaemia is always associated with Fe deficiency, despite many other possible causes( Reference McLean, Cogswell and Egli 1 ).
Mechanisms related to Fe-deficiency anaemia are activated primarily in the duodenum to improve Fe absorption. The large intestine also has been reported to have a capacity for Fe absorption; this area expresses genes that are important for Fe absorption, which are normally expressed in the duodenum, such as duodenal cytochrome b (Dcytb) reductase, divalent metal transporter 1 (DMT1) and ferroportin. Ferric iron is reduced to ferrous iron by Dcytb, an enzyme found on the apical surface of enterocytes and macrophages. DMT1 transports ferrous iron into enterocytes and macrophages. Fe may be stored as ferritin or transferred across the basolateral membrane into the plasma by ferroportin( Reference Frazer, Wilkins and Becker 2 ). Ferroportin is found in the basolateral membrane where it mediates Fe efflux( Reference Ganz 3 ). The importance and function of these genes in the large intestine are not yet clearly understood( Reference Takeuchi, Bjarnason and Laftah 4 ).
Hepcidin controls Fe absorption( Reference Ganz 3 ). Hepcidin is a peptide hormone secreted by the liver in response to Fe loading and inflammation. Ferroportin is internalised when hepcidin concentrations are high, and Fe is trapped in enterocytes, macrophages and hepatocytes, which reduces the efflux of Fe to the circulation system. Ferroportin molecules are exposed to the plasma membrane when hepcidin concentrations are low, which releases Fe( Reference Ganz 3 , Reference Nemeth, Tuttle and Powelson 5 ). Studies have also demonstrated an inverse correlation between hepcidin levels and DMT1, Dcytb and ferroportin levels( Reference Frazer, Wilkins and Becker 2 , Reference Anderson, Frazer and Wilkins 6 ). Pro-inflammatory IL-6 increases hepcidin expression( Reference Ganz 7 ), which decreases the efflux of Fe to the circulation system.
Prebiotics are used to supplement fermentable dietary fibre, and according to physical–chemical characteristics, they stand out among the nutrients that interact with minerals in the intestine( Reference Roberfroid 8 ). Efforts have been made to study how different nutrients might increase the dietary bioavailability of minerals( Reference Tako, Glahn and Welch 9 ). Inulin, extracted from chicory, and oligofructose are the most-studied prebiotics, and these substances offer new nutritional perspectives( Reference Tako, Glahn and Welch 9 , Reference Roberfroid 10 ). Inulin and oligofructose affect gastrointestinal functions, and they are fermented in the colon resulting in the production of SCFA, which explains some of the systemic effects of inulin-type fructans( Reference Roberfroid 10 ). Experimental studies in anaemic rats have shown that prebiotics enhance mineral absorption( Reference Ohta, Ohtsuki and Baba 11 – Reference Freitas, Amancio and Morais 13 ). A higher regeneration of Hb and haematocrit concentrations has been shown in inulin- and oligofructose-treated groups during 3 weeks of prebiotic intake in rats with Fe-deficiency anaemia during the growth phase( Reference Freitas, Amancio and Morais 13 ). Other studies have demonstrated that inulin and oligofructose increased the expression levels of DMT1, ferroportin and Dcytb genes in the duodenum, caecum and colon( Reference Tako, Glahn and Welch 9 , Reference Yasuda, Dawson and Wasmuth 14 ).
Most probably, the benefit of inulin and oligofructose in Fe-deficiency anaemia can be exercised beyond the stage of intestinal absorption of Fe, for example at the stage of transfer, storage and recycling of Fe. It remains to be unknown whether inulin and oligofructose could modulate the expression levels of these genes in Fe metabolism( Reference Yasuda, Dawson and Wasmuth 14 ).
Pro-inflammatory TNF-α and IL-6 and anti-inflammatory IL-10 increase ferritin protein expression, which increases Fe storage, and IL-10 and IL-6 increase the acquisition of Hb by macrophages, which also increases Fe uptake( Reference Koorts, Levay and Becker 15 ), resulting in the decrease of Fe in blood and anaemia. In contrast, pro-inflammatory IL-6 increases hepcidin expression( Reference Ganz 7 ), which reduces the efflux of Fe to the circulation system. Yasuda et al. ( Reference Yasuda, Dawson and Wasmuth 14 ) demonstrated that inulin and oligofructose decrease the gene expression levels of pro-inflammatory factors in the colon of young anaemic pigs, which influences Fe metabolism.
Therefore, the aim of the present study was to evaluate the effects of high-performance (HP) inulin and oligofructose on the expression levels of DMT1, ferroportin and Dcytb proteins, as well as the inflammatory profile and hepcidin levels in young anaemic rats.
Experimental methods
Animals and diets
A total of twenty-one male Wistar rats, aged 21 d at baseline, were used in the present study. Throughout the study period, the rats received food and deionised water ad libitum through a MilliQ Plus system (Millipore Corporation). All rats were housed in individual metabolism cages made of acrylic and stainless steel (Nalgene Metabolic Cages 650-0100) on a 12 h light cycle and a temperature of 23 ± 1°C. The use of cages allowed the collection of urine.
The animals were fed AIN-93G, as recommended by the American Institute of Nutrition( Reference Reeves, Nielsen and Fahey 16 ), which contained the nutrients needed for proper growth. Fe was not added to the food during the study to induce Fe-deficiency anaemia. There were three spontaneous deaths during this period. The rats were divided into three groups (n 7 per group) in the 5th week of life (36 d old), according to treatments based on different diet compositions (Table 1). Thus, three groups comprised seven animals each that started to receive one of the following rations, with the respective added prebiotic: rations without Fe supplementation, but with 103·1 g HP inulin (100 g of dietary fibre; HP inulin group); rations without Fe supplementation, but with 108·7 g oligofructose (100 g of dietary fibre; oligofructose group); rations without Fe and dietary fibre supplementation, which was replaced by 100 g maize starch (control group), as suggested in the literature( Reference Borel, Smith and Brigham 17 ). The amount of HP inulin/oligofructose was subtracted from the total amount of maize starch in the ration. Weight, body length, and Hb and haematocrit levels were considered with the aim of obtaining uniform groups.
Table 1 American Institute of Nutrition (AIN)-93G ration composition (50 g cellulose and 50 g starch), indicated for rats during the growth phase, replaced by 100 g high-performance (HP) inulin, oligofructose or maize starch (control diet)
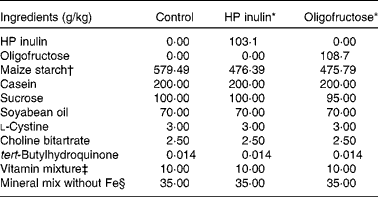
* Composition of the following macronutrients in 100 g of the product: HP inulin – carbohydrate 0 g, protein 0 g, total fat 0 g, dietary fibre 97 g; oligofructose – carbohydrate 5 g, protein 0 g, total fat 0 g, dietary fibre 92 g.
† The fibre portion was replaced by maize starch as suggested by Borel et al. ( Reference Borel, Smith and Brigham 17 ).
‡ Roche®. Composition in mg: nicotinic acid 30, pantothenate 15, pyridoxine 6, thiamin 5, riboflavin 6, folic acid 2; composition in μg: vitamin K 750, d-biotin 200, vitamin B12 25; composition in IU: vitamin A 4000, vitamin D3 1000, vitamin E 75.
§ Roche. Composition in mg: essential minerals – Ca 5000, P 1561, K 3600, S 300, Na 1019, Cl 1571, Mg 507, Zn 30, Mn 10, Cu 6, I 0·2, Mo 0·15, Se 0·15; potentially beneficial minerals (without Fe) – Si 5, Cr 1, F 1, Ni 0·5, B 0·5, Li 0 1, Vo 0·1.
The weight and the length of each animal were measured weekly after the initiation of the experimental diets. Food and water intakes were measured daily during the entire experimental period. The feed efficiency coefficient was calculated, which considered weight gain and food consumption during the entire experimental period using the following formula: weight gain (g)/food consumption (g) in the same period.
Blood sample analysis and experimental procedures
The rats were anaesthetised using ketamine and xylazine (66·6 and 13·3 mg/kg, respectively) weekly after the initiation of the experimental diets, and blood samples were taken from the tail for the determination of Hb and haematocrit levels. The animals were euthanised via decapitation on day 14 of the experimental diets. Median incisions were performed in the abdominal wall and the peritoneum, and the duodenum was removed 5 cm from the pylorus. The caecum was isolated by cutting between the ileocaecal valve and the beginning of the proximal colon. The proximal colon (located between the caecum and the median portion of the larger colonic curvature) was removed( Reference Dirks and Freeman 18 ). All of the fresh intestinal sections were weighed on filter paper using an electronic analytical balance (model AB204; Mettler-Toledo) with a sensitivity of 0·0001 g after excision of the mesentery. The sections were washed with physiological serum to remove the contents in the lumen. The pH of the caecal contents was also evaluated. The rats were euthanised between 06.00 and 10.00 hours, which is the more active period of intestinal fermentation( Reference Younes, Coudray and Bellanger 19 , Reference Lopez, Levrat-Verny and Coudray 20 ). The caecal contents were placed in a beaker immediately after organ extraction, and the pH was measured using pH-sensitive disposable tapes (PHBIO® Photogenesis Biotecnologia). The liver was excised and weighed while fresh.
Urine collection was performed on the day of euthanasia, and samples were frozen at − 18°C. Hb levels were determined using the cyanomethaemoglobin and microhaematocrit Wintrobe method( Reference Wintrobe, Mollin and Herbert 21 ).
Western blot analysis
Samples of the duodenum, caecum and proximal colon were homogenised in 1·0 ml of extraction buffer (100 mm-Trizma, pH 7·5, 10 mm-EDTA, 1 % SDS, 10 mm-sodium pyrophosphate, 100 mm-sodium fluoride, 10 mm-sodium orthovanadate, 2 mm-phenylmethylsulfonyl fluoride and 0·25 mg aprotinin protease inhibitor). The lysates were incubated with 10 % Triton X-100 for 30 min and centrifuged at 14 000 rpm for 30 min at 4°C. The supernatant was collected, and protein concentration was determined using a Bradford assay (Bio-Rad), with bovine serum albumin as a standard.
The protein samples were mixed with Laemmli sample buffer, and boiled for 5 min before loading 100 μg protein onto a 10 % SDS–PAGE gel in a Bio-Rad miniature slab gel apparatus. Electrotransfer of the proteins from the gel to a nitrocellulose membrane was performed for 1 h at 120 V (constant voltage) using a Bio-Rad miniature semi-dry transfer apparatus. Non-specific protein binding to the nitrocellulose was reduced via a 2 h pre-incubation in blocking buffer (1 % bovine serum albumin, 10 mm-Tris, 150 mm-NaCl and 0·02 % Tween-20). Nitrocellulose membranes were incubated overnight at 4°C with antibodies against DMT1, ferroportin and Dcytb (1:1000), or α-tubulin (1:1000) (Santa Cruz Biotechnology), which were diluted in blocking buffer combined with 1 % bovine agarose. The membranes were washed for 30 min in blocking buffer without bovine serum albumin.
The membranes were incubated with a secondary antibody, either anti-goat for ferroportin and Dcytb (1:5000) or anti-mouse for DMT1 and α-tubulin (1:5000) (Santa Cruz Biotechnology). The blots were incubated with a peroxidase-conjugated secondary antibody for 1 h at 22°C, processed for enhanced chemiluminescence (Amersham ECL Detection Reagent; GE Healthcare) to visualise the immunoreactive bands, and developed using the Hybond-ECL Nitrocellulose Membrane (Amersham; GE Healthcare). The protein bands were identified according to their migration rates, compared with the rainbow recombinant protein molecular-weight markers, and quantified using densitometry in Scion Image Software (Scion Corporation). Results are expressed as arbitrary units relative to α-tubulin.
ELISA
Quantification of IL-10, IL-6 and TNF-α in the liver, caecum and colon, as well as of hepcidin (USCN Life Science Inc.) in the liver, urine and serum was performed using commercial ELISA kits. Quantitative assessment of TNF-α (DY510), IL-6 (DY506) and IL-10 (DY522) was carried out by ELISA (DuoSet ELISA; R&D Systems), as described by Rosa et al. ( Reference Rosa Neto, Lira and Oyama 22 ). For TNF-α and IL-10, sensitivity was found to be 62·5 pg/ml in the range of 62·5–4000 pg/ml, and intra- and inter-assay variabilities were 1·3–9·6 and 4·9–9·5 %, respectively. Assay sensitivity for IL-6 was 125 pg/ml in the range of 125–8000 pg/ml. Intra-assay variability for IL-6 was 2·1–9·8 %, and its inter-assay variability was 3·3–6·4 %. All samples were run in duplicate, and values are reported as means.
Statistical analysis
All data are presented as means with their standard errors when numerical variables had a normal distribution, and statistical comparisons of group differences were performed using one-way ANOVA combined with Tukey's test as a post hoc test to compare the control, HP inulin and oligofructose groups. Comparisons were calculated using the Jandel Sigma-Stat program (Systat Software, Inc.). Differences were considered significant at P< 0·05.
Ethical considerations
The Experimental Research Committee of the Federal University of São Paulo approved all procedures (1342/09) for the care and use of the animals in the present study.
Results
Growth and food intake
The control, HP inulin and oligofructose groups exhibited similar weights, lengths, and Hb and haematocrit levels, and food intake during the experimental period (Table 2). The different diet treatments did not alter food intake or feeding efficiency coefficients. Total feeding efficiency coefficients in the control, HP inulin and oligofructose groups were 0·47 (se 0·01), 0·47 (se 0·01) and 0·45 (se 0·01) g/g, respectively (P= 0·814).
Table 2 Weight, length (body and tail), Hb, haematocrit levels and food intake during the experimental period in rats from the control, high-performance (HP) inulin and oligofructose groups (Mean values with their standard errors)*
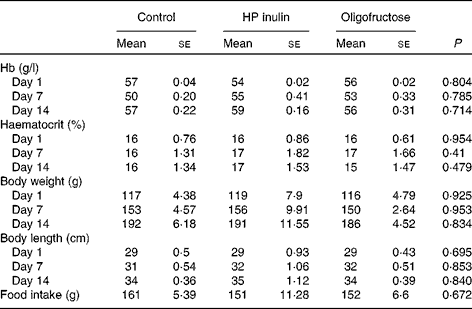
* One-way ANOVA test.
There was no significant difference between the groups in terms of the total intake volume (ml) of deionised water during the dietary treatment period for the control (198·50 (se 12·55)), HP inulin (210·93 (se 17·62)) and oligofructose (232·29 (se 27·61)) groups (P= 0·504).
Weights of different portions of the intestine and the pH of caecal contents
There was no significant difference between the groups in relation to the weight of the duodenum or of the proximal colon in rats from the control, HP inulin and oligofructose groups. The weights of the duodenum were 0·6 (se 0·03), 0·75 (se 0·04) and 0·77 (se 0·04) g, respectively (P>0·05), and those of the proximal colon were 0·45 (se 0·02), 0·51 (se 0·06) and 0·52 (se 0·02) g, respectively (P>0·05). The weights of the caecum (without content) in the control, HP inulin and oligofructose groups were 0·77 (se 0·04), 2·1 (se 0·11) and 1·9 (se 0·04) g, respectively (P< 0·001), with a significant difference between the HP inulin and control groups (P= 0·001), and between the oligofructose and control groups (P= 0·001). No significant difference was observed between the groups receiving the prebiotics (P>0·05), as revealed by the multiple-comparison Tukey's test. The pH values of the caecal contents in the control, HP inulin and oligofructose groups were 6·14 (se 0·14), 5·21 (se 0·14) and 5·5 (se 0·46), respectively, with a significant difference between the HP inulin and control groups (P= 0·006), and between the oligofructose and control groups (P =0·01). No significant difference was observed between the groups receiving the prebiotics (P>0·05).
Intestinal expression of divalent metal transporter 1, ferroportin and duodenal cytochrome b proteins
Western blot analysis revealed no significant (P>0·05) increase in the expression of the proteins DMT1 (Fig. 1), ferroportin (Fig. 2) or Dcytb (Fig. 3), in the duodenal segments of the HP inulin and oligofructose groups. There was a significant increase in the expression levels of the DMT1 protein in the caecum (Fig. 1) of the HP inulin group (increase of 162 %), compared with that of the control group (P= 0·04). However, no significant difference was observed between the oligofructose (elevation of 59·4 %) and control groups (P>0·05). There was a significant increase in the expression levels of the Dcytb protein (Fig. 3) in the proximal colon segment of the HP inulin group (increase of 135 %) compared with that of the control group (P= 0·02). No significant difference was observed between the oligofructose (increase of 23 %) and control groups (P>0·05). There was no significant increase in the expression levels of the ferroportin protein in the duodenum, caecum or proximal colon of the experimental groups (Fig. 2); however, the expression level of this protein was decreased in the oligofructose group (P= 0·02).
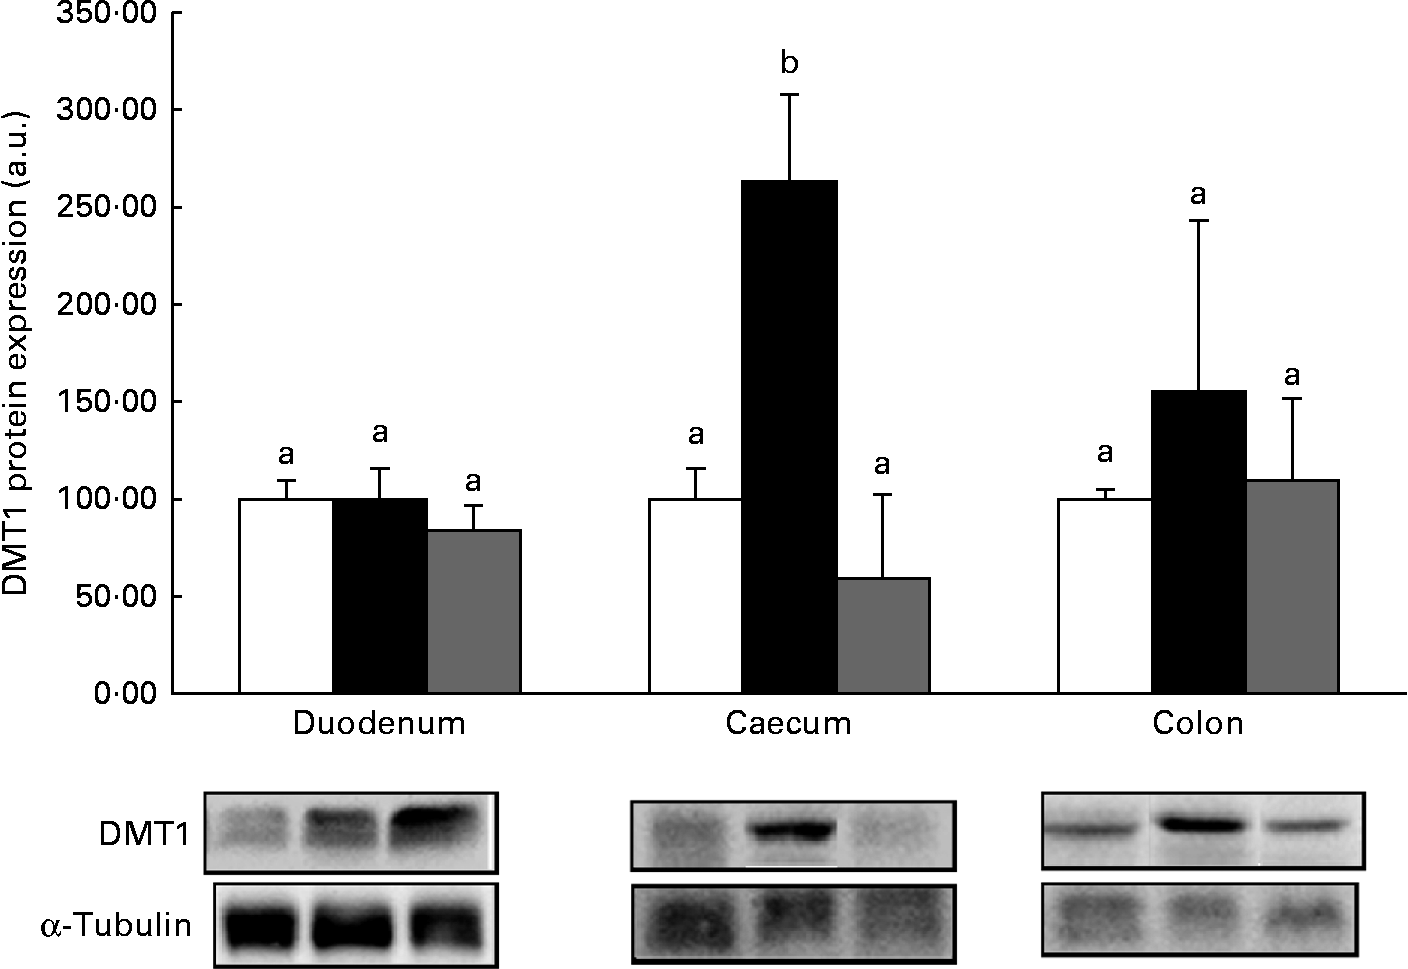
Fig. 1 Protein expression levels of divalent metal transporter 1 (DMT1) in the duodenum, caecum and proximal colon of anaemic rats from the control (![]() ), HP inulin (
), HP inulin (![]() ) and oligofructose (
) and oligofructose (![]() ) groups. Protein levels were determined by Western blot analysis and normalised to the levels of α-tubulin. Values are means (n 4–7 per group), with their standard errors represented by vertical bars. a,bMean values with unlike letters were significantly different (P= 0·04). a.u., Arbitrary units.
) groups. Protein levels were determined by Western blot analysis and normalised to the levels of α-tubulin. Values are means (n 4–7 per group), with their standard errors represented by vertical bars. a,bMean values with unlike letters were significantly different (P= 0·04). a.u., Arbitrary units.
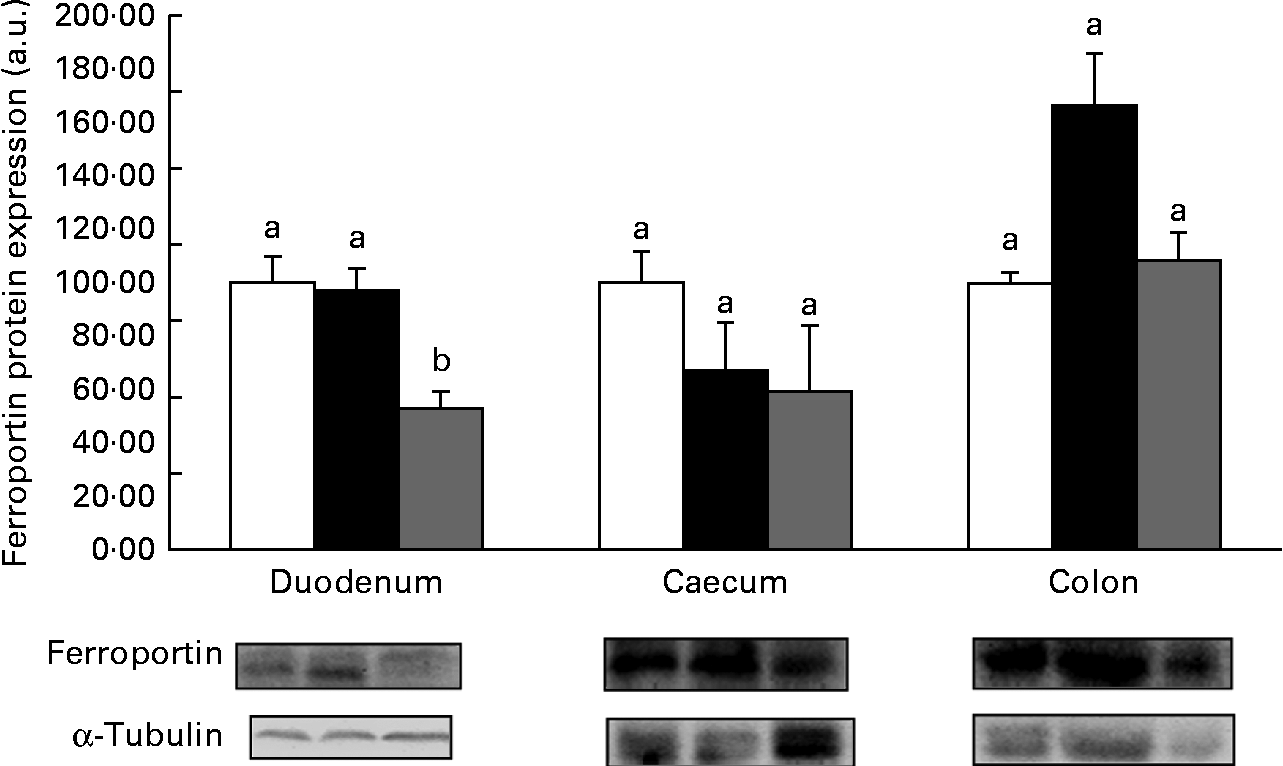
Fig. 2 Protein expression levels of ferroportin in the duodenum, caecum and proximal colon of anaemic rats from the control (![]() ), HP inulin (
), HP inulin (![]() ) and oligofructose (
) and oligofructose (![]() ) groups. Protein levels were determined by Western blot analysis and normalised to the levels of α-tubulin. Values are means (n 5–7 per group), with their standard errors represented by vertical bars. a,bMean values with unlike letters were significantly different (P= 0·02). a.u., Arbitrary units.
) groups. Protein levels were determined by Western blot analysis and normalised to the levels of α-tubulin. Values are means (n 5–7 per group), with their standard errors represented by vertical bars. a,bMean values with unlike letters were significantly different (P= 0·02). a.u., Arbitrary units.
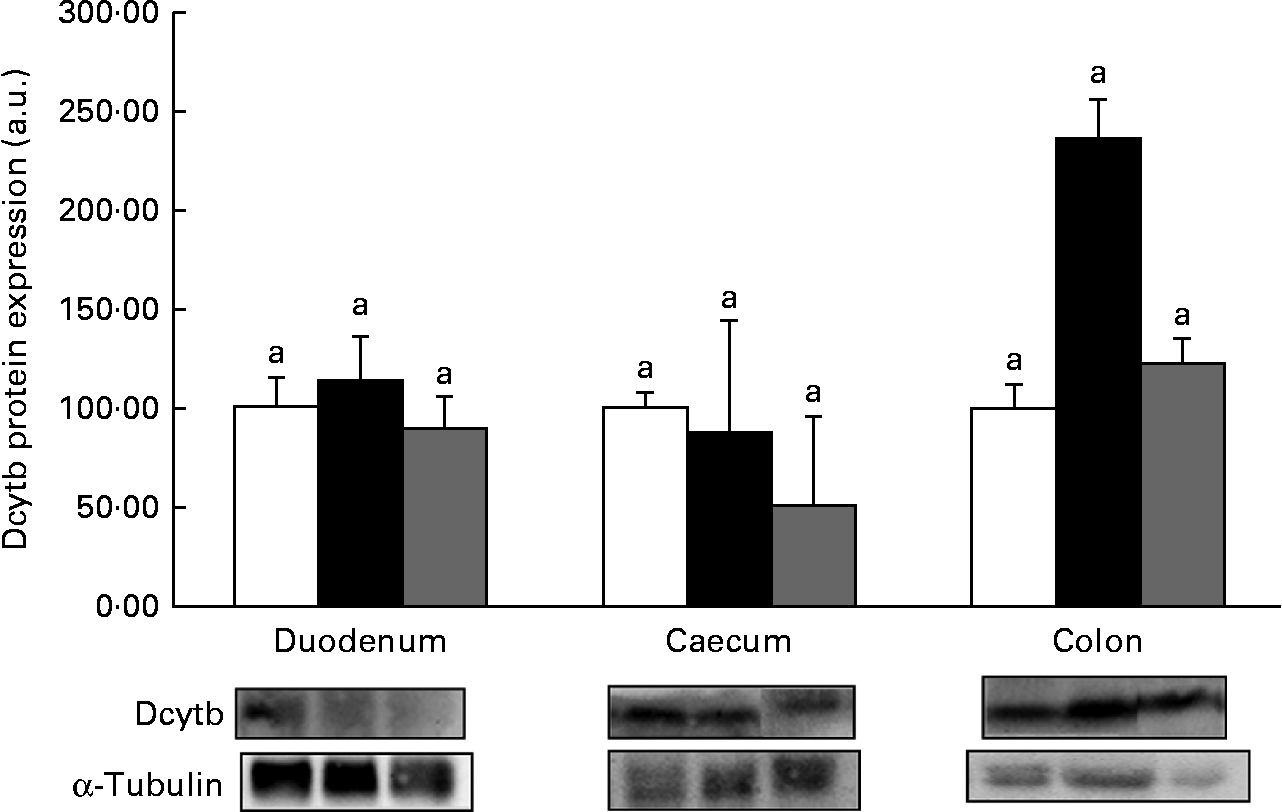
Fig. 3 Protein expression levels of duodenal cytochrome b (Dcytb) reductase in the duodenum, caecum and proximal colon of anaemic rats from the control (![]() ), HP inulin (
), HP inulin (![]() ) and oligofructose (
) and oligofructose (![]() ) groups. Protein levels were determined by Western blot analysis and normalised to the levels of α-tubulin. Values are means (n 5–7 per group), with their standard errors represented by vertical bars. a,bMean values with unlike letters were significantly different (P= 0·02). a.u., Arbitrary units.
) groups. Protein levels were determined by Western blot analysis and normalised to the levels of α-tubulin. Values are means (n 5–7 per group), with their standard errors represented by vertical bars. a,bMean values with unlike letters were significantly different (P= 0·02). a.u., Arbitrary units.
Serum, liver and urinary hepcidin concentrations
Serum hepcidin concentrations were 87·78 (se 3·76), 88·31 (se 2·52) and 87·42 (se 7·20) pg/ml in the control, HP inulin and oligofructose groups, respectively. No significant difference was observed between the control, HP inulin and oligofructose groups (P= 0·993). The same result was observed for liver hepcidin concentrations between the control, HP inulin and oligofructose groups (P= 0·892). Urinary hepcidin concentrations were significantly decreased in the oligofructose group (P< 0·001) compared with that of the control group (Table 3). However, no significant difference was observed between the HP inulin and control groups (P>0·05).
Table 3 Hepcidin levels in the serum, liver and urine of anaemic rats from the control, high-performance (HP) inulin and oligofructose groups (Mean values with their standard errors)

a,bMeans values within a row with unlike superscript letters were significantly different (P< 0·001; one-way ANOVA).
IL-10, IL-6 and TNF-α concentrations in the caecum, proximal colon and liver
Oligofructose decreased the levels of IL-10 (P= 0·044), IL-6 (P= 0·036) and TNF-α (P= 0·004) in the caecum (Table 4). No significant difference was observed between the HP inulin and control groups (P>0·05). No changes were observed in the levels of IL-10, IL-6 or TNF-α in the liver or proximal colon of the HP inulin and oligofructose groups.
Table 4 IL-10, IL-6 and TNF-α concentration for caecum, proximal colon and liver in animals of the control, high-performance (HP) inulin and oligofructose groups (Mean values with their standard errors)
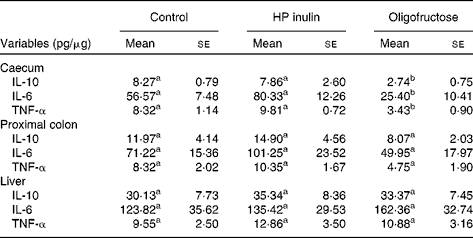
a,bMeans values within a row with unlike superscript letters were significantly different in comparison between groups (P≤ 0·05; one-way ANOVA test).
Discussion
The present study showed that HP inulin increased the expression levels of DMT1 in the caecum and of Dcytb in the colon. Oligofructose did not induce differences in these proteins compared with the control group. However, oligofructose decreased urinary hepcidin concentrations, and also decreased the expression of the ferroportin protein in the duodenum, and decreased the levels of TNF-α, IL-6 and IL-10 in the caecum.
Therefore, in the present study, it is clear that HP inulin and oligofructose exerted promotive effects via different mechanisms. Rossi et al. ( Reference Rossi, Corradini and Amaretti 23 ) observed that in faecal cultures, oligofructose and inulin strongly affected the products of fermentation. Different types and amounts of SCFA were produced. During the growth phase, inulin produced butyrate, the major fermentation product, whereas oligofructose produced acetate and lactate. These findings reflect the consequence of the different effects of oligofructose and inulin on microflora composition and activity. The rate of fermentative metabolism is faster on oligofructose than on inulin. However, both oligofructose and inulin demonstrate clear prebiotic effects, but differences occur in fermentation kinetics because of the different degrees of polymerisation( Reference Pompei, Cordisco and Raimondi 24 ). These different degrees of polymerisation distribution affect the kinetics of microbial changes and activities, and result in a faster production of butyric acid on inulin than on oligofructose. The increase in the concentrations of Lactobacillus and Bifidobacterium occurs earlier on oligofructose than on inulin. The short chains of oligofructose are more easily metabolised by Bifidobacterium than are the longer chains of inulin( Reference Rossi, Corradini and Amaretti 23 ).
These differences may partially explain the increase observed in the expression levels of DMT1 in the caecum and of Dcytb in the colon by inulin, but not by oligofructose, consistent with the study of Pompei et al. ( Reference Pompei, Cordisco and Raimondi 24 ). Inulin is a long-chain fructan with a degree of polymerisation ranging from 2 to 60 units, and an average degree of polymerisation of 10–12 units. Therefore, inulin is degraded slowly, and can exert its effects on the distal regions of the large intestine( Reference Wiele, Boon and Possemiers 25 ). However, because oligofructose has an average degree of polymerisation of 4 units, it is degraded faster and can affect the proximal regions( Reference Roberfroid, Van Loo and Gibson 26 ).
Yasuda et al. ( Reference Yasuda, Dawson and Wasmuth 14 ) observed that inulin and oligofructose have greater effects on the caecum and colon compared with the duodenum, and their metabolites influence gene expression levels in the caecum and colon. They also claimed that inulin and oligofructose show similar effects on genes involved in the regulation of Fe metabolism, regardless of the chain length, which implies a similar mode of action. In contrast, the present study indicated no increase in the expression levels of DMT1, ferroportin and Dcytb in the large intestine, following oligofructose treatment. The only change observed in the present study following the treatment with oligofructose was the reduction in the expression levels of ferroportin in the duodenum.
DMT1 is expressed in both rat duodenum and colon. In keeping with their expected roles in body Fe metabolism, DMT1 protein levels in the duodenum greatly exceed those in colonic tissue. However, despite these differential expression levels, the DMT1 protein is up-regulated in the colon of Fe-deficient rats compared with control Fe diet-fed rats, exhibiting an increase of 147 %( Reference Johnston, Johnson and Marks 27 ). Thus, the anaemic group that did not receive the prebiotics was the control group because anaemia is an adaptive mechanism in which increased expression levels of genes that regulate Fe absorption are observed in the duodenum, caecum and colon( Reference Takeuchi, Bjarnason and Laftah 4 , Reference Johnston, Johnson and Marks 27 ). These anaemic animals have also been used as controls in similar studies( Reference Tako, Glahn and Welch 9 , Reference Yasuda, Dawson and Wasmuth 14 ).
In the present study, the expression level of the DMT1 protein in the caecum was significantly higher in the HP inulin group than in the control group, exhibiting an increase of 162 %. Similarly, Tako et al. ( Reference Tako, Glahn and Welch 9 ) observed an increase in DMT1 gene expression levels in the colon (120 %) compared with the control group. Consistent with the latter study, HP inulin in the present study increased the expression levels of the Dcytb protein in the colon by 135 %, but the increase was 70 % in Tako et al. ( Reference Tako, Glahn and Welch 9 ). The almost 2-fold increase observed in the present study may be attributed to the use of more than twice the concentration of inulin in the diet, when compared with the diet in Tako et al. ( Reference Tako, Glahn and Welch 9 ). HP inulin did not alter the expression levels of proteins that regulate Fe absorption in the duodenum. However, Tako et al. ( Reference Tako, Glahn and Welch 9 ) found increased gene expression levels of these factors in the duodenum.
HP inulin and oligofructose did not alter the hepatic or serum concentration of hepcidin in the present study. Our hypothesis was that there was a decrease in the levels of hepcidin in the serum and liver tissue. However, oligofructose reduced the urinary concentration of hepcidin, which was accompanied by a reduction in ferroportin protein expression levels in the duodenum. The hepcidin–ferroportin axis is the principal regulator of extracellular Fe homeostasis in health and disease. In the present study, these results suggest an increase in the formation of the ferroportin–hepcidin complex, in which ferroportin is internalised and degraded in lysosomes( Reference Ganz 3 ). Therefore, it is questionable whether this pattern could reduce the absorption of Fe and increase anaemia, because it reduces Fe that is available in the plasma. However, Tako et al. ( Reference Tako, Glahn and Welch 9 ) and Yasuda et al. ( Reference Yasuda, Dawson and Wasmuth 14 ) reported that oligofructose increases ferritin expression, which suggests increased Fe stores and the existence of a negative feedback loop to decrease Fe absorption. Nevertheless, Freitas et al. ( Reference Freitas, Amancio and Morais 13 ) observed that oligofructose increased Fe absorption in growing anaemic rats. More studies are needed to clarify the effects of oligofructose on the homeostasis of Fe absorption and on hepcidin levels in the serum and urine.
Pro-inflammatory TNF-α and IL-6, and anti-inflammatory IL-10 increase ferritin protein expression levels, and IL-10 and IL-6 increase the acquisition of Hb by macrophages, which also increases Fe uptake( Reference Koorts, Levay and Becker 15 ). Oligofructose reduced the concentrations of IL-6, TNF-α and IL-10 in the caecum in the present study, which suggests that oligofructose used other mechanisms of action to make Fe available to the plasma. These results corroborate those of Freitas et al. ( Reference Freitas, Amancio and Morais 13 ) who observed that oligofructose significantly increased Hb recovery in growing anaemic rats. This observation is important to the study of Fe-deficiency anaemia because these IL contribute to hypoferraemia, reduce Hb and impair erythropoiesis( Reference Grotto 28 ). The low concentration of TNF-α in the caecum could reduce ferritin and promote the availability of Fe for Hb regeneration( Reference Koorts, Levay and Becker 15 , Reference Torti and Torti 29 ). Yasuda et al. ( Reference Yasuda, Dawson and Wasmuth 14 ) demonstrated a reduction in the expression levels of the TNF-α gene in the colon of anaemic pigs fed inulin and oligofructose. They also reported that the final concentrations of Hb and haematocrit in these pigs were higher than those of the control group after 7 weeks of feeding, and this was possible even without Fe supplementation. The present study focused on Fe-deficiency anaemia instead of inflammation anaemia, but many infectious and immunosuppressive diseases cause Fe-deficiency anaemia, which suggests changes in inflammatory patterns( Reference Yasuda, Dawson and Wasmuth 14 ). Therefore, further studies are needed to clarify the role of these prebiotics on IL in Fe-deficiency anaemia, considering the pleiotropic effects of IL, that may aggravate anaemia.
There were no changes in the weight, growth or food intake between the experimental groups in the present study. However, the prebiotic groups showed significant increases in caecal weight and decreases in luminal pH after euthanasia, which indicates a prebiotic effect of the experimental diets.
Therefore, HP inulin and oligofructose may affect the expression levels of proteins that regulate Fe absorption in the large intestine. Importantly, the present study was the first to evaluate the effects of prebiotics on hepcidin concentrations in the serum, liver and urine. Hepcidin is an important hormone involved in the regulation of systemic Fe metabolism. Further studies elucidating the action of prebiotics on intestinal Fe absorption and systemic regulatory mechanisms in Fe-deficiency anaemia should be conducted. These studies should investigate hepcidin and IL signalling pathways, which are widely studied in relation to inflammatory anaemia, but seldom investigated in the context of Fe-deficiency anaemia.
Acknowledgements
The authors thank the staff of the Physiology of Nutrition Discipline wing of the Department of Physiology, Federal University of São Paulo.
The present study was supported by the National Council of Technological and Scientific Development – CNPq, Brazil (grant no. 2010-1/303791). The funder had no role in the design and analysis of the study or in the writing of this article.
The authors' contributions are as follows: R. M., L. M. O. and M. B. d. M. contributed to the project design, data analysis, statistical analysis, final revision and submission of the manuscript; R. M. conducted the animal experiments; R. M., A. B. S., A. A. d. S., M. d. L. C. S., O. M. S. A. and L. M. O. performed the laboratory analyses; R. M., L. M. O., C. M. d. P. O. d. N. and M. B. M. contributed to the critical revision of the manuscript for important intellectual content.
The authors declare that there are no conflicts of interest.


