Obesity is associated with an increased risk for hypertension, dyslipidaemia, type 2 diabetes, CHD, stroke and certain cancers(1). The prevalence of obesity is still increasing. To reverse this trend, a sustained and effective treatment strategy is needed. Sustaining satiety, while decreasing the amount of energy ingested, is one of the targets in an effective obesity treatment. Meal size and meal frequency determine total energy intake. Oral sensory signals play a role in determining meals size(Reference Poothullil2), while metabolic signals such as appearance of metabolites, anorexigenic hormones, diet-induced thermogenesis and substrate oxidation play a role in determining the inter-meal interval(Reference Schilstra3). However, the question remains whether oral signals have an effect on metabolic satiety, and, if so, the magnitude of this effect.
In a recent study we have observed a short increase in concentrations of metabolites and satiety after oral stimulation with high-fat foods(Reference Smeets and Westerterp-Plantenga4). Oral stimulation (with fat) experiments by other researchers using the modified sham feeding (MSF) technique, have shown effects on metabolites, hormones and satiety as well(Reference Mattes5–Reference Robertson, Mason and Frayn16). Oral stimulation seems to increase the availability of oxidisable metabolites, without receiving any exogenous nutrients. Whether these oxidisable metabolites are oxidised is not clear. Stable-isotope techniques are useful tools to investigate the origin of the oxidisable metabolites. In the present study we have used 2H-labelled palmitic acid, added to a high-fat breakfast, to investigate the effect of sensory stimulation with fat on substrate utilisation.
Until now few studies have examined the effects of oral stimulation on thermogenesis(Reference Tittlebach and Mattes10, Reference LeBlanc and Cabanac17–Reference Prat-Larquemin, Oppert and Bellisle20). In addition to energy expenditure measurements, plasma glucose and insulin concentrations, and the appetite profile were determined in most studies. In the present study we investigated the possible effects of sensory satiety on metabolic satiety, i.e. substrate oxidation and energy expenditure, in energy balance, in a highly controlled environment.
Subjects and methods
Subjects
Sixteen women were initially selected based on age, height, weight, BMI and restrained eating score (F1 score) on the three-factor eating questionnaire (TFEQ)(Reference Stunkard and Messick21); two women dropped out because of personal reasons. Eating behaviour was assessed using a validated Dutch translation of the TFEQ. Cognitive restrained and unrestrained eating behaviour (factor 1), emotional eating and disinhibition (factor 2) and the subjective feeling of hunger (factor 3) were scored. Fourteen females (BMI 23·2 (sd 2·7) kg/m2; age 24·4 (sd 7·1) years; TFEQ F1, 4 (sd 3); body fat 27·4 (sd 6·9) %) were studied on three occasions. All subjects were healthy, not taking medication, non-smoking and not dieting. Subjects were excluded from participation if their factor 1 score on the TFEQ was >9. All subjects gave written informed consent and the study was approved by the Maastricht University Ethics Committee.
Study protocol
The study had a randomised cross-over design and three experimental conditions. Subjects underwent three 36 h sessions in energy balance in a respiration chamber for measurements of energy expenditure and substrate oxidation. The three 36 h sessions were conducted 4 weeks apart to ensure that each subject was in the same phase of her menstrual cycle. At 3 d before each 36 h session, subjects were provided with a diet in energy balance, and with the same macronutrient composition (50 % energy from carbohydrate, 35 % energy from protein, 15 % energy from fat) at home. We gave our subjects a diet 3 d before the experiment in the respiration chamber at 100 % of their daily energy needs and with the same macronutrient composition as the diet during the experiment. Before the test was started, subjects were asked whether they had encountered any difficulties while consuming the diet at home. Apart from some subjects that were not able to finish their complete dinner on day 1 of the diet, no irregularities were reported. The subjects entered the respiration chamber at 18.00 hours and subsequently received the dinner of day 3 before the 36 h session. Subjects were instructed to go to bed at about 23.00 hours. After an overnight stay in the respiration chamber the test day started the following morning at 08.00 hours. On each test day subjects consumed breakfast at 08.00 hours, which consisted of two croissants with butter and a cup of chocolate milk (40 % energy from carbohydrate, 20 % energy from protein, 40 % energy from fat). At 12.00 hours (t = 0) the subjects were given one of three test lunches in random order: a high-fat lunch, which consisted of a soup and a salad (25 % energy from carbohydrate, 7 % energy from protein, 68 % energy from fat), the same lunch sham fed, or water. Dinner consisted of pasta with a vegetarian tomato sauce, orange juice and yogurt with fruits, and was served at 16.30 hours to make the protocol more convenient for the subjects. The 24 h energy intake was compensated at dinner to keep the subjects in energy balance over 24 h.
Energy intake
During each experimental session subjects were fed in energy balance. The energy content of the diet that the subjects consumed at home was based on BMR calculated with the Harris–Benedict equation(Reference Harris and Benedict22) and multiplied by an activity index of 1·7(Reference Westerterp23). In the respiration chamber energy requirements were calculated based on sleeping metabolic rate (SMR) measured during the first night and multiplied by an activity index of 1·5(Reference Westerterp23). Energy intake in the water and MSF lunch condition was divided over the meals as 30 % for breakfast (08.00 hours) and 70 % for dinner (16.30 hours). In the eaten lunch condition energy intake was divided over the meals as 30 % for breakfast (08.00 hours), 20 % for lunch (12.00 hours) and 50 % for dinner (16.30 hours). The macronutrient composition of each 24 h diet was 15 % energy from protein, 35 % energy from fat and 50 % energy from carbohydrates.
Modified sham feeding
In the MSF condition the subjects were presented with the test lunch and were instructed to chew the food until the point at which they would normally swallow and then to expectorate the food into a plastic bowl. They were continually instructed not to swallow any food. The subjects repeated the procedure until the meal had been fed completely (15–20 min). Wet and freeze-dried weights of each meal after MSF and a duplicate meal (which was not used for MSF) were measured.
Blood collection and analytical methods
At 1 h before the lunch, a Teflon catheter was placed in the antecubital vein for blood sampling. Blood samples were collected 60 (t = − 1) and 5 (t = 0) min before and 15 (t = 1), 30 (t = 2), 60 (t = 3) and 120 (t = 4) min after the lunch in tubes containing EDTA to prevent clotting. Plasma was obtained by centrifugation (4°C; 3000 rpm; 10 min) and stored at − 20°C until analysis of glucose by a hexokinase method (ABX Diagnostics, Montpellier, France), insulin (RIA kit; Linco Research, Inc., St Charles, MO, USA), NEFA (NEFA C-kit Wako 994-75 409; Sopar Biochemicals, Koekelberg, Belgium), TAG (GPO-trinder 337; Sigma, St Louis, MO, USA) and glycerol by a glycerolkinase-lipase method (Boehringer, Mannheim, Germany) using a semi-automated centrifugal spectrophotometer (Cobas Fara, Roche Diagnostics, Basel, Switzerland). Plasma concentrations of active ghrelin were measured by RIA (Linco Research, Inc.). Plasma active ghrelin concentrations were measured in acidified plasma with 50 μl of 1 m-HCl and addition of 10 μl of phenylmethylsulfonyl fluoride per 1 ml plasma. Sensitivity of the RIA assay was 7·8 pg/ml and the difference between duplicate results of a sample was < 10 % CV. The specificity for human ghrelin was 100 %. Plasma active glucagon-like peptide 1 (GLP-1) samples were analysed using ELISA (EGLP-35K; Linco Research, Inc.). Plasma active GLP-1 concentrations were measured in plasma after the addition of 10 μl dipeptidyl peptidase-4 (DPP-IV) inhibitor per ml blood. Sensitivity of the ELISA assay was 2 pm, and the difference between duplicate results of a sample was < 10 % CV. The specificity for active GLP-1 was 100 %. Plasma leptin concentrations were measured using the human leptin RIA kit (Linco Research, Inc.). Sensitivity of the leptin RIA assay was 0·05 ng/ml and the difference between duplicate results of a sample was < 10 % CV. The specificity for human leptin was 100 %.
Appetite profile
Appetite profile was measured using anchored 100 mm visual analogue scales (VAS). During each respiration chamber session these questionnaires were completed before and after every meal on feelings of hunger, fullness, appetite, satiety, thirst, prospective food consumption and desire to eat. The scale was anchored from ‘not at all’ on the left to ‘extremely’ on the right. During each respiration chamber session these questionnaires were completed before (07.50 hours) and after (08.20 hours) breakfast, at 10.45 hours, before (12.00 hours) and after (12.20 hours) lunch, at 13.15 hours, at 14.15 hours, before (16.30 hours) and after (17.00 hours) dinner and on the next morning (08.00 hours).
Body composition
Body composition was determined by underwater weighing in the fasted state. Body mass in air and underwater was determined on a digital balance, accurate to 0·01 kg (Sauter type E1200). Lung volume was measured simultaneously with the He-dilution technique using a spirometer (Volugraph 2000; Mijnhardt, The Netherlands). Body density was used to calculate body fat according to the two-compartment model with the equation of Siri(Reference Siri24).
Indirect calorimetry
O2 consumption and CO2 production were measured in the respiration chamber(Reference Schoffelen, Westerterp and Saris25). The respiration chamber is a 14 m3 room furnished with a bed, chair, computer, television, radio cassette player, telephone, intercom, sink and toilet. The room was ventilated with fresh air at a rate of 70–80 litres/min. The ventilation rate was measured with a dry gas meter (type 4; Schlumberger, Dordrecht, The Netherlands). The concentrations of O2 and CO2 were measured with the use of an IR CO2 analyser (Uras 3G; Hartmann and Braun, Frankfurt, Germany) and two paramagnetic O2 analysers: Magnos 6G (Hartmann and Braun) and type OA184A (Servomex, Crowborough, East Sussex, UK). During each 15 min period, six samples of outgoing air for each chamber, one sample of fresh air, zero gas and calibration gas were measured. The gas samples to be measured were selected by a computer that also stored and processed the data(Reference Schoffelen, Westerterp and Saris25).
Energy expenditure and substrate oxidation
The 24 h energy expenditure consists of SMR, diet-induced thermogenesis (DIT) and activity-induced energy expenditure; 24 h energy expenditure and 24 h respiratory quotient were measured from 08.00 hours on day 4 to 08.00 hours on day 5. Activity was monitored with a radar system based on the Doppler principle. SMR was defined as the lowest mean energy expenditure measured over three consecutive hours between 00.00 and 07.00 hours. DIT was calculated by plotting energy expenditure against radar output; both were averaged over 30 min periods. The intercept of the regression line at the lowest radar output represents the energy expenditure in the inactive state (RMR), which consists of SMR and DIT(Reference Westerterp, Wilson and Rolland26). DIT was determined by subtracting SMR from RMR. Activity-induced energy expenditure was determined by subtracting SMR and DIT from 24 h energy expenditure. Carbohydrate, fat and protein oxidation were calculated from the measurements of O2 consumption, CO2 production, and urinary N excretion by using the formula of Brouwer(Reference Brouwer27). Urine samples (24 h) were collected from the second void on day 4 until the first void on day 5. Samples were collected in containers with 10 ml H2SO4 to prevent N loss through evaporation. Volume and N concentration were measured, the latter with an N analyser (CHN-O-Rapid; Heraeus, Hanau, Germany).
Dietary fat oxidation
Labelled fatty acids were obtained from Cambridge Isotope Laboratories (Andover, MA, USA). 2H-labelled palmitic acid, d31-palmitic acid (catalogue no. DLM-215), was 98 atom%. 2H-labelled palmitic acid (20 mg/kg body weight) was added to chocolate milk, which was heated up to 65°C and consumed by the subjects at breakfast. After the ingestion of the chocolate milk with 2H-labelled palmitic acid, the cup, in which the chocolate milk was served, was filled with a new portion of chocolate milk to ‘rinse’ the cup. This second portion of chocolate milk was also heated up to 65°C and ingested by the subjects to minimise the loss of 2H-labelled palmitic acid. Urine was collected every 2 h after breakfast up to 20.00 hours. Recovery of the stable isotopes was calculated at 2, 4, 6, 8, 10, 12 and 24 h post-dose according to the method described by Votruba et al. (Reference Votruba, Zeddun and Schoeller28). Cumulative recovery of 2H from labelled palmitic acid (%) over 24 h in the urine was used as a measure of dietary fat oxidation.
Statistical analysis
Data are presented as mean values and standard deviations, unless otherwise indicated. The profiles of the plasma concentrations of the measured parameters have patterns and peaks that reflect the absorption of nutrients in the intestine. The aim of the present study was to assess whether the peak of a specific parameter on a relevant point in time differed significantly from baseline, and whether these peaks differ significantly between treatments. A three-factor repeated-measures ANOVA or analysis of covariance (ANCOVA), with value of parameter at t = 0 as covariate, was carried out to determine possible differences between the conditions. Post hoc comparisons were made with the Fisher protected least significant difference (PLSD) test. Significance was defined as P < 0·05. All of the statistical analyses were executed with Statview SE GraphicsTM software (version 4.5; Abacus Concepts Inc., Berkeley, CA, USA).
Results
The results on 24 h energy expenditure are shown in Table 1. There were no differences between the conditions in total energy expenditure, 24 h DIT, SMR, activity-induced energy expenditure and 24 h non-protein respiratory quotient. In all conditions the subjects were in energy balance (energy intake minus energy expenditure was: water 0·83 (sd 0·8) MJ/d; MSF 0·74 (sd 0·8) MJ/d; lunch eaten 0·73 (sd 0·7) MJ/d; NS). The continuous measurement of energy expenditure from the moment the subjects entered the respiration chamber until the test lunch revealed no differences between the three conditions. The subjects were thus in a similar metabolic state before lunch. During the 60 min before the lunch, energy expenditure was equal in all conditions (Fig. 1). However, energy expenditure during the first hour after the eaten and MSF lunch was significantly higher compared with after water (water 6·3 (sd 0·8) kJ/min; MSF 6·9 (sd 1·0) kJ/min; lunch eaten 6·8 (sd 0·7) kJ/min; ANOVA, F 0·449; P < 0·04). This difference in energy expenditure between conditions was no longer present in the second hour after MSF and eaten lunch. The 24 h fat oxidation (water 53 (sd 35) g; MSF 50 (sd 25) g; lunch eaten 65 (sd 29) g) and 24 h carbohydrate oxidation (water 293 (sd 73) g; MSF 289 (sd 73) g; lunch eaten 252 (sd 60) g) were not significantly different between conditions.
Table 1 Total energy expenditure, components of energy expenditure and non-protein respiratory quotient (RQ) during the three conditions
(Mean values and standard deviations)
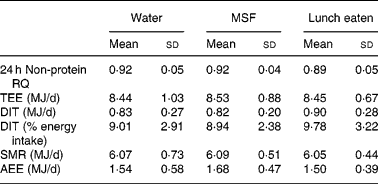
MSF, modified sham feeding; TEE, total energy expenditure over 24 h; DIT, diet-induced thermogenesis; SMR, sleeping metabolic rate; AEE, activity-induced energy expenditure.
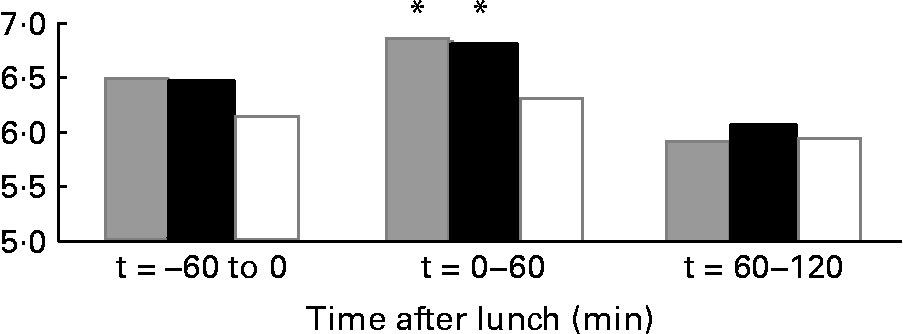
Fig. 1 Mean energy expenditure during 1 h before the lunch ( − 60 to 0 min), the first hour after the lunch (0–60 min) and during the second hour after the lunch (60–120 min) in sham-fed subjects (![]() ), subjects that ate the lunch (■) and in subjects given a water lunch (□). * Mean value was significantly different from that after water (repeated-measures ANOVA; P < 0·05).
), subjects that ate the lunch (■) and in subjects given a water lunch (□). * Mean value was significantly different from that after water (repeated-measures ANOVA; P < 0·05).
The percentage 2H-labelled palmitic acid recovered over 24 h was not different between the three conditions (water 22·3 (sd 5·1) %; MSF 22·4 (sd 5·1) %; lunch eaten 19·8 (sd 4·6) %; Fig. 2).

Fig. 2 Mean cumulative percentage recovery of 2H from 2H-labelled palmitic acid given at breakfast (08.00 hours) in sham-fed subjects (–●–), subjects that ate the lunch (–■–) and in subjects given a water lunch (- -△- -). Values are means, with standard deviations represented by vertical bars.
Expectorated meals
The weights of the MSF meal before and after chewing were compared; this yielded a mean recovery rate of 101·8 (sem 8·5) % for total weight and 96·2 (sem 3·1) % for dehydrated weight.
Blood samples
Glucose
Changes in plasma glucose concentrations in response to the lunch condition are presented in Table 2. At 15 min after the lunch absolute plasma glucose concentrations were significantly higher after eating than after the MSF and water condition (water 5·1 (sd 0·4) mmol/l; MSF 5·1 (sd 0·3) mmol/l; lunch eaten 5·5 (sd 0·3) mmol/l; ANCOVA, F 0·071; P < 0·0001; Table 2).
Table 2 Baseline and changes in plasma concentrations of glucose, insulin, glucagon-like peptide 1 (GLP-1) and leptin
(Mean values and standard deviations)

a,b Mean values for a parameter within a column with unlike superscript letters were significantly different (repeated-measures ANOVA; P < 0·05).
* Mean value was significantly different from that after eating (ANCOVA; P < 0·05).
† Mean value was significantly different from that after modified sham feeding (ANCOVA; P < 0·05).
Insulin
Changes in plasma insulin concentrations in response to the lunch condition are presented in Table 2. Absolute plasma insulin concentrations were significantly different between the three conditions 15 min after the lunch, with the highest plasma insulin concentrations in the eating condition and the lowest plasma insulin concentrations in the water condition (ANCOVA, F 15·514; P < 0·0001; Table 2). The increase in plasma insulin concentrations 15 min after the lunch was significantly higher in the eating condition compared with the MSF and water conditions (ANOVA, F 2·402; P < 0·0001; Table 2). At 120 min after the lunch absolute plasma insulin concentrations were significantly higher in the eating condition compared with the MSF and water conditions (ANCOVA, F 9·700; P < 0·02; Table 2).
Non-esterified fatty acids
Changes in plasma NEFA concentrations in response to the lunch condition are presented in Fig. 3. At 15 and 60 min after the lunch absolute plasma NEFA concentrations were significantly higher after MSF and the water condition compared with after the eaten condition (ANCOVA, t = 15, F 5·473, P < 0·0001; t = 60, F 5·054, P < 0·0001; data not shown). The change in NEFA plasma concentrations 15 min after the lunch was significantly different between the three conditions, with an increase in NEFA plasma concentrations in the MSF and the water conditions and a decrease in NEFA plasma concentrations in the eating condition (ANOVA, F 63·132; P < 0·0001; Fig. 3). At 60 min after the lunch the changes in NEFA plasma concentrations were still significantly different after MSF and the water condition compared with after the eaten condition (ANOVA, F 81·598; P < 0·0001; Fig. 3). At 2 h after the lunch, differences in NEFA plasma concentrations between the conditions were no longer observed.
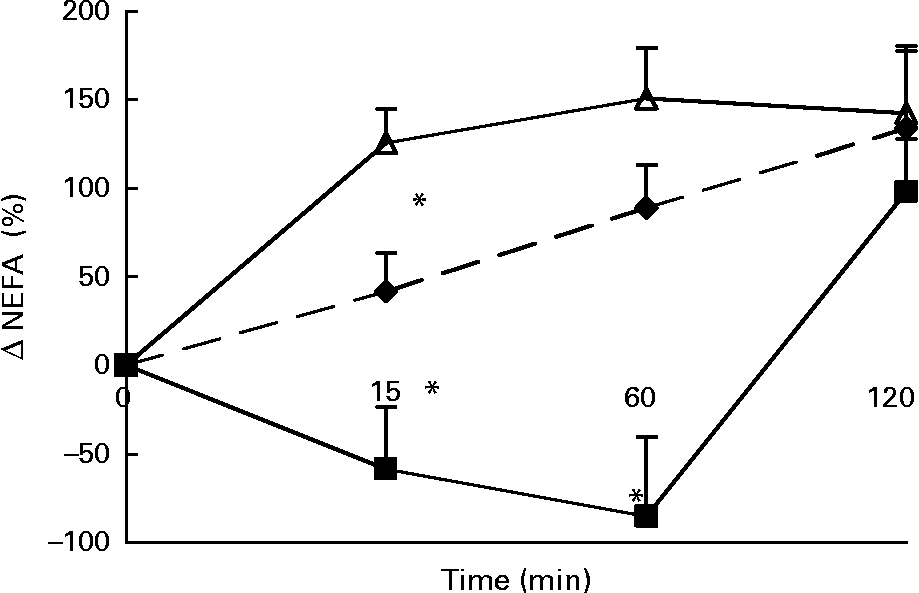
Fig. 3 Percentage change in plasma NEFA concentrations in sham-fed subjects (- -♦- -), subjects that ate the lunch (–■–) and in subjects given a water lunch (–△–). Values are means, with standard errors represented by vertical bars. * Mean value was significantly different from that after water (repeated-measures ANOVA; P < 0·05).
Triacylglycerol and glycerol
Changes in plasma TAG concentrations in response to the lunch condition are presented in Fig. 4. Absolute plasma TAG concentrations were significantly different between the three conditions 15 min after the lunch, with the highest plasma TAG concentrations in the water condition and the lowest plasma TAG concentrations in the MSF condition (ANCOVA, F 2·984; P < 0·03; data not shown). At 60 min after the lunch absolute plasma TAG concentrations were significantly lower after MSF and the water condition compared with after the eaten condition (ANCOVA, F 1·729; P < 0·02; data not shown). At 120 min after the lunch absolute plasma TAG concentrations were no longer significantly different between the MSF and eating conditions (ANCOVA, data not shown). MSF and eating provoked a significantly lower decrease in TAG concentrations compared with the water condition, calculated as area-under-the-curve Δ (F 19 851·451; P < 0·0002) and 60 min (F 191·405; P < 0·0001) and 120 min (F 189·638; P < 0·0001) after the lunch conditions (ANOVA; Fig. 4).
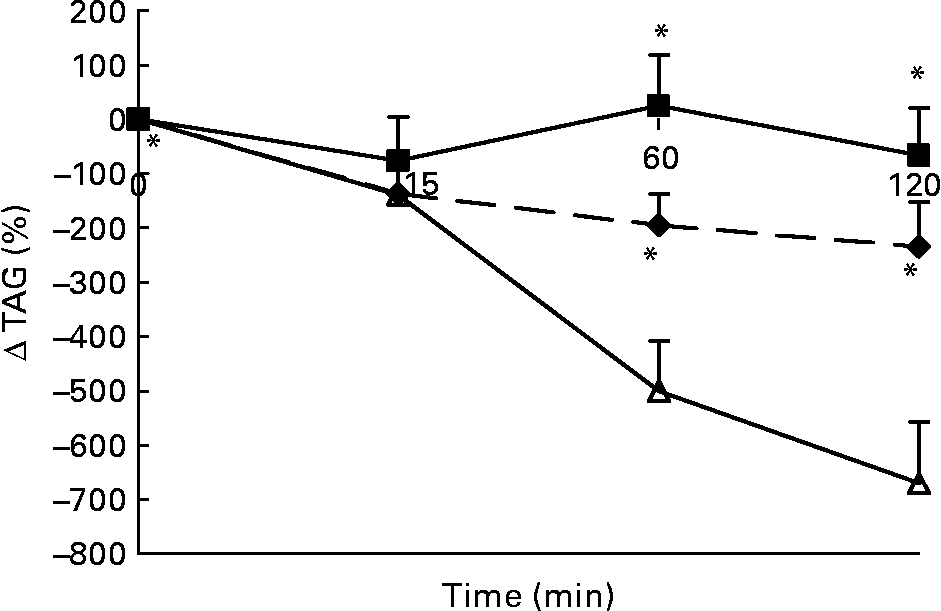
Fig. 4 Percentage of change in plasma TAG concentrations in sham-fed subjects (- -♦- -), subjects that ate the lunch (–■–) and in subjects given a water lunch (–△–). Values are means, with standard errors represented by vertical bars. * Mean value was significantly different from that after water (repeated-measures ANOVA; P < 0·05).
Changes in plasma glycerol concentrations in response to the lunch condition are presented in Fig. 5. Absolute plasma glycerol concentrations were significantly higher 15 min (F 1·242; P < 0·008) after the water lunch and 60 min (F 0·534; P < 0·03) after the water and MSF lunches compared with after the eaten lunch (ANCOVA; data not shown). The increase in plasma glycerol concentrations 15 min after the water lunch was significantly different from the decrease in plasma glycerol concentrations 15 min after the MSF and eaten lunches (ANOVA, F 20·903; P < 0·007; Fig. 5).
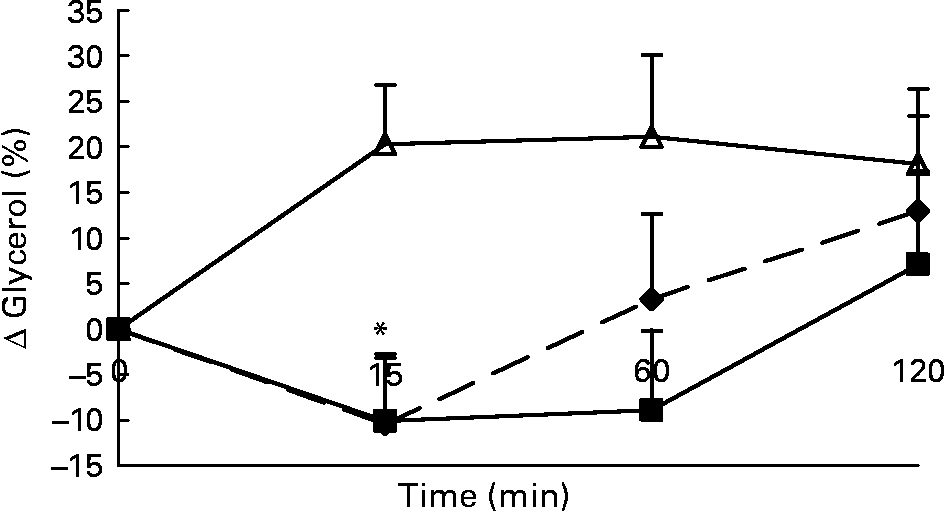
Fig. 5 Percentage of change in plasma glycerol concentrations in sham-fed subjects (- -♦- -), subjects that ate the lunch (–■–) and in subjects given a water lunch (–△–). Values are means, with standard errors represented by vertical bars. * Mean value was significantly different from that after water (repeated-measures ANOVA; P < 0·05).
Glucagon-like peptide 1
Changes in plasma GLP-1 concentrations in response to the lunch condition are presented in Table 2. Absolute plasma GLP-1 concentrations were significantly lower 15 min after the water lunch compared with after the MSF lunch. However, this was completely explained by significant differences in plasma GLP-1 concentrations at t = 0 (ANCOVA, F 78·211; P < 0·0001; Table 2). At 30 and 120 min after the water lunch, absolute plasma GLP-1 concentrations were significantly lower compared with after the eaten lunch (ANCOVA, t = 30: F 1·104, P < 0·02; t = 120: F 2·890, P < 0·04; Table 2). The increase in plasma GLP-1 concentrations in the eating condition was significantly different from the MSF and water conditions at each time point after lunch (ANOVA, t = 15: F 1·59; P < 0·01, t = 30: F 1·328; P < 0·0001, t = 60: F 1·91; P < 0·0001, t = 120: F 1·699: P < 0·0001; Table 2).
Ghrelin
Changes in plasma total active ghrelin concentrations in response to the lunch condition are presented in Fig. 6. Absolute plasma total active ghrelin concentrations were significantly higher 30 min after the water lunch compared with after the eaten lunch (ANCOVA, F 2·826; P < 0·05; data not shown). The decrease in plasma total active ghrelin concentrations 30 min after the MSF and eaten lunches was significantly different from the increase in plasma total active ghrelin concentrations 30 min after the water lunch (ANOVA, F 29·469; P < 0·04; Fig. 6).
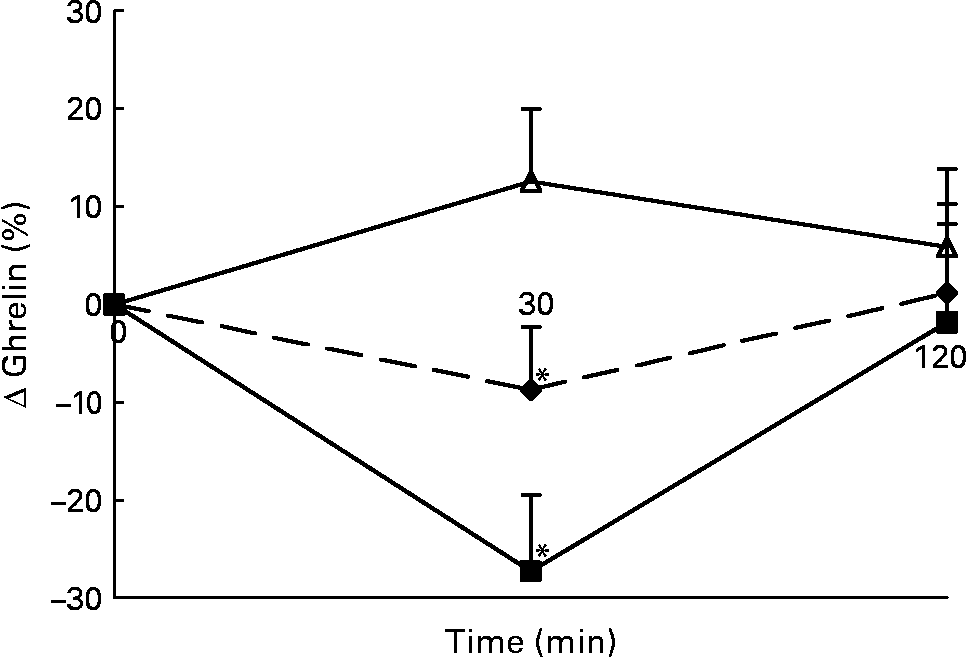
Fig. 6 Percentage of change in plasma active ghrelin concentrations in sham-fed subjects (- -♦- -), subjects that ate the lunch (–■–) and in subjects given a water lunch (–△–). Values are means, with standard errors represented by vertical bars. * Mean value was significantly different from that after water (repeated-measures ANOVA; P < 0·05).
Leptin
Changes in plasma total active leptin concentrations in response to the lunch condition are presented in Table 2. Eating, MSF and water ingestion had no effects on plasma leptin concentrations.
Appetite profile
Changes in VAS scores for satiety in response to the lunch condition are presented in Fig. 7. The increase in VAS scores for satiety in the eating condition was significantly different from the MSF and water conditions 85 min (F 15·91; P < 0·004) and 250 min (F 11·821; P < 0·02) after lunch (ANOVA; Fig. 7). The area under the curve of VAS scores for satiety (area-under-the-curve water 425 (sd 144) mm VAS × h; MSF 402 (sd 110) mm VAS × h; lunch eaten 500 (sd 147) mm VAS × h) were significantly different between the MSF condition or water condition, and the eating condition, but not between the water and MSF condition (ANOVA, F 3120·822; P < 0·0003; Fig. 7).
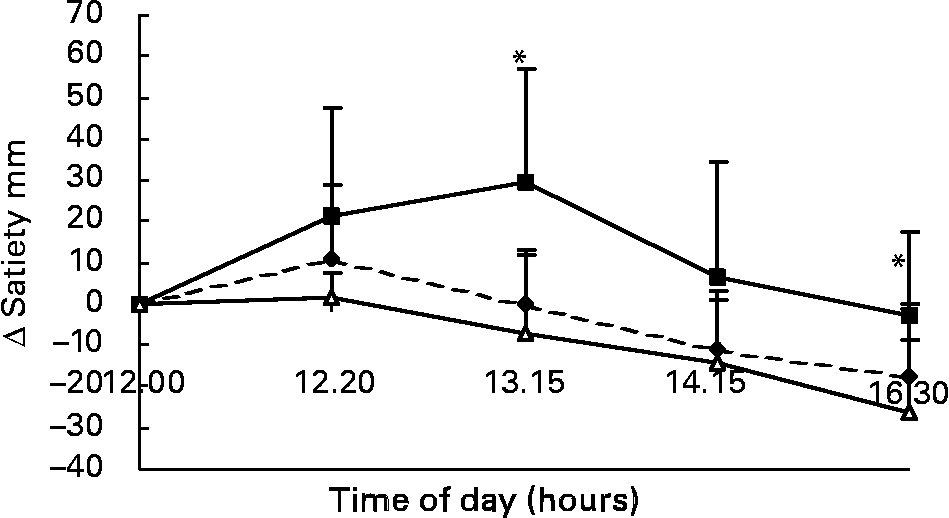
Fig. 7 Change in satiety scores on a visual analogue scale (mm) over 4·5 h after the lunch in sham-fed subjects (- -♦- -), subjects that ate the lunch (–■–) and in subjects given a water lunch (–△–). Values are means, with standard errors represented by vertical bars. * Mean value was significantly different from that after water (repeated-measures ANOVA; P < 0·05).
Discussion
In the present study, oral fat stimulation by MSF increased energy expenditure, plasma NEFA concentrations, and attenuated the decrease in plasma TAG and the increase in glycerol and active ghrelin concentrations up to 1 h after the MSF meal. Over a longer period of time, i.e. 24 h, oral fat stimulation had no effects on substrate oxidation, DIT or total energy expenditure. We kept circumstances before the test lunch as equal as possible.
Previously, we have observed increased sensory-specific satiety as well as increases in metabolite concentrations in the blood following oral fat stimulation by MSF(Reference Smeets and Westerterp-Plantenga4, Reference Smeets and Westerterp-Plantenga29). Here, we add an increase in post-MSF thermogenesis, for 1 h, to this. However, in the present study, the increase in satiety following MSF failed to reach significance.
The observed effects of oral fat stimulation by MSF and eating, a few hours after a high-fat breakfast, on plasma metabolites (NEFA, TAG and glycerol) has been named a ‘second-meal effect’. This ‘second-meal effect’ has been observed in previous experiments(Reference Mattes5–Reference Mattes7, Reference Mattes9, Reference Robertson, Jackson and Fielding12–Reference Jackson, Robertson and Fielding15, Reference Robertson, Jackson and Williams30), which have led to a ‘storage theory’. The appearance after a second meal of chylomicrons, containing fat from the first meal, has led to the idea that a proportion of fat from the first meal remains in the gut lumen or in the enterocyte and enters the plasma pool after ingesting a second meal(Reference Jackson, Robertson and Fielding31–Reference Evans, Kuusela and Cruz34). In the present study, MSF attenuated the decrease in TAG, which was observed 60 and 120 min after water ingestion. This observation may be due to oral stimulation with fat as we showed previously(Reference Smeets and Westerterp-Plantenga4). Plasma TAG were most probably elevated after breakfast and were still declining when the lunch was given. Moreover, the lunch was smaller (provided 20 % of each subject's specific daily energy requirements) in comparison with the breakfast (provided 30 % of each subject's specific daily energy requirements), which may have been of importance for the observed small increase in plasma TAG after the eaten lunch.
In line with this ‘storage theory’, we hypothesised that 2H-labelled palmitic acid added to a high-fat breakfast will reappear in the circulation and will subsequently be oxidised after a second, MSF or eaten, high-fat meal. The recovery of the 2H from the 2H-labelled palmitic acid in the present study was relatively high in comparison with the recovery found in two studies that have used a similar protocol(Reference Votruba, Zeddun and Shoeller35, Reference Westerterp, Smeets and Lejeune36). However, the 24 h recovery of the 2H-labelled palmitic acid in urine was not statistically different between the three conditions. This indicates that oral fat stimulation by MSF or eating did not affect the oxidation of 2H-labelled palmitic acid from the breakfast after possible reappearance.
Furthermore, the plasma fatty acid profile did not change after MSF (data not shown), which suggests that the observed increase in plasma NEFA was due to the release of NEFA from a mixed pool rather than from the previous meal (breakfast). The latter observation is supported by the similar 24 h recovery of the 2H-labelled palmitic acid added to the breakfast in the three conditions.
We observed a short effect of oral fat stimulation by MSF on plasma GLP-1 concentrations. After oral nutrient ingestion, GLP-1 is released into the circulation in a biphasic pattern(Reference Herrmann, Goke and Richter37). The early phase of GLP-1 secretion (after 10–15 min) has been suggested to be mediated by the autonomic nervous system rather than by direct nutrient contact with the L-cells(Reference Balks, Holst and von zur Muhlen38, Reference Rocca and Brubaker39). However, the higher plasma GLP-1 concentrations 15 min after the MSF lunch are most probably due to the significantly higher plasma GLP-1 concentrations before the MSF lunch compared with the two other lunches.
In the present study, oral fat stimulation by MSF suppressed active plasma ghrelin concentrations. This is in line with the observed significant suppression of plasma ghrelin when a meal was preceded by MSF by Heath et al. (Reference Heath, Jones and Frayn40).
Plasma leptin concentrations were not affected by eating or oral stimulation by MSF of fat over the course of 2 h.
The effects observed following MSF are unlikely to be produced by the ingestion of food, as shown by the high total recovery of the weights of the expectorated meals. Earlier oral stimulation studies have shown that the amount of food which is accidentally swallowed during MSF is no more than a few grams(Reference Mattes5, Reference Mattes7–Reference Mattes9, Reference Jackson, Robertson and Deane13, Reference Jackson, Robertson and Fielding15, Reference Robertson, Mason and Frayn16, Reference Heath, Jones and Frayn40).
The increase in MSF-induced energy expenditure similar to DIT of eating for 1 h shows the duration of the cephalic response. Until now the cephalic response has been observed as a pre-absorptive insulin response(Reference Bellisle, Louis-Sylvestre and Demozay41, Reference Strubbe42), by comparing eating the same foods yet hedonically different(Reference LeBlanc and Brondel43), or by consumption of unfamiliar food. Here we show that oral exposure to food, without ingestion of nutrients, induces anticipatory responses to food that result in increased energy expenditure comparable with the DIT of the same food being eaten, for 1 h.
Together with the observations of the re-appearance of metabolites, and the previous observations on satiety, from our and other studies, we conclude that the metabolic effects of oral exposure to fat are multi-factorial and last at least up to 1 h. Studies in which oral exposure to fat was combined with a (gastric) fat load and/or given in the fasted state have observed effects on TAG concentrations for a longer period of time, which suggests that differences in, for instance, the metabolic state of the subjects or the fat-containing oral stimulus may influence physiological responses(Reference Mattes6–Reference Mattes9, Reference Robertson, Mason and Frayn16).
These findings indicate that metabolism is triggered during eating even before nutrients are absorbed. This triggering mechanism may serve as a feed-forward system to optimise the absorption and utilisation of nutrients(Reference Powley44). The physiological anticipatory responses to food due to mere sensory exposure may be interpreted as being advantageous and disadvantageous. If the available metabolites (after re-appearance in blood plasma) will be oxidised, then a greater amount of dietary fat will be oxidised and not stored in fat tissue. Recently, a difference in trafficking of dietary fat was shown in obesity-prone and obesity-resistant rats(Reference Jackman, Kramer and Maclean45). The obesity-resistant phenotype was associated with greater oxidation and less storage of dietary fat than was the obesity-prone phenotype. In a recent human study, dietary fat oxidation was negatively related to percentage body fat, and lean subjects had the highest and obese subjects the lowest values(Reference Westerterp, Smeets and Lejeune36). Thus, increasing the availability of oxidisable metabolites in blood plasma due to mere sensory exposure may be beneficial for dietary fat oxidation. However, this effect on dietary fat oxidation may be rather small, because we observed no effect of mere sensory exposure on dietary fat oxidation over a period of 2–24 h. Raised TAG and NEFA in the postprandial state contribute to the obesity-associated pathologies such as type 2 diabetes, atherosclerosis and hypertension. It is therefore of importance to clarify the mechanisms behind the metabolic effects observed after the consumption of high-fat foods, and whether these are influenced by the oral exposure to fats and the preceding meal. Summarising, mere sensory exposure to meals rich in specific fatty acids has effects on physiological and metabolic variables that resemble the effects observed after eating, which last up to 1 h. Just oral signals from fat, without contributing to energy intake, contribute to metabolic satiety for up to 1 h. Effects of oral fat perception by MSF contributed to energy expenditure, lowered plasma active ghrelin concentrations and mimicked the effects on metabolites observed after eating in the postprandial state for up to 1 h.
Acknowledgements
The study was sponsored by Top Institute Food and Nutrition, Wageningen, The Netherlands and by the European project DiOGenes (contract no. FP6-513946).
We thank Maartje Spetter, Krista Morren, Loek Wouters and Paul Schoffelen for their contributions to the study. A. J. S. designed the experiment, collected the data, analysed the data and wrote the manuscript. M. P. L. collected data and helped write the manuscript, M. S. W.-P. designed the experiment, helped analyse the data and write the manuscript, and supervised the project. None of the authors had any financial or personal interest in any company or organisation sponsoring the research.


