


Obesity is a major health problem worldwide and causes many health problems, either alone or in combination with other diseases such as type 2 diabetes, insulin resistance and non-alcoholic fatty liver disease (NAFLD). Studies have shown that 70–80 % of NAFLD patients are obese, especially abdominal obesity(Reference Angulo1–Reference Kahn, Hull and Utzschneider3). Obesity is also considered an independent risk factor for the development of non-alcoholic steatohepatitis (NASH), but lean NAFLD or non-obese patients are also described in the recent criteria based on BMI > 25 kg/m2 for Caucasian subjects and > 23 kg/m2 for Asian subjects. Pathophysiological mechanisms for lean NASH are not defined, but some factors such as genetic, gut microbiota and epigenetic modifications may influence disease pathogenesis and progression. The NAFLD spectrum shows a progression from simple steatosis to fibrosis, cirrhosis and end-stage liver disease. The aetiology of obesity is complex, and genetic, environmental, and dietary factors contribute to obesity-related NASH(Reference Gupta, Chaudhory and Sukriti4). Recent research has been attracted to understanding the role of the gut microbiota and their derived metabolites in dyslipidemia and lipid metabolism in obesity related to NASH. Liver biopsy has a long history as the gold standard for the classification of liver inflammation and fibrosis. It has been used as a reference in modern medicine(Reference Brunt, Janney and Di Bisceglie5,Reference Liang, Menke and Driessen6) . Many biochemical and serum/plasma markers of liver disease have been further investigated with specificity and sensitivity, but these measurements are not readily available in routine practice. The healthcare system has not yet been established as a serious disease condition. Fatty liver disease biomarkers that reflect the biological processes underlying disease risk may be another way to characterise the disease condition. However, there are poor liver biomarkers associated with the stage and severity of the disease. A major problem with these markers is their inability to distinguish subtle changes in disease condition and severity. High-fat-induced obesity in rodents is a widely used model to study the mechanisms behind metabolic diseases such as insulin resistance, diabetes and liver disease. In this model, rats are fed a high-fat diet (HFD) for weeks and months, typically with 40–60 % of their energy content coming from fat. As a result, rats develop abdominal fats characterised by weight gain, obesity and increased liver enzyme levels(Reference Kleinert, Clemmensen and Hofmann7,Reference Maric, Krieger and van der Velden8) . Metabolic consequences of obesity differ between men/women and in rodent models of obesity and metabolic syndrome and lead to obesity by multiple mechanisms(Reference Maric, Krieger and van der Velden8–Reference Van Heek, Compton and France10). First, it reduces the energetic intake of the animal due to the high energy content of fatty foods. Second, a HFD reduces metabolism and energy use, resulting in energy imbalance and deposition of fat in the tissues (adipose and liver). Third, a HFD alters the gut microbiota and increases the intake of high-fat foods, thereby promoting fat storage. The rat model of HFD-induced obesity is widely used to study the pathophysiology of metabolic diseases and to test clinical services. These models help identify new targets for drug development and explore the effectiveness of various drugs and diets. Overall, the HFD model provides a better understanding of the complex mechanisms underlying metabolic diseases and makes important contributions to our understanding of the pathophysiology of obesity and metabolic diseases. Several mouse models (those without methionine/choline) have also been useful for the analysis of NASH pathophysiology(Reference Warden and Fisler11) and are therefore important tools for studying and identifying protein markers in disease pathogenesis(Reference Speakman12).
One of the most important changes in obesity is abnormal lipid metabolism. Eating more food causes more fat in the liver, which overwhelms the liver’s ability to oxidise and store, creating lipid droplets and lipid peroxidation in hepatocytes. Another liver injury associated with obesity is inflammation and adipokines secretion such as adiponectin, resistin, leptin and TNF-α. Fat accumulation in the liver leads to an inflammatory response that leads to failure of the immune system such as macrophages and Kupffer cells. Insulin is also a change that occurs in the liver during obesity, where body cells produce fewer hormones, reducing glucose absorption and metabolism. Insulin can also be produced in the liver, leading to increased glucose production and glycogen synthesis. These changes in obesity lead to the development of NAFLD/NASH and metabolic disorders(Reference Woods, Seeley and Rushing13,Reference Sang, Qu and Gu14) .
Advances in technology can facilitate the study of biological events as they provide important information during pathogenesis and disease development(Reference Tannu and Hemby15). Proteomic analysis can help identify changes in protein expression in the early stages of the disease and provide insight into the molecular mechanisms and therapeutic targets of these diseases. Advances in the diagnosis of these diseases need to be translated into treatment before a liver biopsy can be passed on as a diagnostic tool to evaluate the disease. Overall, quantitative liver proteomic analysis has emerged as a powerful tool to identify novel biomarkers and therapeutic targets for liver disease and inflammation. With advances in MS and bioinformatics analysis, it has become a useful method for studying the liver proteome.
Differential gel electrophoresis (DIGE) technology has been used to provide a useful tool for cost-effective proteomic experiments with 2D gel electrophoresis. DIGE combines spectrally soluble fluorescent dyes (Cy2, Cy3 and Cy5) with multiplexing patterns for rarefied contrasts and uses an internal procedure to analyse reproducible patterns across multiple experiments, providing unmatched reliability for 2D gel-based contrast material. DIGE experiments can be easily performed with a sufficient number of independent (biological) replicates to control for individual size differences required in clinical trials. Multivariate statistical analysis can be used to evaluate global variation in a complex set of independent models, filtering out noise from technical variation and normal biological variation and focusing on fundamental variation that can explain different diseases(Reference Satoor, Puranik and Kumar16). We hypothesised that high-fat-induced obesity dysregulates hepatic metabolism. We have developed a diet-induced obesity rat model for the evaluation of early hepatic (liver) proteomic signatures. The aim of this study is to understand the liver proteome profile and underlying liver proteomic signatures in HFD-induced obesity and to evaluate disease conditions such as obesity-associated steatohepatitis (NASH).
Materials and methods
Experimental animal models
Animal models are being developed for research at the National Centre for Cell Science (NCCS). Six-week-old male Wistar rats were placed on a HFD (n 7) or a normal diet (ND) (n 6) for 24 weeks and fed approximately 40 % HFD (40% fat, 28% protein and 32% carbohydrate) and ND (20% fat, 20% protein and 60% carbohydrate) as HFD and ND(Reference Hardikar, Satoor and Karandikar17,Reference Wiśniewski, Zougman and Nagaraj18) . Rats were maintained with free access to water and food and a 12:12 h light–dark cycle. Animals were acclimated to standard conditions for the first 3 d and then fed a control or HFD for up to 24 weeks(Reference Wiśniewski, Zougman and Nagaraj18). Each rat’s body weight was monitored for up to 24 weeks. Plasma was obtained from blood (EDTA-coated vials) by centrifugation and stored at –20°C for liver function tests. All animals were killed under anesthesia, and liver lobes were immediately excised and cut into small pieces for experimentation. Two small sections of liver lobes were fixed in 10% neutral-buffered formalin for histological analysis, and the remaining liver was frozen in liquid N2 for subsequent proteomic analysis. NASH patients (n 20) were characterised by biopsies obtained from the GB Pant\Biobank Facility at ILBS Hospital, Delhi, India, with consent and permission for further validation of liver markers.
Ethical approval
All animal model protocols and procedures were approved by the NCCS, Pune, India. The research approval was granted by the Animal Ethics Committee. All biopsy-proven NASH patients (n 20) (BMI greater than 25 kg/m2) obtained informed consent from patients admitted to GB Pant/ILBS Hospital (Biobank Facility). The diagnosis of NAFLD in subjects was based on: ultrasound scan/Fibroscan, evidence of liver disease on histological examination and exclusion of other causes of liver disease (positive for HbsAg, positive for HBcAg, positive for HCV RNA and positive for anti-HCV). Those who consume more than ≥ 20 g of alcohol per d were excluded. The histological grading and staging of NAFLD are based on the Brunt scoring system. Two doctors classified the patients as having fibrosis grades 0–4, G.B. Pant Hospital/ILBS, New Delhi, India, and the study was approved by the Hospital Ethics Committee. Written informed consent was obtained from all patients when a liver biopsy was performed.
Liver enzyme analysis
Liver enzymes such as aspartate aminotransferase (AST or SGOT), alanine aminotransferase (ALT or SGPT), alkaline phosphate, bilirubin and albumin levels were determined by an automated test at G. B. Pant Hospital and Institute of Liver and Biliary Sciences (ILBS), New Delhi.
Histology
Formalin-fixed and paraffin-embedded liver tissues (from the rat groups) were processed daily for haematoxylin–eosin (H&E) staining. Liver histology was examined under normal light and then graded according to the degree of hepatocellular steatosis, inflammation and ballooning as previously described. Briefly, the degree of steatosis was graded from 0 to 4 based on the percentage of fat deposited in hepatocytes per x20/40 magnification field under H&E staining(Reference Brunt, Janney and Di Bisceglie5,Reference Liang, Menke and Driessen6) .
Preparation of liver protein from frozen tissue
Frozen tissue was homogenized (300 mg–500 mg) in homogenisation buffer as previously described(Reference Bradford19). The homogenised liver fraction was centrifuged at 3000 g for 15 min. The pellet was dissolved in 5–10 ml of lysis buffer, depending on the protein content. The homogenous suspension was then sonicated six times at 100 W (on\off for 30 sec each) and further centrifuged at 12 000 g for 30 min at 40°C. Supernatants were collected and stored at –80°C for later use(Reference Bradford19).
Protein concentration
Protein concentration was determined using a commercial Bradford reagent (Bio-Rad). To estimate the protein content, a standard curve was drawn using different concentrations of bovine serum albumin (BSA). The final volume was 200 µl (10 µl of total liver protein lysates + 190 µl of 1X Bradford reagent for each sample) to estimate protein concentration in the sample preparation. Absorbance was measured at 595 nm. The concentration of the protein was estimated by plotting the standard curve of the protein’s A595 v. BSA. Supernatants containing all liver proteins were dissolved in isoelectric, focusing compatible 2D rehydration or sample buffer(Reference Blundon, Ganesan and Redler20).
Protein labelling and 2D differential gel electrophoresis
We created four experimental pooled sets for differentially expressed hepatic protein profiles of rat models. Two experimental sets were prepared: three (n 3) samples in each group from HFD and ND for 2D-DIGE (Cy2, Cy3 and Cy5) fluorescent labelling. DIGE involves labelling proteins with fluorescent dyes (Cy2, Cy3 and Cy5) to reduce cysteine thiols prior to 2D-PAGE. Cy2, Cy3 and Cy5-labelled liver lysates (20 ug each) were prepared according to the protocol described in the EttanTM DIGE user manual. First, dimension gel electrophoresis was performed using an immobilised pH gradient gel (Immobiline Dry Strip, pH 3–10 linear, 7/17 cm). Two-dimensional separations were performed on 12 % SDS polyacrylamide gels. Images labelled Cy2, Cy3 and Cy5 were acquired by a Typhoon 9410 scanner (GE Healthcare) at excitation/emission (nm) values of 488/520, 532/580 and 633/670, respectively. DIGE images were analysed using DeCyder v.5.02 software (GE Healthcare). Proteins with a two- to four-fold density difference were identified as ‘differential proteins’ and were removed from the preparatory gels for in-gel digestion and matrix-assisted laser desorption ionization-time of flight (MALDI-TOF) protein identification(Reference Dyballa and Metzger21).
Isoelectric focusing and two-dimensional gel electrophoresis
One-dimensional gel electrophoresis was performed on 7/17 cm pH 3–10 non-linear IPG strips according to the manufacturer’s protocol (Bio-Rad) with minor modifications. Protein samples were loaded the recommended amounts according to the IPG band size (7/17 cm) and performed isoelectric focusing using the standard 7/17 cm isoelectric focusing protocol. After isoelectric focusing, the strips were first equilibrated for 15 min in 6M urea, 2 % SDS, 0·5M TRIS-HCl pH 8·8, 2 % DTT and 20 % glycerol buffer and then again for 15 min in the same buffer free of 2·5 % iodoacetamide. After equilibration of the strips, they were placed on 10–12 % polyacrylamide gel for 2D gel electrophoresis. The bands were covered with molten agarose and were run at 100–120 V until the indicator dye comes out of the gel. The gel was then fixed in 50 % ethanol and 10 % acetic acid (v/v) overnight, washed with distilled water for 3 × 10 min, and stained with a silver or colloidal Coomassie blue stain for approximately 24 h with gentle agitation (Bio-Rad). The gel was rinsed twice with 100 ml of distilled water (3–5 min each time), and Coomassie Brilliant Blue working solution was added to the gel and stained for at least 24 h. Stains can be seen when the gel is stained with autoclaved distilled water(Reference Käll, Canterbury and Weston22).
Image analysis
Stained gels were printed with a Typhoon 9410 scanner and analysed with PD Quest software (version 8.0, Hercules, CA 94 547). The software allows quantification by volume (area × density) and normalises all staining intensity values by correcting for gel-to-gel variation in total protein loading. Individual spot volumes were calculated and combined to determine the average size (n 3). Two or more proteins are removed from the cells followed by trypsinisation for protein analysis by MS.
In-gel trypsinisation of proteins
The protein stain of interest was removed/cut from at least three separate gels of the polyacrylamide gel, and the mixed gel slices were shaken in 100 µl of stain removal solution for 5 min. After removing the solution, the gel spots were incubated with 200 mM of ammonium bicarbonate for 20 min. The gel was then dried with 100 µl of acetonitrile and dried in a vacuum centrifuge. The dried gel was then rehydrated with 20 µl of 50 mM ammonium bicarbonate containing 0·2 µg of modified trypsin (Promega) for 45 min on ice. After removing the solution, 30 µl of 50 mM ammonium bicarbonate were added. Digestion was then performed overnight at 37°C.
Mass spectrometry
All the MS protein identification was performed at the collaborative Proteomics Resource Facility at IGIB and The Centre for Genomic Applications (TCGA), New Delhi. In brief, lyophilised peptides of protein obtained after trypsin digestion were diluted in 0·6 µl of dilution solution (50 % acetonitrile/0·1 % trifluoroacetic acid). Reconstituted peptides (0·6 µl) and fresh α-cyano-4-hydroxycinnamic acid (0·6 µl) (Bruker Daltonic) were placed on 384-well MALDI plates and analysed by MALDI-TOF MS. Automated peptide mass spectra were generated for protein identification (peptide mass fingerprinting) and stored in a house database(Reference Perkins, Pappin and Creasy23).
Protein identification and pathway analysis
Peptide Mass Fingerprint (PMF) data for protein identification is analysed using the Mascot search engine against the NCBI database. The list of peaks in the raw spectrum is based on the threshold obtained after removing trypsin, aggregate, and noise peaks and is subject to database queries for protein identification (ID). The PMF search was organised as follows: the database was searched with the Mascot search engine (NCBI database) (www.matrixscience.com). A Mascot score above 50 was considered a cut-off, the molecular mass was not capped, and a coverage of > 25 % was accepted. A mass tolerance of 50 ppm and at least five matching peptides were also used for protein identification. Only proteins showing significant matches were considered in this study. All detected differentially expressed proteins were assigned markers and compared with the rat liver proteome according to the Protein Database (http://www.pantherdb.org/)(Reference Bajpai, Davuluri and Tiwary24).
STRING tools analysis of protein–protein interactions
Protein–protein interaction (PPI) analysis provides information about the function and regulation of proteins in biological systems. The STRING database is a powerful tool for the analysis of PPI networks of identified proteins and identification of new targets or pathways. In the STING software tool, we entered the liver proteins identified on the list. To access the STRING database: first go to the STRING website and enter the protein names (https://string-db.org/). Setting the protein of interest should be remembered, and the desired confidence level for the correlation score should be selected. Network results show interactions between protein and other proteins in the data. Many data sources are used to make predictions, including genomic content, experiments, and mining data. These identified protein clusters were analysed to identify protein clusters with similar functions or pathways. The main components of these categories were further described in more detail through qualitative analysis. The PPI network is shown in the description. Higher scores indicate stronger evidence of physical interactions between proteins. We should click the button to see the details of the protein and its interactions with other proteins in the network. Using the Results tab, we explore how to effectively analyse biological processes, cellular components and molecular functions. Data are represented as network downloads and export to analysis software such as Cytoscape for further analysis and visualisation. Protein classification is based on molecular functions, biological processes and cellular components using Gene Ontology (GO) analysis. IPA analysis Codes from Swiss Prot were entered into Ingenuity Pathways Analysis (IPA) software (Ingenuity Systems), which uses protein locations in cellular compartments to classify products and identify them biochemically, molecularly and biologically. These proteins were correctly identified for disease and function and the canonical pathway, and then the z-score and P-value were calculated accordingly(Reference Yan, Gong and Song25).
Western blot of liver-specific arginase-1
Twenty micrograms of liver lysates were separated by 10 % SDS-PAGE and transferred to the membrane. Non-specific binding of antibodies is prevented by blocking, and they were incubated with primary antibody of Arg-1 (1:100 dilutions) at room temperature or overnight at 4°C. The washing steps were repeated, and the blot was incubated with HRP-conjugated secondary antibody (1:500 dilutions) for 1 h at room temperature with gentle agitation. Target protein bands were visualised after being developed with substrate and quantified by ‘ImageJ’ software and normalised with the housekeeping gene β-actins (Cat No. HRP-66009, Proteintech).
Immunohistochemistry
Immunohistochemical analysis of Arg-1 was performed with a polyclonal antibody (Abcam-ab215894) at a 1:200 dilution. Liver sections (from rats and NASH patients) were pretreated with heat-induced epitope recovery in 0·01 M of citrate buffer (pH 6·0) at 95°C for 3 min, cooled to room temperature, quenched with 1 % hydrogen peroxide, blocked with anti 5 % BSA, and incubated overnight 4°C. For detection, we used HRP-labelled secondary antibody (Polyexcel HRP/DAB Detection System conjugated to 3–3'-diaminobenzidine (DAB) as a chromogenic reagent) according to the manufacture’s guidelines. Briefly, slides (DAB) were developed with chromogen for 5 min and counterstained with haematoxylin. To reduce pseudo-staining, positive and negative controls were stained simultaneously using 1° and 2° antibodies, respectively(Reference Koteish and Diehl26).
Statistical analysis
All data are expressed as mean and standard deviation. The differences between the two diet groups were analysed by t test in SPSS software version 11. Differences were considered significant at P < 0·05.
Results
Characterisation of high-fat rat models
Liver weight\enzymes, body weight and histology
Total liver weight and body size during feeding were significantly higher in rats fed the HFD compared with normal feeding. Differences in body weight between comparison groups became significant after several weeks of feeding, and significant differences were observed at the end of the 24-week study (160·0 ± 9·3 to 737·2 ± 25·5 g, P < 0·001). We have not observed significant differences in the food intake of both groups (HFD v. ND). The HFD group consumed approximately 40–50 g/d and about 35–45 g/d compared with the control group (ND). There were no significant changes in serum ALT (U/L) levels in ND and HFD groups (19 ± 5 v. 25 ± 8, P < 0·08). In contrast, significant levels of AST (U/L) (107 ± 28 v. 729 ± 32, P < 0·001) and alkaline phosphatase (IU/L) (55 ± 11 v. 81 ± 15, P < 0·01) were observed in HFD group, indicative of liver injury in these rats (Table 1). Furthermore, histological examination of the liver (HE) clearly showed fat deposits in hepatocytes of HFD rats compared with controls (Fig. 1(a) and 1(b)). No signs of inflammation or fibrosis were observed in HFD rats until 24 weeks after HFD feeding.
Table 1. Biochemical measurements in normal and high-fat diet fed rats
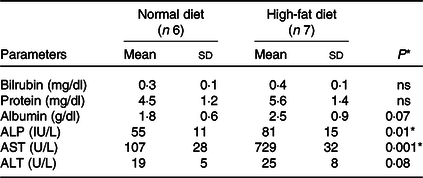
ALP, alkaline phosphatase; AST, aspartate aminotransferase; ALT, alanine aminotransferase.
Data are presented as mean ± s d.
* P < 0·05 is considered significant.

Fig. 1. Characterisations of high-fat diet-induced obesity in rats including body weight and biochemical markers. (a) Whole-body weight and liver weight were obtained for each animal, and blood was obtained to assess for ALT, AST and TAG levels. Values were shown as mean and standard deviations based on 6–7 animals per group. Statistical significance was assessed by ANOVA, followed by a two-tailed t test. Asterisks ($) indicate statistical difference between the comparable groups at P < 0·05. (b) Histological features. H&E-stained liver sections from the groups were evaluated for hepatic steatosis, ballooning hepatocyte degeneration and inflammation by two pathologists who did not know the treatment group from which the section was obtained. Hepatocytes with clear cytoplasm and non-displaced nuclei represent hepatocyte morphology with ballooning degeneration and steatosis. Not much inflammation is visible between the groups.
Quantitative liver proteomic profiles in normal- and high-fed obese rat models
Quantitative analysis was performed using 2D-DIGE. 2D-DIGE images obtained from profiles of the whole liver proteome (ND and HFD) are shown in Fig. 2(a). Approximately, 250–300 protein spots were resolved by 2D gel electrophoresis between comparison groups, and fifty-two protein spots were marked and successfully identified by MALDI-TOF. Protein staining was successfully collated on 2D gels using PD Quest software and compared based on relative expression intensity between ND and HFD groups (Fig. 2(b)). The identified protein spots are listed in Table 2, and eighteen spots showed significantly different expression profiles compared with their corresponding controls. This was reflected in significant changes in the optical density and size of the protein spots and greater than 2·0- to 4·0-fold expression differences between comparison groups (Table 3). Eighteen spots were considered differentially expressed proteins with altered expression and listed in comparable groups as up-regulated and down-regulated proteins (Fig. 3(a)).
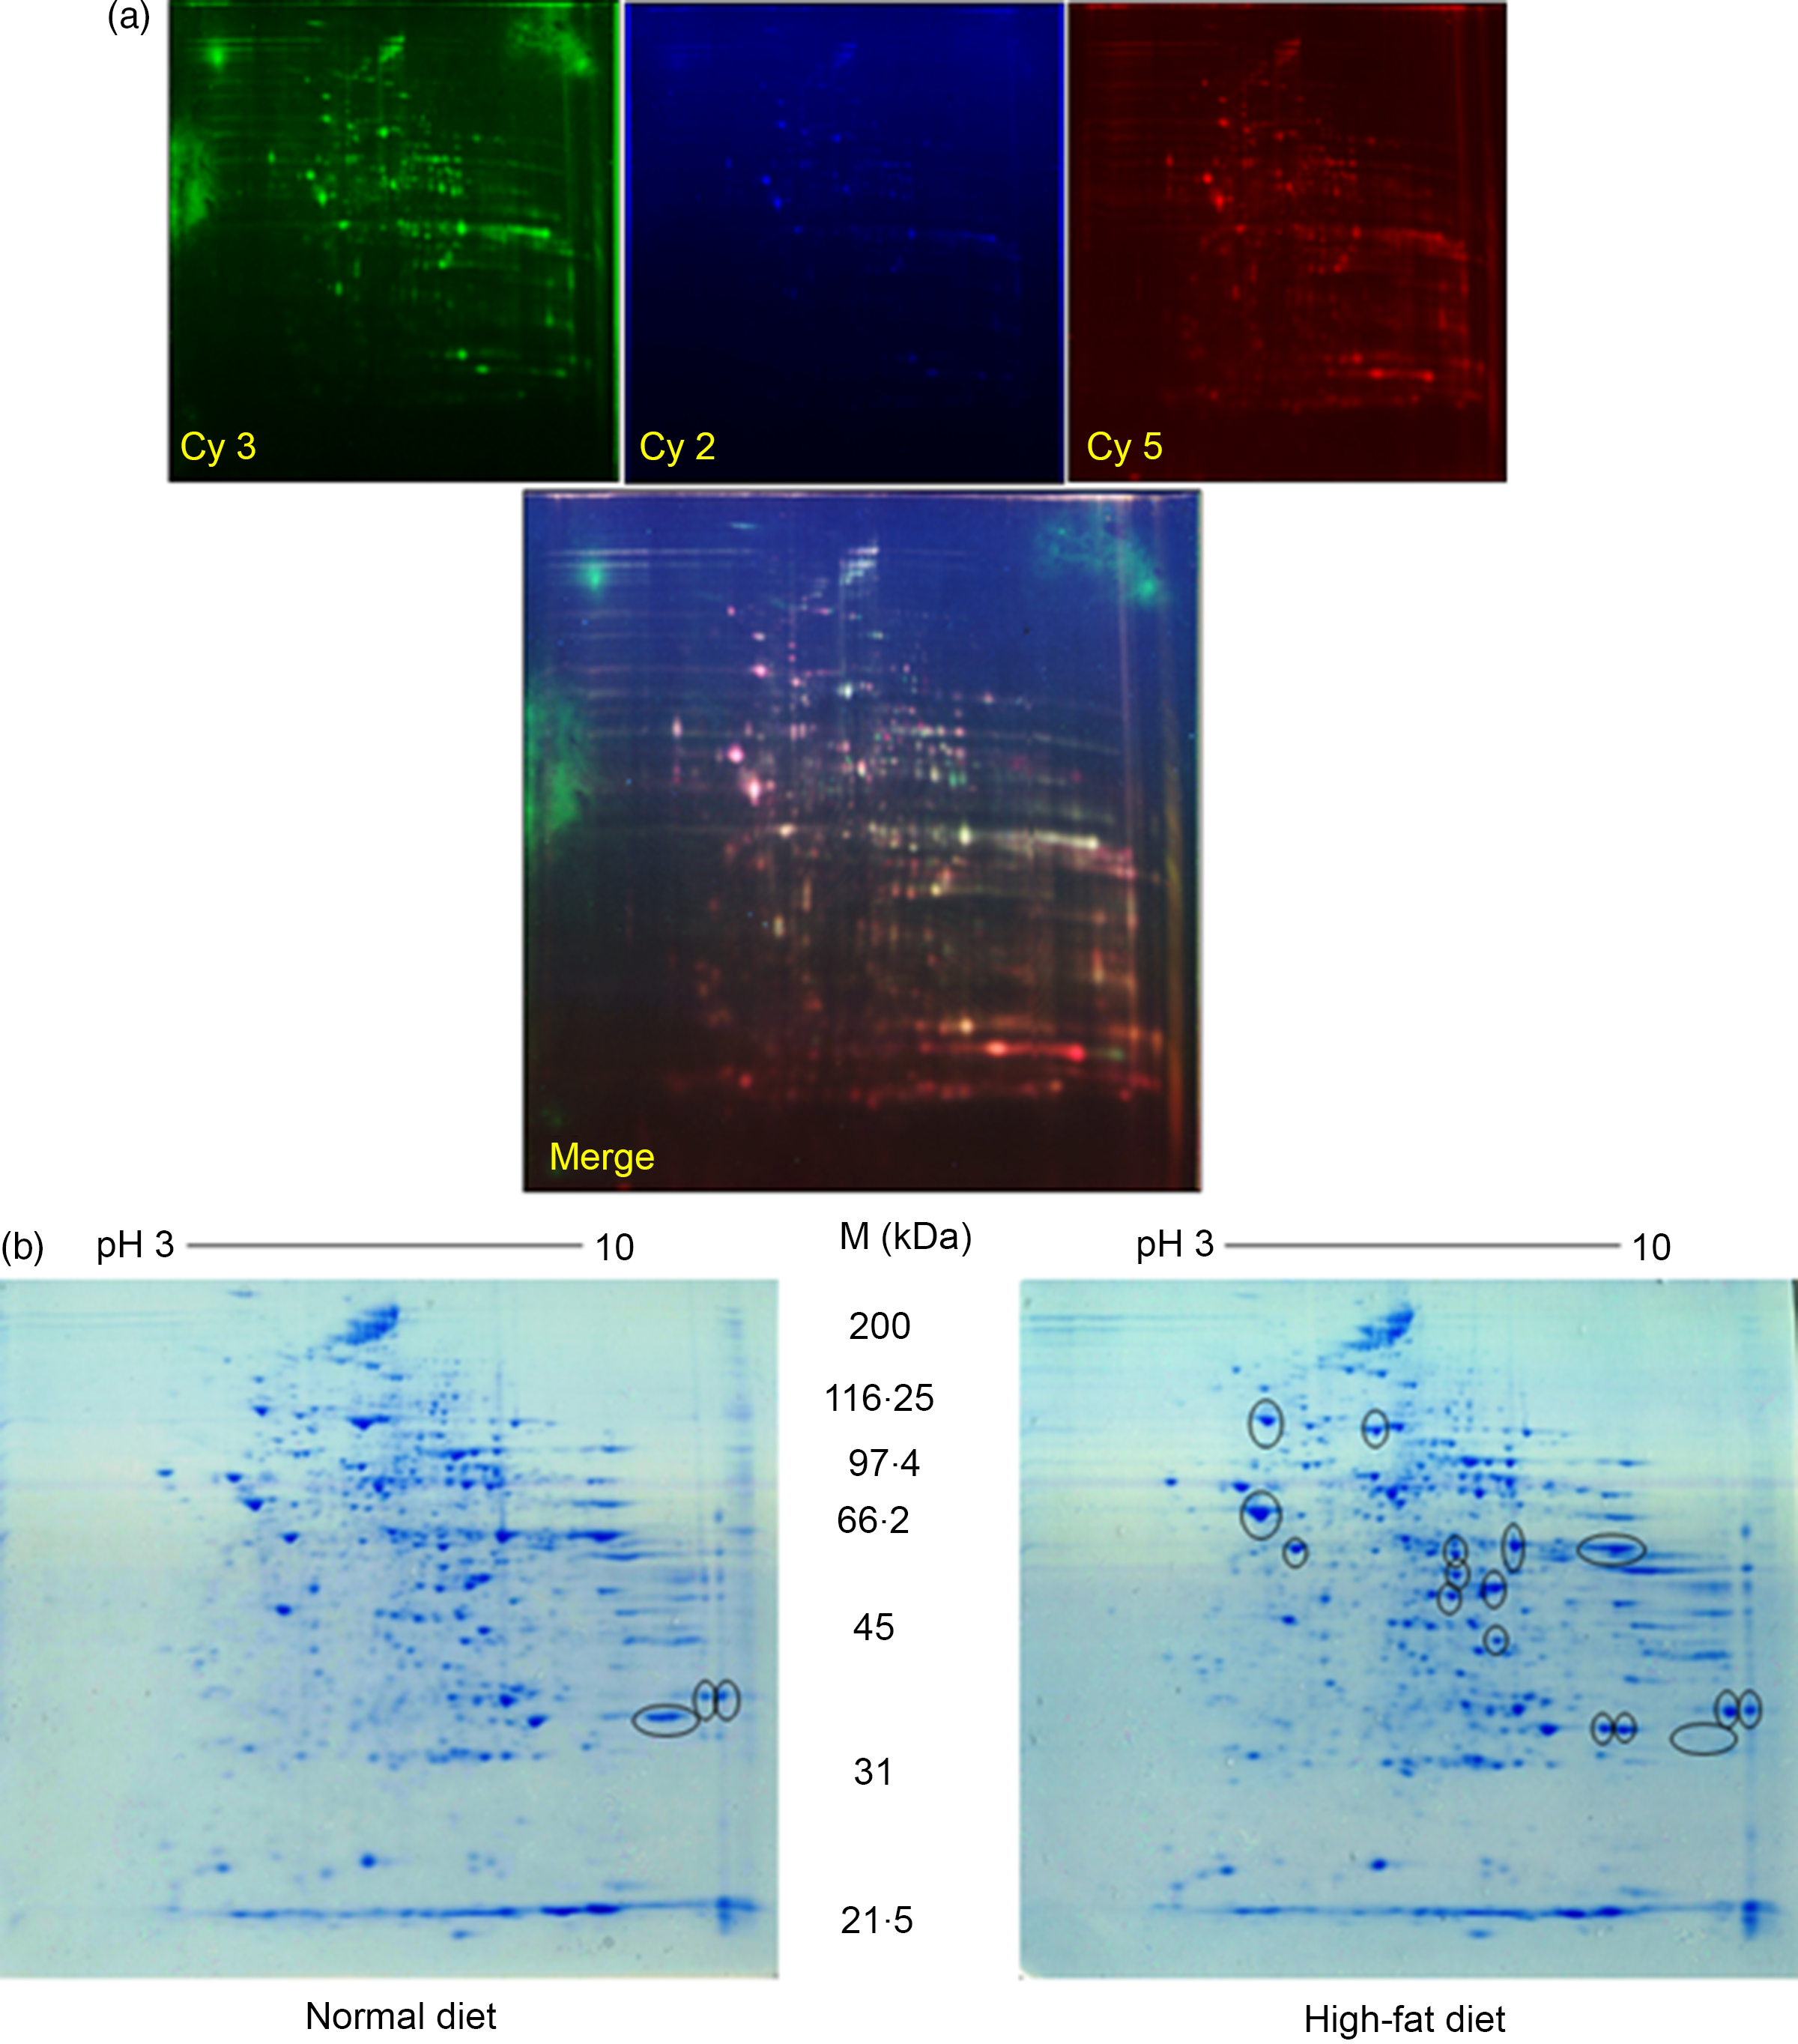
Fig. 2. Proteomic analysis: (a) representative two-dimensional gel electrophoresis gel images of total liver protein homogenate. Proteins were extracted and separated into IPG strips (pH 3–10) for the first dimension, followed by 10 % (w/v) PAGE for the second dimension. Similarly, liver lysates were prepared and subjected to (DIGE) two-DE image of HF and controls rat for hepatic protein patterns, obtained by DIGE. Spots in green and red correspond to protein samples from HF and control groups, respectively. Overlap between green and red spots results in yellow spots (spots in common in both patterns) that were visualised in the Typhoon 9410 gel analyser. (b) Representative simple two-dimensional gel electrophoresis gel images of differential expression patterns of liver proteins in normal and high-fat fed rats.
Table 2. List of identified hepatic proteins by MALDI-TOF of comparable groups (normal and high-fat fed rats)*
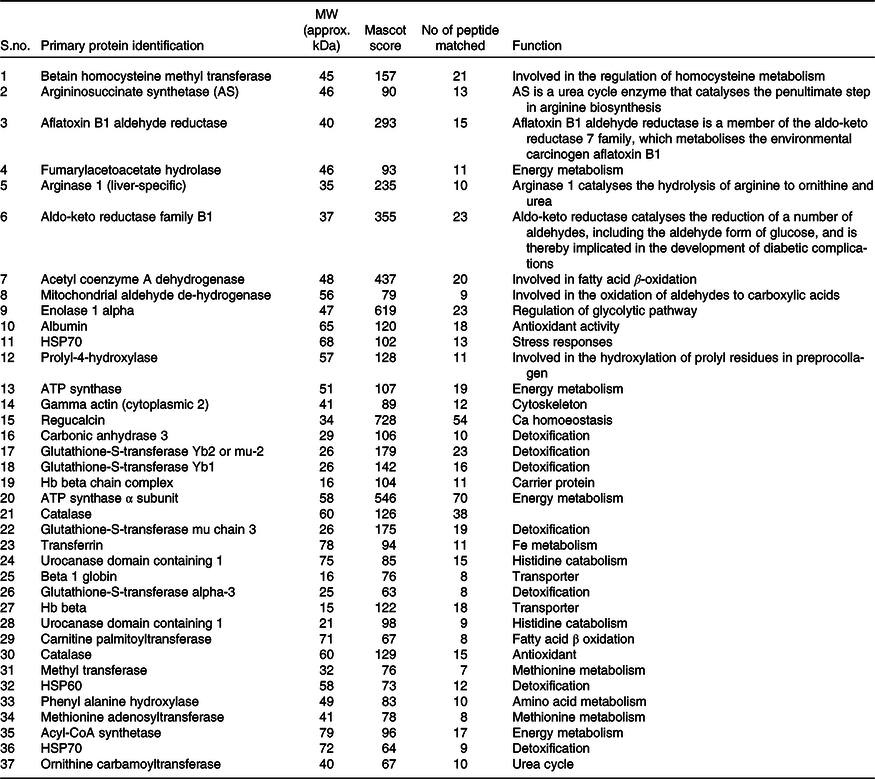
* Low Mascot (below 50) scored proteins were not listed above.
Table 3. List of differentially expressed hepatic proteins in response to high-fat fed rats
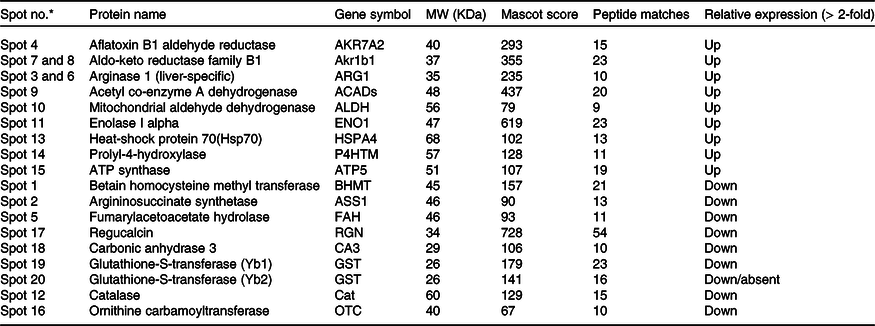
* Marked the spot number as shown in Fig. 3.
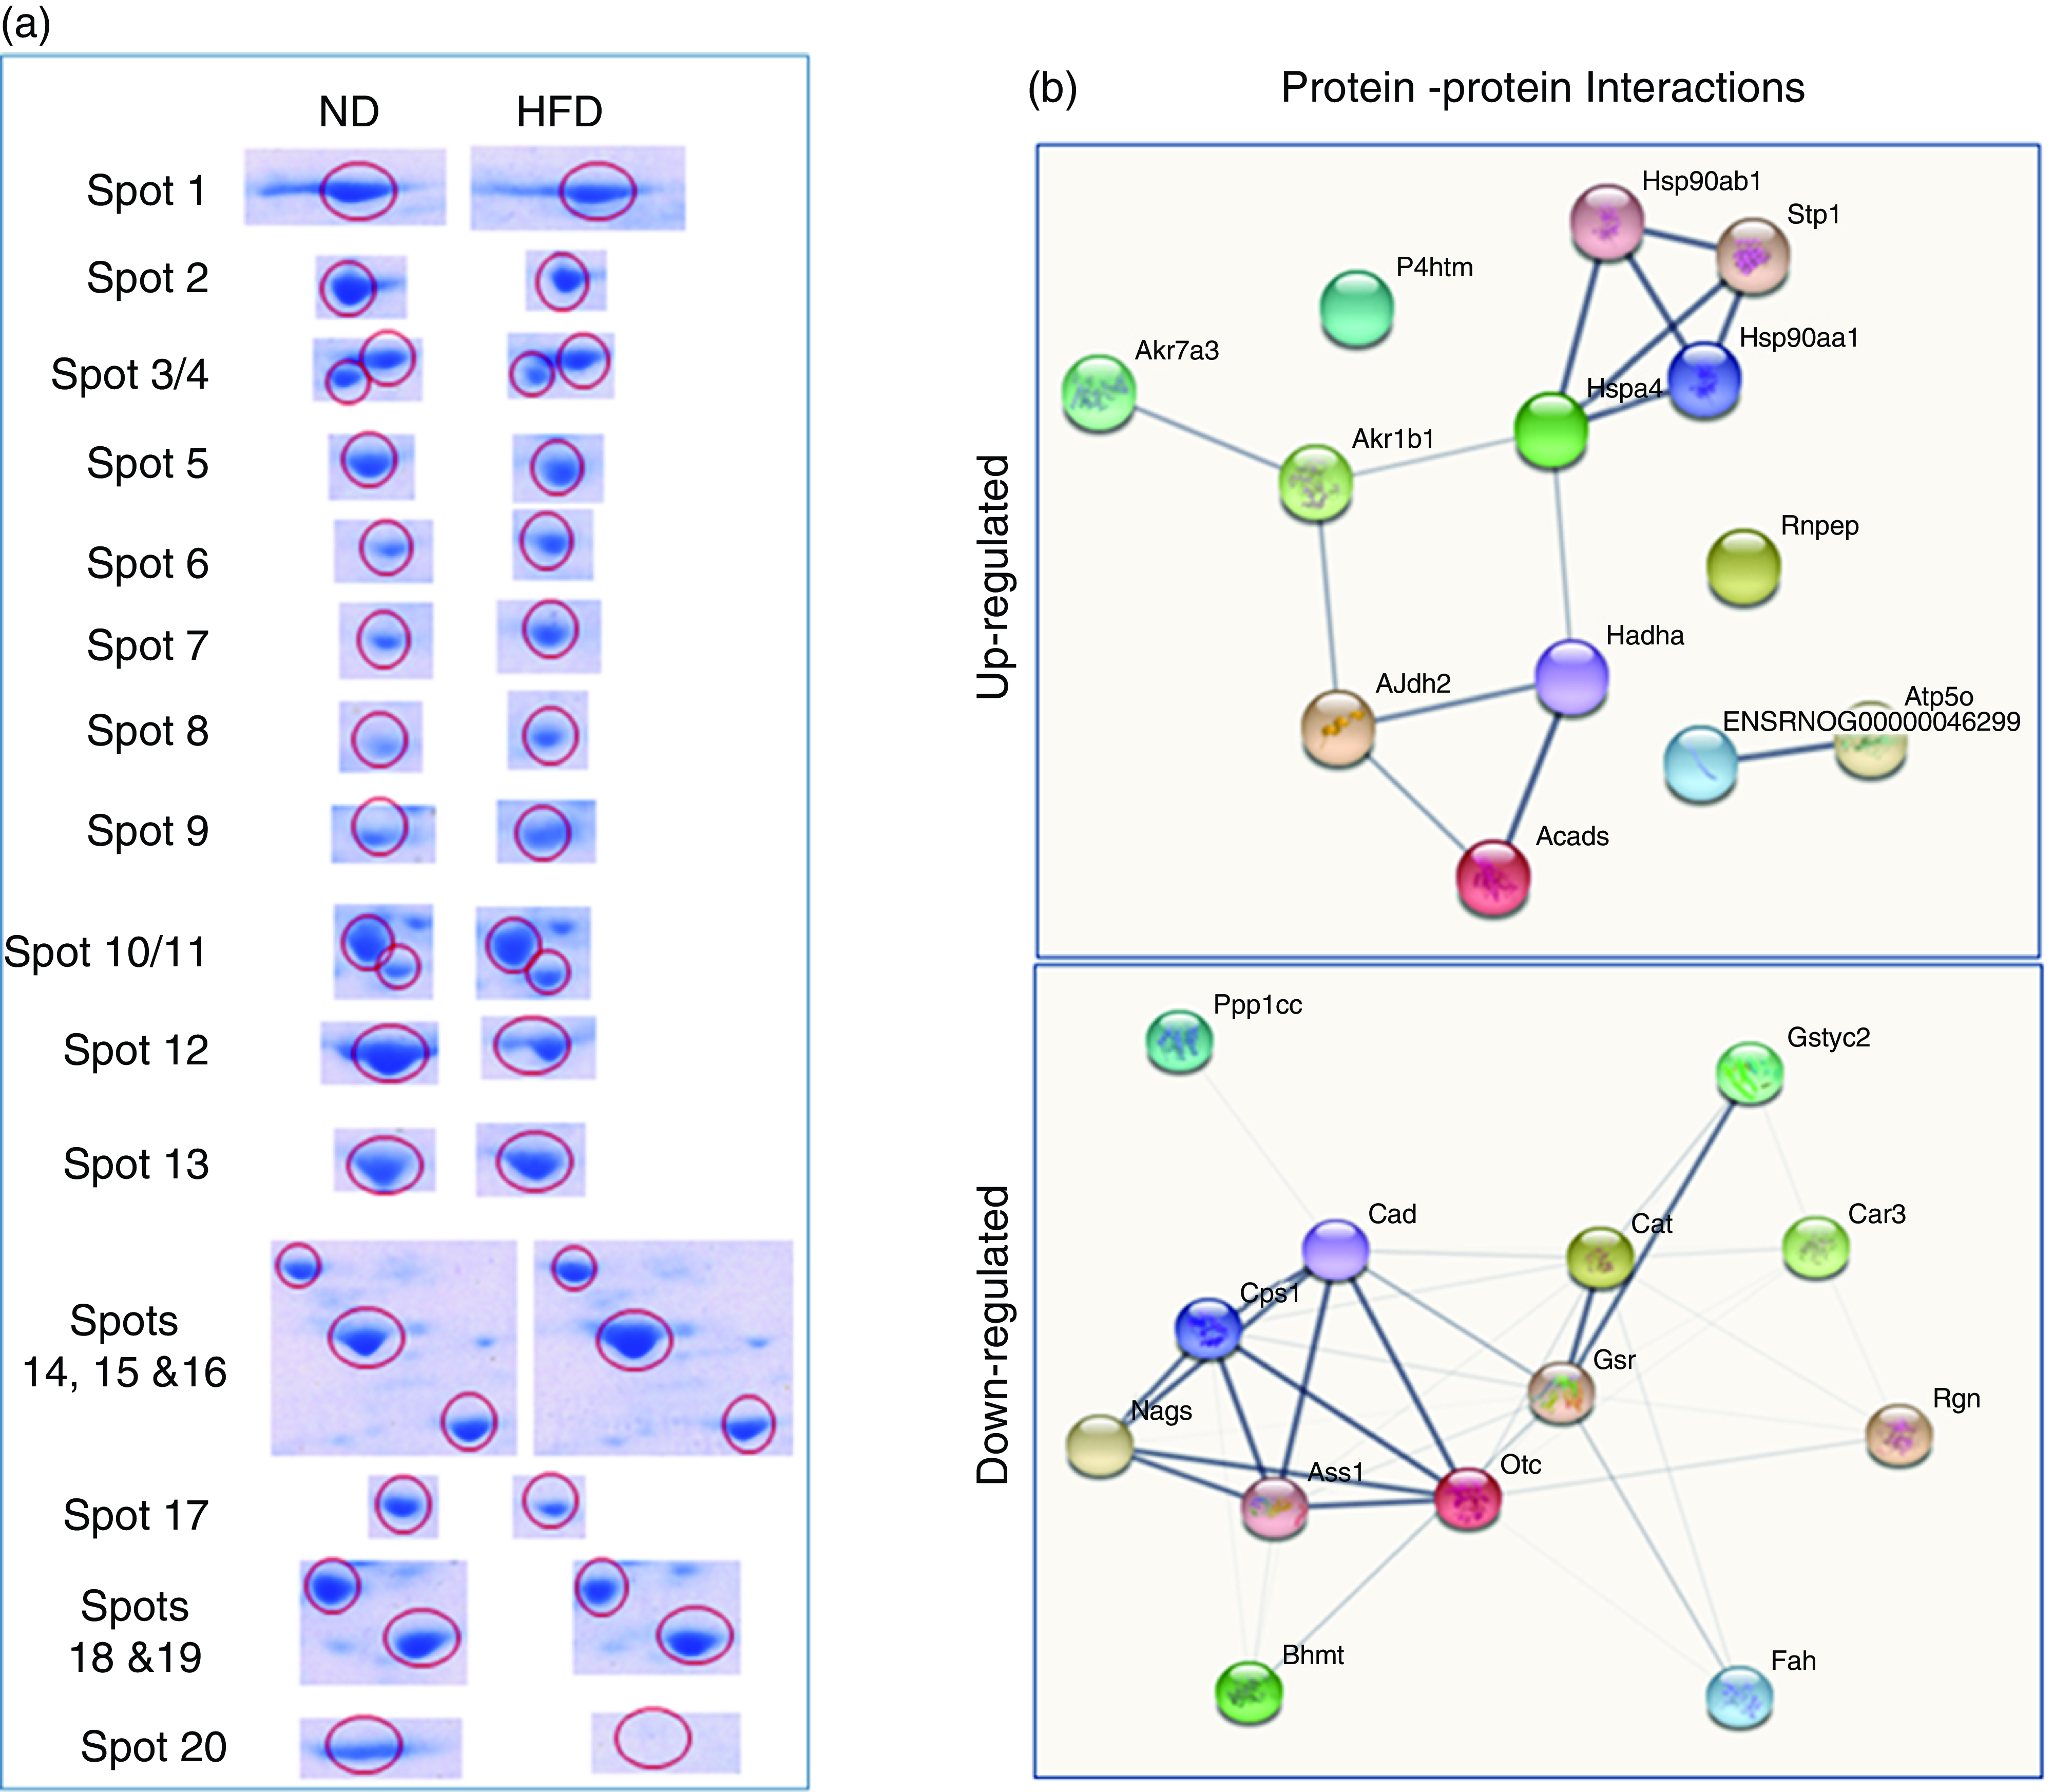
Fig. 3. Differentially expressed proteins are indicated by circles in gels that are listed in tables. (a) Distribution of proteins is up-regulated or down-regulated in response to high-fat groups compared with normal control groups. The blue circle represents proteins that are both statistically different from comparable groups by ≥ 1·5-fold and greater. Abundance ratios of all proteins are calculated by comparing the normalised abundance of each group to the high-fat control group. The value for each protein (group average) in the control is set to 1·0, and values in the HF group are compared with this. (b) Some individual proteins were identified by the UniProt protein (gene) symbol and further analysed (Up-Down) proteins with the protein–protein interaction (PPI) using STRING.
Early hepatic proteins up-regulated and down-regulated in response to high fat
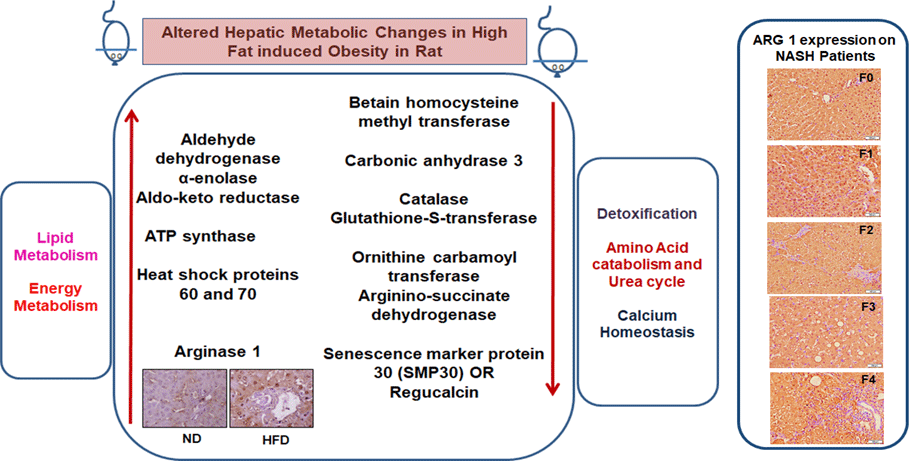
We have listed identified hepatic proteins such as aflatoxin B1 aldehyde reductase (AFB1), aldo-ketoreductase family B1 (AKR1B1), arginase 1 (ARG-1), acetyl co-enzyme A dehydrogenase (ACADL), mitochondrial aldehyde dehydrogenase (ALDH2), enolase I alpha (ENO1), heat-shock protein 70 (Hsp70), prolyl-4-hydroxylase (P4HA3), and ATP synthase (ATP5), which were significantly up-regulated in response to high fat (Table 3). Some identified proteins were down-regulated in response to high fat listed as betain-homocysteine methyl transferase (BHMT), argininosuccinate synthetase (ASS1), fumarylacetoacetate hydrolase (FAA), catalase (CAT), regucalcin (RGN), carbonic anhydrase 3 (CA3), glutathione-S-transferase (Yb1) (GST), GST (Yb2) and ornithine carbamoyltransferase (OCT) (Table 3). Further, we also mapped the differentially expressed proteins (UP\Down) using STRING (search tools for the retrieval of interacting Genes\Proteins database and a web resource that provides functional analysis of PPI and networks). Using STRING, we analysed possible pathways, networks and functional associations between proteins based on experimental and predicted interactions. We visualised the mapped interactions as shown in Fig. 3(b). The resulting network is investigated, and its properties are analysed such as most tightly bound proteins, most abundant signalling pathways and functional protein clusters. We selected individual nodes in the network and used options in the context menu to further explore proteins of interest. GO term annotations were viewed for proteins, protein domain structures and interaction partners. Analysis of biological pathways revealed that these differentially expressed proteins were involved in pathways associated with five different categories, including substrate and lipid metabolism, energy metabolism, detoxification, urea cycle and Ca homoeostasis.
Expression of liver-specific arginase-1
Immunohistochemistry and Western blot analysis
We labelled liver-specific Arg-1 as differentially expressed proteins and verified their differential expression in liver tissue sections of HF and ND rats and NASH patients (online Supplementary Table and Fig. 4). Immunohistochemistry (IHC) and Western blots (WB) as shown in Fig. 4(a) and (b)), in the HFD group, were observed significantly increased Arg-1 expression (estimated fold difference 2·3–5·9, P < 0·001) in hepatocytes. In addition, obesity-related NASH patients with disease progression (F0-F4) were also studied. In the biopsies of these patients, we observed an increased expression pattern of Arg-1, as shown in Fig. 4(c). We observed that Arg-1 expression was increased in NASH patients and associated with severity (P < 0·01). We observed that Arg-1 positivity % of stained cells (area) were more significant at between F0 to F4 (P < 0·001) and F1 to F3 (P < 0·01). There was no significant change between F3 to F4 (P < 0·08). Our results suggest that Arg-1 expression is up-regulated in patients with liver disease and may contribute to the progression of liver fibrosis and liver dysfunction. However, further studies are needed to elucidate the molecular mechanisms underlying the mechanistic role of Arg-1 in liver disease, and it may be a potential therapeutic target for obesity-associated NASH.
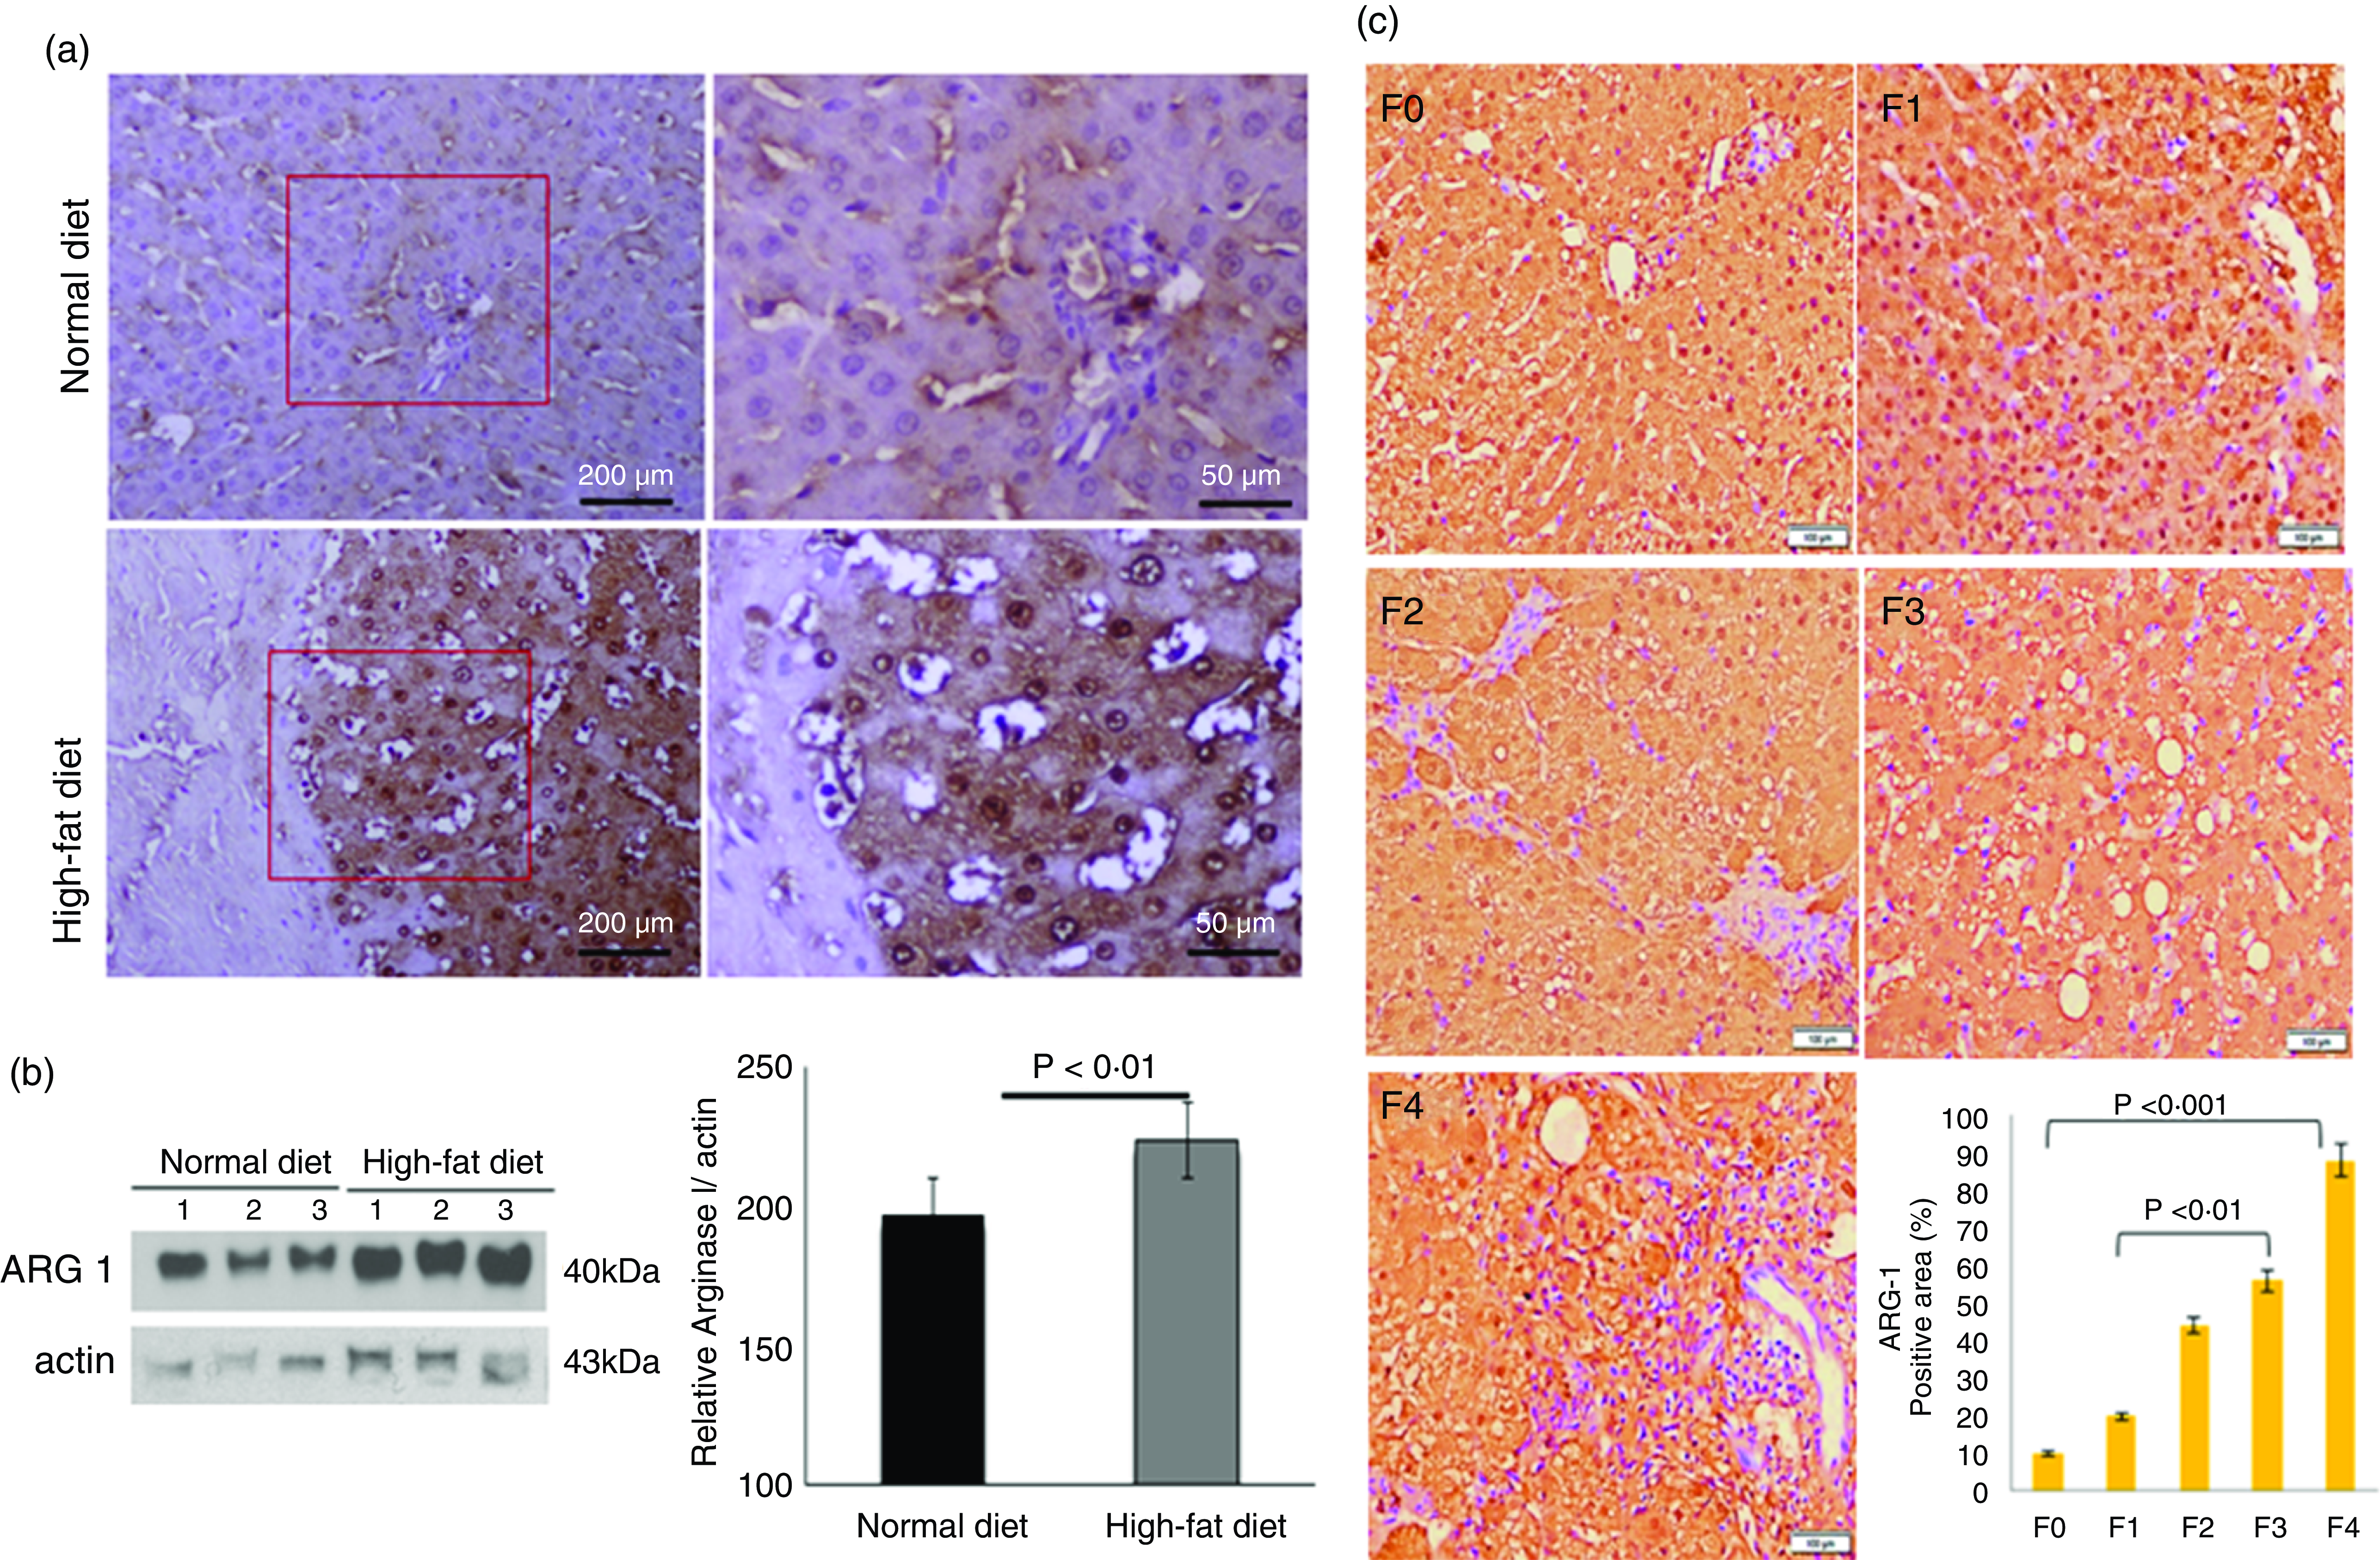
Fig. 4. Arginase-1 (Arg-1) expression profile in liver tissues. (a) Immunohistochemical Arg-1 staining: expression of arginase-1 between comparable groups low and high arginase-1 expression (×200 and ×50) in ND and HFD, respectively. (b) Western blot analysis of total liver extracts (approx: 20ug/well). Arg-1 protein expression was evaluated by immunoblotting with an anti-Arg-1 antibody coupled with HRP. The bar charts show quantitative optical density expression calculated by Image J software. Data are presented as the mean ± SEM (n 3 per group). *P < 0·05 (two-tailed Student’s t test). (C) Association of Arg-1 expression with NASH disease progression F0/4 fibrosis stage. Immunostaining is showing a strong positive Arg-1 (% staining/area). The bar charts show positive Arg-1 expressions calculated by Image J software.
Discussion
Fat-calorie diet is the main cause of weight gain in the liver, which causes changes in hepatocyte metabolism. Obesity is often associated with metabolic diseases such as diabetes, insulin resistance, heart disease and fatty liver disease(Reference Gupta, Chaudhory and Sukriti4). In retrospect, progressive steatosis was considered a painless condition, but substantial evidence suggests that fatty liver has other effects, such as oxidative stress, which can lead to steatohepatitis, fibrosis and cirrhosis(Reference Bournat and Brown27). High-fat-induced obesity in the rodent models is an experimental method often used to study the mechanisms and consequences of obesity in humans. In this model, rats are fed a HFD (40–60 % of their energy content are from fat) for an extended period (usually weeks to months), resulting in gain in body weight and adiposity. Studies using a HFD model have shown that this diet leads to many changes in metabolism, including insulin resistance, dyslipidemia, inflammation and changes in gut microbiota composition(Reference Kübeck, Bonet-Ripoll and Hoffmann28,Reference Stephenson, Kennedy and Hargrove29) . An increase in ALT in plasma is a direct marker of liver injury. We observed that a 40 % HFD does not induce hepatic injury (steatosis) significantly. Thus, ALT levels were not altered or were not significantly changed in our study. Though, we observed an increase in AST level, which is significant and is a marker for change/alteration in hepatic function. In brief, one of the reasons might be that AST is found not only in the liver but also in other organs like the heart, muscles and kidneys. A HFD might influence the accumulation of excessive fat in other organs as well. Therefore, an increase in AST levels can indicate damage or inflammation in the liver as well as in other body organs. Gene expression profiles of animal models of obesity and metabolic diseases have been obtained, but information on the early liver proteome is very limited. A protein-rich approach is needed to show proteins involved in different early metabolic processes. Many genes and signalling pathways involved in lipid metabolism, inflammation and insulin signalling are also affected in these animal models(Reference Alshawsh, Alsalahi and Alshehade30). The diet-induced obesity is used to study the effectiveness of various drugs and diets in the prevention or treatment of obesity, and it includes exercise, medication and nutritional supplements(Reference Huang, Yao and Li31). Quantitative liver proteome analysis is a complete characterisation of protein content and abundance in liver tissue. Proteomics, the large-scale study of all proteins expressed by a cell, tissue or organism can provide important information about changes that occur in the body in response to different stimuli, such as food intake(Reference Luukkonen, Dufour and Lyu32,Reference Fromenty and Roden33) . 2D-DIGE uses up to three fluorescent markers to distinguish the label of protein samples, providing improved sensitivity and reproducibility compared with conventional 2D-PAGE gels, allowing for differentiation of protein expression between experimental groups. Such analyses have gained importance because of the liver’s role in the body’s metabolism and elimination of toxins and its association with many diseases, including fatty liver, cirrhosis and HCC. A HFD causes significant changes in liver protein levels that can be studied using proteomic techniques. We sought to understand early changes in the proteomics domain of obesity-induced in rats. Our proteomic study has identified several proteins that are up- or down-regulated in response to high fat in the liver.
Up-regulation of proteins in response to high-fat in obese rat
In this study, we focused on early hepatic proteome alterations in high-fat fed rats. We have observed and diagnosed that some of unique proteins in the liver are specifically involved in important metabolic procedures inside the liver, together with lipid metabolism, energy metabolism, amino acid metabolism, oxidative stress, urea cycle and Ca homoeostasis. To research the mechanisms at the back of the modifications found in HFD-fed rats, we compared the expression of hepatic proteins of excessive fats and control diet groups. To obtain this, we used quantitative proteomics, DIGE blended with the MALDI-TOF based on differentially expressed liver proteins. Early liver proteomic characterisation demonstrates metabolic changes within the liver of overweight rats recognised aflatoxin B1 aldehyde reductase (AFAR), aldehyde ketone reductase (AKR), Arg-1, acetyl-CoA dehydrogenase (ACADs), mitochondrial aldehyde dehydrogenase (ALDH), ENO1, and Hsp70 and 60 over-expressed in response to high fats. Mitochondrial disorder reasons oxidative pressure and performs a critical function within the improvement of liver disease. Some mitochondrial enzymes are involved in oxidative stress, a situation in which excessive reactive oxygen species production and elimination occurs. We observed that mitochondrial enzymes such as AKR1B10, ALDH and ENO1 additionally have anti-fibrotic and have been suggested over-expressed in liver disease condition(Reference Kuno, Matsuda and Ikehata34). AKR1B10 is an enzyme additionally involved in lipid and steroid metabolism. Other important hit in liver disease pathogenesis is β-oxidation pathway dysfunction, the process via which fatty acids are broken down for energy production, which must additionally be evaluated for additional outcomes(Reference Hooper and Hooper35). HSP are protectors of many forms of strain on cells and are worried in many disorder mechanisms and shield cells from an expansion of environmental stresses, which include oxidative stress. In the excessive-fed rat, HSP expression (60 and 70) was up-regulated, indicating robust oxidative stress(Reference Habich and Sell36,Reference Liu, Gou and Yan37) .
Down-regulation of proteins in the liver of obese rats after high-fat diet
Conversely, BHMT, argininosuccinate synthase (ASS), fumarace (Fumarylase), REG, CA3, GST (Yb1), GST (Yb2), and OCT in the liver enzyme observed a down-regulation pattern in response to high-fat content in the liver. Levels of β-oxidase enzymes such as acetyl-CoA carboxylase (ACC) and carnitine palmitoyltransferase 1A (CPT1A) are down-regulated, resulting in poor fatty acid metabolism and slow excretion of fat by the liver(Reference Younossi, Baranova and Ziegler38). Hepatic GST, a well-documented and studied enzyme in liver disease and found to be an abnormal protein, is a family of detoxifying enzymes that catalyse the binding of glutathione to a variety of endogenous and exogenous compounds. GST is concentrated in hepatocytes and is known as an early marker that is activated in response to any changes in the liver. Younosi ZM. et al. reported that differences were observed in gene expression of GST and ornithine transaminase (OAT), and the gene encodes the stages of NASH(Reference Younossi, Gorreta and Ong39). The expression and activity of GST during metabolic changes have been documented that the increases and decreases in expression indicate that it acts as an insulin sensitiser and antioxidant in the liver(Reference Ahn, Jun and Na40). Our finding is that the mu-like GST subunit Yb2, or mu2, the main GST subunit in the liver, is absent or down-regulated in response to high-fat-fed rats, suggesting a role potential role in regulating antioxidant activity in the liver. Other studies have shown that altered methionine/folate metabolism leads to the development of hepatic steatosis, inflammation and liver damage in alcoholics(Reference Pellanda41,Reference Kharbanda, Mailliard and Baldwin42) . Mechanistically, BHMT is protective in decreasing Hcy levels by increasing SAM and/or decreasing SAH(Reference De Chiara, Heebøll and Marrone43). These metabolic pathways may be therapeutic targets in alcoholic and obesity-associated steatohepatitis. In our rat model, the urea cycle has also changed, and two important enzymes, arginine succinate synthase and OCT, are found primarily in the liver that control the urea cycle. Arginine succinate synthase catalyses the third step of the urea cycle by converting citrulline and aspartate to argininosuccinate while breaking down ATP into AMP and PPI. It activates AMP-activated protein kinase, and increases in hepatic fat oxidation are reduced in fat-rich rats, indicating changes in the urea cycle(Reference Piao, Choi and Kwon44).
CAT is an important antioxidant enzyme that can greatly reduce oxidative stress by destroying free cellular oxides, and its down-regulation causes hepatic oxidative stress(Reference Piao, Choi and Kwon44). We also evaluated changes in Ca signalling and reported that the regulation and expression of calpains, which are key regulators of the Ca2+ signalling system that plays many roles in the liver, are associated with liver inflammation(Reference Park, Ishigami and Shima45). Reguccalcin is also an important molecule in the problem of lipid metabolism, and a significant decrease in expression has been shown to have a pathophysiological role in the development of NASH in animals and humans(Reference Yamaguchi and Murata46). It is linked to obesity and diabetes and may be an important therapeutic target in these conditions.
Liver-specific arginase-1 as a diagnostic marker
Arg-1 is a binuclear metalloenzyme (manganese) that catalyses the hydrolysis of enzymes involved in the urea cycle. We found up-regulation of Arg-1 in the livers of obese rats and obesity-related NASH patients with varying degrees of fibrosis and steatosis. Arg-1 in the liver detoxifies ammonia and plays an important role in urea cycle regulation(Reference De Chiara, Heebøll and Marrone47,Reference Gallego-Durán, Ampuero and Pastor-Ramírez48) , by catalysing the conversion of arginine to ornithine, which is an important step for normal physiological function. In consideration that liver macrophages, also known as Kupffer cells, play a crucial role in maintaining liver homoeostasis and regulating immune responses within the liver(Reference Oates, McKell and Moreno-Fernandez49,Reference McKnight, Nassar and Cohen50) . Arg-1 is an enzyme that is prominently expressed by liver macrophages. It is involved in the conversion of the amino acid arginine into ornithine and urea. The role of liver macrophages and Arg-1 can vary depending on the specific disease and stage of the disease(Reference Maras, Das and Sharma51,Reference Maras, Das and Bhat52) . We have previously reported an increase in the accumulation of M2 macrophages in the liver post-inflammatory response, and Arg-1 is a marker for M2 macrophages(Reference Hu, Leak and Shi53,Reference Fujiwara, Kwok and Yano54) . This suggests that an increase in the M2 macrophage and Arg-1 expression is concordant and is a signature of body response to counter the inflammatory condition via tissue repair and suppression of inflammation. Early Arg-1 expression is a signature associated with stress particularly due to fats (in our study). Therefore, early Arg-1 expression could be used as a diagnostic marker which correlates with the progression and development of steatohepatitis. Unfortunately, the usefulness of Arg-1 as a diagnostic biomarker is problematic because many factors can affect Arg-1, including diabetes, liver disease, and a high-protein diet. Recent studies have shown that Arg-1 is a higher predictor of liver differentiation in low-dose aspiration biopsy (FNAB) than other markers such as HepPar-1 or glypican 3(Reference Hu, Leak and Shi53,Reference Fujiwara, Kwok and Yano54) . Our observations and data suggest that Arg-1 may be a useful tool in the evaluation of liver fibrosis/steatosis in obesity-associated NASH. Our results provide an early proteomic marker, Arg-1, associated with HFD in rats and fibrosis in obese NASH patients.
In summary, one of the conclusions of our study is that HFD feeding increases body weight, body fat percentage and other indicators of obesity, such as belly fat. Liver proteomics in HFD-induced obese rats can reveal metabolic disorders, including lipid metabolism, urea cycle, oxidative stress, and energy homoeostasis. These models provide insight into the mechanisms underlying obesity-induced obesity in rats and demonstrate the potential of proteome analysis as a diagnostic tool and identify new therapeutic targets to prevent disease. It should be noted, however, that this study only investigated changes in the liver proteome due to a HFD and did not explore other underlying factors that may contribute to the development of NAFLD. More research is needed to explore the interaction of various factors (including gut microbiota, genetics and lifestyle) in the pathogenesis of NAFLD. Arg-1 measurement may help to provide insight into liver damage and disease progression and can be used as a diagnostic marker to assess disease severity in patients with fatty liver disease-associated metabolic syndrome.
Acknowledgements
The authors are grateful to Dr Anandwardhan A Hardikar (NCCS) for providing liver samples for this study providing the high-fat diet induced obese rats. Dr S. K. Sarin and Dr P. Sakhuja (Department of Hepatology and Pathology, G.B. Pant Hospital, Delhi) assisted in histological analysis and provided NAFLD patient samples for further validation. The authors also would like to thank ILBS’ Biobanking Facility and Dr Y. Singh and Richa Mishra for providing the Proteomics Resource Facility for data collection with the help of the Centre for Genomic Applications (TCGA) Collaborative Project Team.
This research was funded by Molecular and Cellular Medicine (MCM), ILBS, Institutional Research Fund. We are also grateful to the Indian Medical Research Council (ICMR) for the support of this research project.
A. C. G. designed the study and performed all experimental writing. A. B. was subjected to Western blotting (WB) and IHC. J. S. M. assisted with MS and studied the manuscript. All authors approved the final draft.
The authors declare no conflict of interest.
All authors acknowledge that data supporting these findings are available to the reader.
Supplementary material
For supplementary material/s referred to in this article, please visit https://doi.org/10.1017/S0007114523002453


