


Obesity is a risk factor for the development of insulin resistance, type 2 diabetes mellitus, the metabolic syndrome and CVD( Reference Samartin and Chandra 1 ). In obese individuals, excess white adipose tissue promotes the production of the pro-inflammatory cytokines IL-1β, IL-6 and TNF-α, which increase the concentrations of circulating C-reactive protein, serum amyloid A and other acute-phase proteins( Reference Hotamisligil, Arner and Caro 2 – Reference Rosenson and Koenig 8 ). The pro-inflammatory cytokines have a negative effect on insulin sensitivity, predisposing obese individuals to the development of type 2 diabetes. Increased circulation of pro-inflammatory cytokines and acute-phase proteins has been reported to be associated with the up-regulation of the endothelial adhesion molecules soluble intercellular adhesion molecule-1 and soluble vascular adhesion molecule-1 and the chemoattractants IL-8 and monocyte chemoattractant protein-1, which recruit immune cells into the arterial wall and promote the development of CVD( Reference Straczkowski, Lewczuk and Dzienis-Straczkowska 9 – Reference Kim, Park and Kawada 11 ). Leptin, another protein produced by the adipose tissue, has been reported to increase in concentration in obesity and enhance the inflammation associated with the development of atherosclerotic plaques. Increased leptin content in the plasma has been reported to be associated with the development of insulin resistance, type 2 diabetes and hypertension( Reference Otero, Lago and Lago 12 , Reference Lago, Gómez and Lago 13 ).
Obesity has been reported to impair immune cell function and to be associated with increased susceptibility to bacterial and viral infections( Reference Kanneganti and Dixit 14 , Reference Milner and Beck 15 ). Both the innate and adaptive immune systems are affected in the obese state. Compared with normal-weight individuals, higher rates of morbidity and mortality have been reported in obese individuals during the 2009 H1N1 influenza virus pandemic( Reference Van Kerkhove, Vandemaele and Shinde 16 ). Higher rates of nosocomial and post-surgical infections have been reported in obese individuals compared with the normal-weight population( Reference Falagas and Kompoti 17 ). Obesity increases the risk of systemic, urinary and respiratory infections in hospitalised patients and the risk of infection after cardiac and vascular, orthopaedic, and gastric surgeries( Reference Falagas and Kompoti 17 , Reference Cantürk, Cantürk and Çetinarslan 18 – Reference Davenport, Xenos and Hosokawa 20 ).
We have recently reported that dietary strawberries induce beneficial changes in blood lipid profiles and sensitise ex vivo-derived monocytes in response to an immunological stimulant( Reference Zunino, Parelman and Freytag 21 , Reference Zunino, Storms and Freytag 22 ). In the present study, we expanded our analyses to another fruit to further define the potential benefits of consuming different fruits in the obese population. The goal of the present study was to determine whether prolonged consumption of grapes (in the form of grape powder) altered blood lipid profiles, decreased the concentrations of blood inflammatory markers and altered the functions of different populations of immune cells in obese subjects. Grapes contain a number of polyphenols, including anthocyanins, flavonols and stilbenes, which have been reported to attenuate CVD and improve glucose and lipid homeostasis in human and animal models (reviewed in Chuang & McIntosh( Reference Chuang and McIntosh 23 )). The specific hypothesis was that dietary grapes would beneficially alter the levels of blood lipid fractions, decrease the concentrations of inflammatory markers in the plasma and modify the pro-inflammatory functions of immune cells in obese humans. The primary endpoints of the present study were inflammation and immune cell function and the secondary endpoints were lipids and other metabolic parameters.
Materials and methods
Study design
The present study was conducted according to the guidelines laid down in the Declaration of Helsinki, and all procedures involving human subjects were approved by the Institutional Review Board at the University of California Davis, CA. Written informed consent was obtained from all subjects who participated in the study. Healthy obese male and female volunteers who were 20–60 years old with a BMI of 30–45 kg/m2 were recruited using advertisements, flyers and press releases. Initial screening was performed by telephone questionnaire to assess lifestyle, health history, physical activity levels and general dietary habits. Physical screening of potential subjects was carried out at the Western Human Nutrition Research Center and included measurements of blood pressure, heart rate, body temperature, height and weight, complete blood count and differential leucocyte counts. Blood samples were collected at screening for the evaluation of blood chemistry and lipids by the Pathology Laboratory at the University of California Davis Medical Center (UCDMC). Blood samples that were sent to the UCDMC Pathology Laboratory were coded and de-identified. Volunteers were included in the present study if they were 20–60 years of age, had a BMI in the range of 30–45 kg/m2, had blood pressure, blood cell counts and blood chemistry profiles within the normal range, could commit to the dietary intervention and scheduled testing, and were able to pick up packages of the grape and placebo powders once a week. Volunteers were excluded if they smoked or used tobacco products, routinely drank more than one alcoholic beverage per d, were vegetarians, were taking cholesterol-lowering or blood pressure medications, steroids for asthma or other inflammatory states, thyroid-regulating drugs, or over-the-counter weight-loss products, or had fasting blood cholesterol concentrations >300 mg/dl (7·77 mmol/l or 3000 mg/l) or TAG concentrations >400 mg/dl (4·52 mmol/l or 4000 mg/l). Pregnant and lactating women were also excluded from the present study.
The present study was a 9-week randomised, double-blind, cross-over design study using grape and placebo powders as the interventions. Both the freeze-dried grape powder and the placebo powder were prepared and packaged in vacuum-sealed packets obtained from the California Table Grape Commission by the National Food Laboratory, Inc. using good manufacturing practices. Details regarding the nutrient composition of the powders were obtained from the California Table Grape Commission, and the composition is summarised in Table 1. The freeze-dried grape powder was a composite of commercially grown, fresh, whole red, green and blue-black California grapes (Vitis vinifera, seeded and seedless varieties) that represented the majority of grapes available to consumers. Silicon dioxide was added as an anti-caking agent. The placebo powder was formulated to closely match the freeze-dried grape powder in terms of dietary fibre content, sugar profile, organic acid profile, and sensory characteristics of sweetness, tartness, mouth-feel and viscosity. The placebo powder contained fructose, glucose (the two main sugars in the grape powder), organic acids including tartaric, malic and citric acids, and fibre. Fibre was added to the placebo powder using a blend of powdered cellulose, sugarbeet fibre and cellulose gel. Artificial colours (FD&C dyes) were used to duplicate the natural colour components and avoid the addition of polyphenolic compounds from natural colourants. The flavourings used were free of polyphenolic compounds and antioxidants. The placebo powder also contained modified food starch and tapioca maltodextrin, two potassium salts and silicon dioxide (at concentrations the same as those in the grape powder). Both the grape and placebo powders were coded so that the subjects and investigators were blinded to the packet contents. Each packet of grape powder contained the equivalent of approximately two servings of fresh grapes (46 g grape powder). The placebo control packets contained 46 g of powder. The subjects were instructed to add the powder to 240 ml of water and consume the resulting beverage two times per d during the 3-week intervention periods, one with breakfast and one with dinner (equal to four servings of grapes/d).
Table 1 Nutrient composition of the grape and placebo powders*
ND, not determined.
* Provided by the California Table Grape Commission.
The subjects were advised to maintain their normal dietary habits and physical activity during the study period with the following exceptions. The subjects were instructed to maintain a diet low in fruits and vegetables (four to five servings/d), limit the consumption of tea, wine and chocolate to one serving/d or less, discontinue the use of dietary supplements, and limit the intake of alcohol to three alcoholic beverages per week. Blood samples were collected at the beginning and end of the 1st week to obtain baseline information, and after the 1st week, the subjects were randomised into two groups. Group 1 was given grape powder packets and group 2 placebo powder packets for a 3-week intervention period. A washout period of 2 weeks was included to eliminate the effect of treatment. The subjects then crossed over to the opposite intervention for a further 3-week intervention period. Blood samples were collected after a 12 h fasting period at the end of weeks 3, 4, 8 and 9 of the study period. For each blood draw, a complete blood count with the differential leucocyte counts and a comprehensive chemistry panel were performed. Body weight, blood pressure, heart rate and body temperature were measured for each subject at the time of the blood draws. The measurements described below were performed at 2 and 3 weeks during the 3-week-long intervention periods to provide a time course for potentially beneficial effects of the grapes compared with placebo powder.
Chemistry and lipid panels
Blood samples were collected in Vacutainer tubes (Becton Dickinson) and allowed to clot for 30 min at room temperature for serum separation. The tubes were centrifuged for 10 min at 1300 g . The serum samples were sent to the UCDMC Pathology Laboratory by courier on the day of each blood draw. The Pathology Laboratory measured blood lipid concentrations and performed chemistry panels that included measurements of total cholesterol, LDL (calculated), HDL, TAG, serum glucose, insulin, blood urea N, creatinine, Ca, Na, K, Cl, CO2, total protein, albumin, alkaline phosphatase, aspartate aminotransferase, alanine aminotransferase and bilirubin concentrations.
Measurements of plasma zinc concentrations
Syringes containing Zn-free lithium heparin (S-Monovette for trace metal analysis; Sarstedt) were used to collect blood samples for measuring plasma Zn concentrations. The blood samples were centrifuged at 1300 g and 4°C for 10 min, and the resulting plasma was stored at − 80°C before analysis. Plasma Zn concentrations were measured by inductively coupled plasma atomic emission spectrometry (ICP-AES) using a Vista AX CCD simultaneous ICP-AES analyser with an SPS5 autosampler (Varian, Inc.). The plasma was diluted in 1 m-HNO3 (Fisher Scientific) and centrifuged at 2200 g and 4°C for 15 min, and the supernatants were recovered for ICP-AES analysis. A serum reference with a known Zn value (Seronorm Trace Elements Serum LI; Accurate Chemical & Scientific Corporation) and an internal quality control plasma sample (Utak Laboratories, Inc.) were used for quality control. The ICP-AES Zn reference control included a bovine liver standard that was a certified reference material (?SRM 1577b; National Institute of Standards and Technology). The blanks, standards and samples were run in duplicate.
Lipid particle analysis
LipoScience, Inc. performed the subfractionation of lipid particles and analysis of lipid particle size in plasma samples using NMR( Reference Jeyarajah, Cromwell and Otvos 24 ). Plasma samples were prepared from blood samples collected into EDTA-Vacutainer tubes (Becton Dickinson) and centrifuged at 4°C for 10 min at 1300 g . The plasma samples were kept frozen at a temperature of − 80°C and shipped to LipoScience on dry ice.
Measurement of serum and plasma inflammatory marker concentrations
The serum concentrations of C-reactive protein, serum amyloid A, soluble intercellular adhesion molecule-1 and soluble vascular adhesion molecule-1 were measured using the Vascular Injury Panel II Kit and imaging instrument (Sector Imager 2400; Meso Scale Discovery). The plasma concentrations of IL-1β, IL-6, IL-8, TNF-α, leptin and insulin were measured using Milliplex detection kits (Millipore Corporation) and a Bioplex multiplex instrument (Bio-Rad). The samples were run in duplicate.
Analysis of T-cell and monocyte population activation
Peripheral blood mononuclear cells (PBMC) were prepared from blood samples collected into cell preparation tubes (Becton Dickinson) according to the manufacturer's protocol. T-lymphocyte populations were activated by pre-coating ninety-six-well plates at 4°C overnight with 50 μl each of CD3 (clone OKT3) and CD28 antibodies (eBioscience) per well. The concentration of each antibody was 3 mg/l. Each plate also comprised wells that were pre-coated with isotype control antibodies (eBioscience) of similar volume and concentration to serve as negative controls. Wells in the pre-coated plates were washed three times with PBS (Sigma Chemical Company) before the addition of 200 μl PBMC per well (2 × 10⁵ cells). PBMC were cultured at 37°C in 5 % CO2 in Roswell Park Memorial Institute medium containing 10 % autologous serum, 1 mmol sodium pyruvate/l, 2 mmol l-glutamine/l, 60 mg penicillin/l, 100 mg streptomycin/l (Invitrogen) and 50 μmol β-mercaptoethanol/l (Sigma Chemical Company). The cells and supernatants were removed after 24, 48 and 72 h for the analysis of T-cell proliferation and cytokine production, respectively, as described below. Monocyte populations in the PBMC samples (200 μl per well) were stimulated in separate ninety-six-well plates with 10 μg/l of ultra-pure lipopolysaccharide (LPS; List Biological Laboratories, Inc.) per well or an equal volume of sterile endotoxin-free water as a negative control. PBMC were incubated at 37°C in 5 % CO2 and the supernatants were removed after 24, 48 and 72 h for the analysis of monocyte-derived cytokines as described below.
Analysis of T-lymphocyte subset proliferation
PBMC were pre-labelled using the PKH67 Green Fluorescent Cell Linker Kit (Sigma) according to the manufacturer's recommended protocol. PKH-labelled PBMC were activated with CD3/CD28 antibodies or incubated with isotype control antibodies as a negative control for proliferation as described above. Aliquots of cells were collected at 24, 48 and 72 h and stained with phycoerythrin-conjugated anti-CD4 antibodies and allophycocyanin-conjugated anti-CD8 antibodies (Becton Dickinson) for 30 min on ice. The cells were washed and fixed in 1 % paraformaldehyde/PBS before analysis by flow cytometry. As flow cytometry controls, aliquots of cells were stained with phycoerythrin- and allophycocyanin-conjugated isotype antibodies (Becton Dickinson). The cells were analysed in duplicate. PBMC were collected on a FACSCanto flow cytometer and analysed using FACSDiva software (Becton Dickinson). The proliferation of CD4+ and CD8+ T-lymphocytes was modelled using the Proliferation Wizard feature of ModFit LT version 3.1 (Verity Software House). The negative control wells (non-proliferating cells) were used to detect the parent peak for calculating the number of cells in each generation. For each sample, 30 000 events were collected after using appropriate gates to exclude cellular debris and aggregated cells.
Measurement of cytokine production
The production of cytokines by stimulated T-lymphocyte and monocyte populations was measured by plating PBMC in separate ninety-six-well plates and stimulating with CD3/CD28 antibodies and LPS, respectively, as described above. The supernatants were collected at 24, 48 and 72 h and stored at − 70°C. The concentrations of interferon-γ, TNF-α, IL-4 and IL-10 were measured in supernatants from CD3/CD28-activated PBMC. The concentrations of TNF-α, IL-1β, IL-6 and IL-8 were measured in supernatants from LPS-activated PBMC. Cytokine production was quantified using Milliplex magnetic bead cytokine detection kits (Millipore Corporation) and a Bioplex multiplex instrument (Bio-Rad). All the samples were measured in duplicate.
Measurement of serum antioxidant status
Serum samples were prepared as described above and antioxidant status was measured using the ELISA kit for oxidised LDL (Mercodia AB) and the oxygen radical absorbance capacity (ORAC) assay. The concentrations of oxidised LDL were measured in duplicate according to the manufacturer's protocol using a BioTek Synergy 2 plate reader. For the ORAC assay, the radical generator 2,2′-azobis(2-methylpropionamidine) dihydrochloride and Trolox (6-hydroxy-2,5,7,8-tetramethylchroman-2-carboxylic acid) were purchased from Sigma, and the fluorescein sodium salt was obtained from Acros Organics. The ORAC assay was performed in triplicate as described by Prior et al. ( Reference Prior, Hoang and Gu 25 ). The loss of fluorescence signal in the presence of serum samples was monitored on a SpectraMax Gemini-XS spectrofluorometer using Softmax Pro version 4.0 software (Molecular Devices) for 3 h at 37°C. Trolox equivalents were calculated by comparing the AUC (fluorescence intensity v. time) of Trolox standards with that of the serum samples.
Evaluation of the bioavailability of grape polyphenols and metabolites
Catechin, epicatechin, quercetin, resveratrol, phenolphthalein β-d-glucuronide and β-glucuronidase type X-A from Escherichia coli were purchased from Sigma Aldrich. Citric acid monohydrate, ammonium acetate (enzyme grade), l-ascorbic acid (ACS grade), and acetonitrile, ethyl acetate and methanol (HPLC grade) were obtained from Fisher Scientific.
The digestion and extraction of glucuronidated and free metabolites of catechin, epicatechin, quercetin and resveratrol in the plasma samples were conducted following previously published methods( Reference Erlund, Alfthan and Siren 26 , Reference Lee, Prabhu and Meng 27 ) with some minor modifications. During the method development stage, some samples were spiked with phenolphthalein β-d-glucuronide to verify enzyme activity. A replicate aliquot of each sample was spiked before digestion to a final concentration of 10 ng/ml of catechin, epicatechin, resveratrol and quercetin for determining the extraction efficiency. The quantification of metabolites in the resulting extracts was accomplished using high-pressure liquid chromatography with electrochemical detection. Chromatographic separation was based on the method of Avena-Bustillos et al. ( Reference Avena-Bustillos, Du and Woods 28 ) using a 150 × 4·60 mm, 2·6 μm Phenomenex Kinetex C18 100A column on a Waters HPLC 2695 separation module (Waters Corporation). For the mobile phase, a binary gradient made up of (A) 10 % acetonitrile in water and (B) 50 % acetonitrile in water, both containing 25 mmol ammonium acetate/l and 25 mmol citric acid/l, was used at a flow rate of 0·9 ml/min. Due to the metabolites to be quantified, the gradient programme was modified as follows: a 3·5 min isocratic elution step with 0 % B, followed by 4·5 min linear gradient from 0 to 30 % B, 17 min linear gradient to 50 % B, and 3 min isocratic elution wash with 80 % B. At the end of the programme, the composition of the mobile phase was brought to the initial condition of 0 % B and the column was equilibrated for 11 min before the next injection. Electrochemical analysis of the HPLC effluent was carried out using an ESA CoulArray 5600A electrochemical detector (ESA, Inc.). Analyte signals were optimised by administering 100–620 mV across eight channels (100, 200, 320, 380, 440, 500, 560 and 620 mV). Data analysis was carried out using CoulArray for Windows version 2.00 (ESA, Inc.). All analyte signals were measured by peak area. The concentration of each analyte was determined from the linear regressions of standard curves.
Statistical analyses
Statistical analyses were carried out using Statistical Analysis Systems for Windows Release 9.2 (SAS Institute). Differences between the two intervention groups were evaluated separately for each week using a mixed-model analysis (SAS MIXED procedure). The model included the main effects of diet and period, a diet × period interaction, the mean of the two baseline blood draws as a covariate, and a random effect of subject (allowing heterogeneous variance). The MEANS procedure was used to estimate means and standard deviations. Variables were transformed using Box–Cox power transformations, if needed to conform to a normal distribution. All the data are presented as means and standard deviations to indicate variability in individual values, with significance being set at P< 0·05. Power calculations for the present study were based on the results of a similar study with dietary strawberries, using data for the differences in monocyte-derived TNF-α concentrations as the endpoint( Reference Zunino, Parelman and Freytag 21 , Reference Zunino, Storms and Freytag 22 ). The number of subjects was estimated according to power calculations using a power of 0·8 and an expectation of a 10 % difference in cytokine concentrations between the grape and placebo powder groups. A retrospective analysis of the detectable differences was carried out for all the parameters measured in the present study.
Results
Recruitment and study participation
A flow chart depicting the recruitment, screening and participation of the study subjects is shown in Fig. 1. Of the thirty-three subjects included in the study, nine dropped out or were disqualified for the following reasons: wanted to lose weight (two subjects); did not want to limit fruit and vegetable intake (one subject); non-compliance with the protocol (two subjects); illness (one subject); elevated liver enzyme levels (one subject); no reason given (one subject); low Fe status (one subject). The mean age, weight and BMI of the female and male subjects at the time of screening and at the completion of the study are given in Table 2. No differences in the mean weight or BMI of the male or female subjects were observed between the time of screening and the completion of the study.
Fig. 1 Flow chart depicting the recruitment, screening and participation of the study subjects.
Table 2 Age, weight and BMI of the subjects at screening and at study completion (Mean values and standard deviations)
Vitals and chemistry and lipid panel measurements
No differences were observed in heart rate or body temperature between the two intervention groups. A small reduction in systolic blood pressure was observed in the grape powder group (117·5 (sd 11·7) mmHg) compared with the placebo powder group (122·6 (sd 11·9) mmHg) (P= 0·049) after 2 weeks of intervention. However, this change was not observed at week 3 of the interventions. An increase in serum Na concentrations was observed at 3 weeks in the grape powder group (139·3 (sd 1·5) mEq/l) compared with the placebo powder group (138·3 (sd 1·7) mEq/l) (P= 0·011). No other changes in vitals, chemistry profiles, and cholesterol, LDL, HDL or TAG concentrations were observed. No change in plasma Zn concentrations, which were measured separately, was observed. From Table 3, it can be seen that there were no changes in the concentrations of liver enzymes, glucose and insulin and the values of homeostatic model assessment between the placebo and grape powder groups.
Table 3 Chemistry panel measurements* (Unadjusted mean values and standard deviations; n 24)
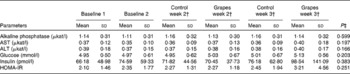
AST, aspartate aminotransferase; ALT, alanine aminotransferase; HOMA-IR, homeostatic model assessment of insulin resistance.
* Baseline data (blood draws 1 and 2) were used as covariates.
† Week 2 data represent data collected at 2 weeks of intervention (blood draws 3 and 5) and week 3 data represent those collected at 3 weeks of intervention (blood draws 4 and 6) with the control diet (control) containing the placebo powder or the diet containing the grape powder (grapes).
‡ P value for differences between the two intervention groups at week 3. No differences were observed for week 2 or week 3.
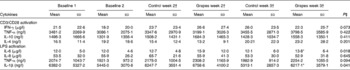
Lipid particle profiles
An analysis of lipid particles was carried out for each blood draw by NMR (Table 4). There was a diet effect for large LDL and large LDL-cholesterol particles. The grape powder reduced the concentrations of large LDL and large LDL-cholesterol particles in the serum after 3 weeks of intervention compared with the placebo powder (P< 0·05). A reduction in VLDL size was observed in the grape powder group (52·9 (sd 7·6) nm) compared with the placebo powder group (56·9 (sd 10·9) nm) after 2 weeks of intervention (P= 0·041). However, no difference in VLDL size was observed at week 3 of the interventions.
Table 4 Lipid particle concentrations and sizes determined by NMR† (Unadjusted mean values and standard deviations; n 24)
IDL, intermediate-density lipoprotein.
* Mean value was significantly different from that of the control group at week 3 (P< 0·05).
† Baseline data (blood draws 1 and 2) were used as covariates.
‡ Week 2 data represent data collected at 2 weeks of intervention (blood draws 3 and 5) and week 3 data represent those collected at 3 weeks of intervention (blood draws 4 and 6) with the control diet (control) containing the placebo powder or the diet containing the grape powder (grapes).
§ P value for differences between the two intervention groups at week 3. No differences were observed for week 2, except for VLDL particle size (P= 0·041).
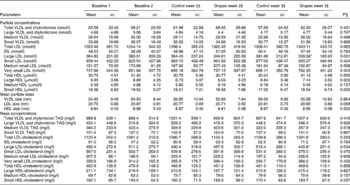
Inflammatory marker concentrations and antioxidant status
The measurement values of plasma or serum inflammatory markers are given in Table 5. There were no differences in inflammatory marker concentrations between the two intervention groups. There were no differences in antioxidant status between the two intervention groups, as measured by the ORAC or oxidised LDL assay.
Table 5 Inflammatory marker concentrations and antioxidant status in the serum and plasma* (Unadjusted mean values and standard deviations; n 24)

sICAM, soluble intercellular adhesion molecule; sVCAM, soluble vascular adhesion molecule; CRP, C-reactive protein; SAA, serum amyloid A; ORAC, oxygen radical absorbance capacity; TE, Trolox equivalents.
* Baseline data (blood draws 1 and 2) were used as covariates.
† Week 2 data represent data collected at 2 weeks of intervention (blood draws 3 and 5) and week 3 data represent those collected at 3 weeks of intervention (blood draws 4 and 6) with the control diet (control) containing the placebo powder or the diet containing the grape powder (grapes).
‡ P value for differences between the two intervention groups at week 3. No differences were observed at week 2 or week 3.
T-cell and monocyte activation
T-cell and monocyte populations in supernatants from PBMC were activated with anti-CD3/CD28 antibodies and LPS, respectively. The CD4+ and CD8+ T-cell populations were evaluated for changes in proliferation by flow cytometry. No differences in the proliferative responses of CD4+ or CD8+ T cells were observed between the grape and placebo powder groups. In the activated T-cell population, the production of cytokines secreted by T-helper 1 (interferon-γ and TNF-α) and T-helper 2 (IL-4 and IL-10) lymphocytes was measured. In the LPS-stimulated monocyte population, the production of TNF-α, IL-1β, IL-6 and IL-8 was measured. Table 6 summarises the results obtained at the time of maximal cytokine production for each population of cells. The production of the T-cell cytokines was maximal after 72 h of activation, and the production of the monocyte cytokines was maximal at 24 h after stimulation under the study conditions. No differences in cytokine production by activated T cells were observed between the placebo and grape powder groups. However, a significant increase in the production of IL-1β and IL-6 was observed in the LPS-stimulated monocytes of the grape powder group compared with the placebo powder group. An increase in the production of TNF-α was observed, but it did not reach significance (P= 0·094).
Table 6 Cytokine production by peripheral blood mononuclear cells activated with CD3/CD28 antibodies or lipopolysaccharide (LPS) (Unadjusted mean values and standard deviations; n 24)
IFN-γ, interferon-γ.
* Mean value was significantly different from that of the control group at week 3 (P< 0·05).
† Week 2 data represent data collected at 2 weeks of intervention (blood draws 3 and 5) and week 3 data represent those collected at 3 weeks of intervention (blood draws 4 and 6) with the control diet (control) containing the placebo powder or the diet containing the grape powder (grapes).
‡ P value for differences between the two intervention groups at week 3. No differences were observed for week 2.
Bioavailability of grape polyphenols
For the analysis of the bioavailability of the polyphenols catechin, epicatechin, resveratrol and quercetin and their metabolic products in the plasma, six subjects were randomly chosen. Samples from the second baseline blood draw (no grape powder) were used to compare the blood samples collected after 3 weeks of grape powder intervention for each subject. The polyphenols and their metabolites were present below the limit of detection. Neither quantifiable nor trace levels of catechin, epicatechin, resveratrol or quercetin were detected. For the polyphenols described above, the limits of detection of the HPLC-electrochemical instrument were 3·4, 3·4, 4·4 and 3·3 nmol/l, respectively. The typical extraction recoveries were 50–60 %.
Discussion
In the present study, we determined the potential of dietary grape powder, prepared from freeze-dried table grapes, to improve the plasma inflammatory marker concentrations, induce beneficial changes in lipid profiles and alter immune cell responses in obese human subjects who are at a high risk of developing CVD, insulin resistance and diabetes. The present study was patterned after our previous study with dietary strawberries(21) so that a comparison of the effects of different fruits on immune cell function and multiple inflammatory and lipid parameters could be made. In both studies, a 3-week intervention period was maintained and similar metabolic and functional measurements were utilised to determine the beneficial effects of fruit intake. Both studies also used four servings of fruit/d and followed the recommendation of the 2010 dietary guidelines of the US Department of Agriculture and Department of Health and Human Services( 29 ).
The consumption of grapes did not induce changes in plasma inflammatory marker concentrations in the obese subjects; however, the profiles of lipid particle subfractions revealed a reduction in the circulating concentrations of large LDL and large LDL-cholesterol particles in the blood of obese subjects who consumed the grape powder compared with those who consumed the placebo powder. Small LDL particles are considered to be more atherogenic than large LDL particles( Reference Koba, Yokota and Hirano 30 ), but no changes in the concentrations of small LDL or small LDL-cholesterol particles were detected between the grape and placebo powder groups in the present study. It is worth noting that the size of LDL particles appeared to decrease in the grape powder group compared with the placebo powder group, but this change did not reach significance (P= 0·089). The NMR subfractionation method used for determining the diameter of LDL particles is based on the mean diameter of large, medium and small LDL particles taken together. With a reduction in the concentrations of large LDL particles, as observed in the present study, the mean diameter of LDL particles would decrease as well. It is unclear how a decrease in the concentrations of large LDL particles without a decrease in those of small LDL particles is beneficial. However, in two recent articles, an association between elevated concentrations of large LDL particles and LDL-cholesterol and increased risk of CVD has been reported. As a part of the Genetics of Coronary Artery Disease in Alaska Natives (GOCADAN) study, Masulli et al. ( Reference Masulli, Patti and Riccardi 31 ) evaluated the relationship between atherosclerosis and lipid subfractions in a population-based sample of Alaskan Eskimos known to have a high risk of CVD but little risk of hyperlipidaemia. These investigators utilised NMR analyses of blood lipid subfractions combined with ultrasound measurements of carotid intima thickness and presence of carotid plaques and found a positive association between the carotid plaque score and elevated concentrations of large LDL-cholesterol and large LDL particles. In a multi-centre, case–control study, Goliasch et al. ( Reference Goliasch, Oravec and Blessberger 32 ) showed that increases in the concentrations of a number of different lipid subfractions, including VLDL, large intermediate-density lipoprotein, LDL-cholesterol and large LDL particles, were positively associated with premature myocardial infarction in subjects aged ≤ 40 years. Therefore, it is conceivable that dietary grapes may be effective at reducing the risk of developing CVD by lowering the concentrations of large LDL particles. In addition, the authors propose that the analysis of lipid subfractions may represent a more reliable and valuable method to quantify the risk of developing CVD than the conventional analysis of total cholesterol, LDL and HDL.
The mechanism by which the grape powder specifically decreased the concentrations of large LDL and large LDL-cholesterol particles remains unclear. However, roles for fruit polyphenols in lipid digestion, absorption and metabolism have been reported. Osada et al. ( Reference Osada, Suzuki and Kawakami 33 ) reported that apple polyphenol preparations fed to rats decreased the concentrations of liver and serum cholesterol. In this study, the activity of hepatic cholesterol 7α-hydroxylase was increased, and the authors suggested that the apple polyphenols increased cholesterol catabolism. An increased excretion of neutral and acidic steroids in the faeces of rats fed the apple polyphenol preparations compared with the control rats was also reported. Another study reported that the extraction juices of apple, grapes and red beet pomaces fed to rats increased the intestinal concentrations of primary bile acids, cholesterol and cholesterol metabolites, suggesting the inhibition of absorption( Reference Sembries, Dongowski and Mehrländer 34 ). In vitro studies carried out using cranberry extracts reported increased expression of LDL receptors and uptake of cholesterol in HepG2 hepatocytes compared with cells grown under control conditions( Reference Chu and Liu 35 ). Other studies, both in vivo and in vitro, have reported that proanthocyanidins are the most potent food components of fruits that repress intestinal lipid absorption, chylomicron secretion by the intestine and VLDL secretion by the liver, resulting in hypolipidaemia (reviewed in Bladé et al. ( Reference Bladé, Arola and Salvadó 36 )). Further research is required to understand the role of grapes and other fruits in the modulation of different lipid subfractions and the impact on CVD.
Ex vivo evaluation of immune cell function revealed a modulation of immune responsiveness by dietary grapes in healthy obese subjects. The production of both IL-1β and IL-6 was increased in the LPS-stimulated monocyte populations isolated from the grape powder group compared with the placebo powder group. IL-1β is an important mediator of the monocyte response to invading pathogens( Reference Dinarello 37 ). IL-1β is responsible for activating the release of TNF-α and IL-6( Reference Tosato and Jones 38 , Reference Netea, Simon and van de Veerdonk 39 ). Together, these cytokines stimulate the phagocytosis of pathogens by neutrophils and macrophages and result in the release of O and N radicals, which are important components of antimicrobial defence( Reference Netea, Simon and van de Veerdonk 39 ). The results of the present study suggest that dietary grapes sensitise the monocytes of obese individuals to increase the production of pro-inflammatory cytokines in response to a bacterial stimulus. The production of both IL-1β and IL-6 was increased by the consumption of four servings/d of grapes for 3 weeks. These data are in agreement with the results of a previous study in which the consumption of four servings/d of strawberries for 3 weeks was found to increase the production of TNF-α by the monocyte population of obese subjects after stimulation with LPS( Reference Zunino, Storms and Freytag 22 ). An increase in the production of TNF-α by LPS-stimulated monocytes was observed in the present study, although this change did not reach significance (P= 0·094). A retrospective analysis was carried out for all the parameters measured in the present study. For parameters with P values between 0·05 and 0·1 (TNF-α, soluble intercellular adhesion molecule-1, interferon-γ and LDL diameter), this post hoc analysis indicated that a significant difference may have been due an increase in the number of subjects and these data will be useful for designing future studies. Therefore, it is feasible that the increase in the number of subjects in the present study may have led to the finding that the production of the three pro-inflammatory cytokines IL-1β, IL-6 and TNF-α by LPS-stimulated monocytes was affected by grape consumption. It should be noted that immunological responses to pathogens are normally self-limiting. Therefore, the production of IL-1β, IL-6 and TNF-α by activated monocytes in response to infections would be short-lived and would not be expected to substantially contribute to obesity-associated risk factors, such as insulin resistance and CVD.
Grapes and other berries have been reported to exert health benefits in a number of in vivo studies. Animal and human studies have shown that the intake of grapes and grape products improves the indices of cardiovascular health by reducing hypertension and hyperlipidaemia and increasing antioxidant status in the blood (reviewed in Pérez-Jiménez & Saura-Calixto( Reference Pérez-Jiménez and Saura-Calixto 40 )). Recently, two servings/d of grape powder for 30 d have been reported to reduce systolic blood pressure and soluble intercellular adhesion molecule-1 concentrations in the blood of men with the metabolic syndrome compared with the placebo powder( Reference Barona, Aristizabal and Blesso 41 ). In a study carried out using dietary strawberry powder, a decrease in plasma vascular adhesion molecule-1 concentrations was observed in subjects with the metabolic syndrome after 8 weeks of intervention( Reference Basu, Fu and Wilkinson 42 ). In a 16-week study, the consumption of progressive doses of cranberry juice was found to decrease the plasma concentrations of both intercellular adhesion molecule-1 and vascular adhesion molecule-1( Reference Ruel, Pomerleau and Couture 43 ). Concord grape juice given to healthy adults was reported to decrease oxidised plasma LDL concentrations and increase ORAC in the serum( Reference O'Byrne, Devaraj and Grundy 44 ). Other clinical trials, either postprandial or longer term, have reported an increase in antioxidant status with the consumption of berries (reviewed in Basu et al. ( Reference Basu, Rhone and Lyons 45 )). In the present study, no differences were observed in adhesion molecule concentrations or antioxidant status in the blood. The results of the present study compared with those of studies carried out by others may be reflective of the polyphenol composition of the grape products used. The concentrations of catechin, epicatechin, quercetin and resveratrol in the grape powder used in the present study were reported to be 19·1, 12·5, 49 and 1·74 mg/kg powder, respectively, by the California Table Grape Commission. We did not observe detectable plasma concentrations of aglycone or metabolites of these polyphenols using the HPLC-electrochemical methodology. Because the subjects were instructed to fast overnight for at least 12 h before each blood draw, it is likely that these polyphenols were metabolically transformed and removed from the blood during this 12 h time period. Fruits contain diverse combinations and classes of polyphenols, so a direct comparison of clinical outcomes utilising different fruit products is problematic. Also, the duration of the intervention in the present study was 3 weeks compared with longer intervention periods in the studies described above. Therefore, we may have observed a more beneficial impact with a longer intervention period.
The results of the present study suggest that dietary grapes may induce beneficial alterations in potentially atherogenic lipid subfractions that are associated with an increased risk of obesity-related disease, such as CVD. However, as has been mentioned above, further studies are needed to address the roles of different lipid subfractions in CVD risk. Polyphenols and polyphenol-rich foods have been proposed to be immunosuppressive. Data obtained in the present study using dietary grapes and those in our previous study using dietary strawberries suggest that the consumption of these fruits, and most probably other polyphenol-rich fruits, increases the sensitivity of the monocyte population to bacterial challenges. The increased sensitivity may be an important means by which fruit consumption is beneficial to obese individuals who are at a higher risk of developing infections. These studies provide data to support larger trials with both obese and normal-weight individuals to determine the role of increased fruit consumption in immunological responses.
Acknowledgements
The present study was supported by the United States Department of Agriculture (USDA) Current Research Information System project no. 5306-51530-018-00D and a grant from the California Table Grape Commission. The USDA is an equal-opportunity provider and employer. The California Table Grape had no role in the design and analysis of the study or in the writing of this article.
The authors' contributions are as follows: S. J. Z. and E. L. B. designed the research; T. L. F., L. R. W., A. P. B. and D. H. S. conducted the research; S. J. Z. and J. M. P. analysed the data; S. J. Z. wrote the manuscript and had primary responsibility for the final content. All authors read and approved the final content of the manuscript.
None of the authors has any conflicts of interest to declare.


