The prevalence of obesity has increased worldwide, and it has been estimated that by 2030 nearly 40 % of world’s population will be overweight and one in five people will be obese(Reference Kelly, Yang and Chen1). Obesity is considered to be mostly caused by changes in the so-called obesogenic environment such as the highly processed food and the reduction in or replacement of physical activity(Reference Meldrum, Morris and Gambone2).
Obesity is related to a higher prevalence of the metabolic syndrome(Reference Grundy3). The metabolic syndrome is a set of risk factors for CVD and diabetes(Reference Alberti, Eckel and Grundy4). These factors are dysglycaemia, high blood pressure, raised TAG levels, low HDL-cholesterol levels and obesity(Reference Alberti, Eckel and Grundy4). However, it has been identified that some overweight/obese individuals showed a specific phenotype characterised by a healthy metabolic profile, without risk factors and with better cardiovascular prognosis(Reference Ortega, Lavie and Blair5). These metabolically healthy but overweight-obese (MHOO) individuals might have a lower risk of CHD, cerebrovascular diseases, metabolic diseases and CVD, in opposite to metabolically unhealthy but overweight-obese (MUOO) individuals(Reference Ortega, Lavie and Blair5,Reference Elagizi, Kachur and Lavie6) .
The major risk factors that contribute to the development of an unhealthy metabolic profile and the metabolic syndrome are insulin resistance, a high quantity of visceral adipose tissue and a high waist circumference, among others(Reference Sherling, Perumareddi and Hennekens7). The main causes of the metabolic syndrome are inadequate levels of physical activity and unhealthy dietary factors(Reference Pereira, Kottke and Jordan8). In this sense, it has been demonstrated that a Western diet pattern based on low intake of fruits and vegetables and a high intake of saturated fat could lead to the development of the metabolic syndrome, contributing to the promotion of a unhealthy metabolic profile(Reference Pereira, Kottke and Jordan8).
The benefits of a healthy diet in the treatment of the metabolic syndrome are largely known(Reference Mozaffarian9). Different dietary patterns such as the Mediterranean diet, the Dietary Approaches to Stop Hypertension diet and plant-based diets have demonstrated to improve the metabolic syndrome and the profile(Reference Tortosa, Tortosa and Bes-Rastrollo10–Reference Kahleova, Levin and Barnard12).
In this sense, diet could influence the development of the healthy or unhealthy phenotype. Previous studies demonstrated that MHOO adolescents have higher adherence to the Mediterranean diet(Reference Arenaza, Huybrechts and Ortega13), and MUOO adults adhere to pro-inflammatory diet(Reference Park, Choi and Lee14) compared with their counterparts. However, Hankinson et al. did not find any dietary differences between MHOO and MUOO adults(Reference Hankinson, Daviglus and Van Horn15). Evidence of dietary differences between MHOO and MUOO middle-aged adults is mixed. Therefore, the aim of the present study was to determine the differences in dietary parameters (energy and nutrient intake, adherence to the Mediterranean diet and consumption of food groups) in MHOO v. MUOO middle-aged adults.
Methods
Participants
A total of fifty-one Caucasian middle-aged adults were included in the present study (41·2 % women; 53·2 (sd 5·5) years). A total of 14·8 % participants were current smokers. Participants were selected from the cohort of the FIT-AGEING study (ClinicalTrials.gov ID: NCT03334357)(Reference Amaro-Gahete, De-la-O and Jurado-Fasoli16). The study was approved by the Ethics Committee on Human Research at the University of Granada and ‘Servicio Andaluz de Salud’ (CEI-Granada; 0838-N-2017), and all participants signed an informed consent. The study protocol and experimental design were applied in accordance with the last revised ethical guidelines of the Declaration of Helsinki. Inclusion criteria were to be sedentary (< 20 min of moderate-intensity physical activity on 3 d/week over the last 3 months), and to have a stable weight over the last 6 months. All participants reported to be free of disease, were not pregnant or were not lactating women, were not taking any medication and/or did not have a major illness that would limit the ability to perform the training programme. All data were collected between September and October 2016 and 2017.
Participants were classified as MHOO or MUOO(Reference Ortega, Lavie and Blair5). Individuals were classified as MHOO if they had a BMI ≥ 25 kg/m2 and did not met any of the following criteria: (i) serum TAG concentration ≥ 1·71 mmol/l, (ii) HDL-cholesterol concentration < 10·4 mmol/l for men and < 13 mmol/l for women, (iii) systolic blood pressure ≥ 130 mmHg or diastolic blood pressure ≥ 85 mmHg and (iv) serum fasting glucose level > 5·55 mmol/l. MUOO individuals were characterised as having a BMI ≥ 25 kg/m2 and at least one of the above-mentioned risk factors.
Blood sample collection
We collected blood samples from the antecubital vein after 12 h of nocturnal fasting. Serum samples were immediately centrifuged and stored in −80°C freezer until their analyses. All participants were requested to abstain from drugs and/or caffeine, to eat an established dinner before sampling and to not do any physical activity of moderate intensity (24 h before) and/or vigorous intensity (48 h before). Glucose, insulin, HDL, total cholesterol and TAG were measured using specific reagents by Beckman Coulter Diagnostics. All the samples were processed in an analyser (Beckman Coulter AU5832). Insulin was analysed by UniCel Dxl 600 (Beckam Coulter). Homoeostasis model assessment index(Reference Matthews, Hosker and Rudenski17) and LDL-cholesterol were calculated(Reference Friedewald, Levy and Fredrickson18). All samples were collected and processed in the Hospital PTS of Granada (Spain).
Blood pressure measurement
The blood pressure was measured with an automatic monitor (Omrom® HEM 705 CP; Health-care Co.) following the recommendations of the European Society of Cardiology (on the right arm, with the participants in a supine position and after 10 min of rest)(Reference Williams, Mancia and Spiering19). It was measured twice and the mean calculated.
Dietary assessment
We included different tools in order to evaluate dietary outcomes by a precise way. To assess dietary factors, we used three 24-h recalls collected on non-consecutive days, a previously validated semi-quantitative 100-item FFQ(Reference Vioque, Navarrete-Muñoz and Gimenez-Monzó20) and the PREvención con DIeta MEDiterránea (PREDIMED) questionnaire(Reference Schroder, Fito and Estruch21). All questionnaires were administered face to face by a qualified and experimented research dietitian.
Energy and macronutrient intake were assessed using the average of the three 24-h recalls conducted on non-consecutive days (one weekend day included), which has previously demonstrated to determine energy intake within 8–10 % of actual energy intake(Reference Baugh, Hedrick and Marinik22). We used coloured photographs of different portion sizes of food to help to estimate the quantity of food consumed(Reference López and Martín-Lagos23). The interviews were meal-sequence based and involved a detailed assessment and description of the food consumed. Dietary intake from the 24-h recalls was analysed for energy and macronutrient content using the EvalFINUT® software, which is based on US Department of Agriculture and ‘Base de Datos Española de Composición de Alimentos’ databases.
Dietary energy density of food and beverages (excluding drinking water) was calculated as the total energy intake (kJ/d) divided by the total weight of daily food intake (g/d)(Reference Ledikwe, Blanck and Khan24).
Food serving consumption was assessed using the FFQ. For each FFQ food item, a commonly used portion size was described (slices, cups, teaspoons, etc.), and the participants were asked how often they had consumed that unit on average over the last 3 months. Emphasis was added to ensure that the answers were related to the long-term dietary factors and not to recent dietary changes. Each FFQ food item was converted into servings, considering the standard portion weight of each FFQ food item collected in the own questionnaire (amount consumed/weight of portion).
The adherence to the traditional MedDiet was assessed using the 14-point questionnaire of adherence to the MedDiet used and validated in the PREDIMED trial(Reference Schroder, Fito and Estruch21). The PREDIMED questionnaire includes twelve questions related to frequency intake of key foods and two questions related to specific dietary habits of the MedDiet. Each question scores 0 or 1 point. The global score ranges from 0 to 14, where 0 point = null adherence and 14 points = complete adherence to the MedDiet.
All dietary outcomes were evaluated in a quiet, bright and spacious room in the Instituto Mixto Universitario Deporte y Salud of the University of Granada (Spain).
Anthropometric measurements and body composition assessment
Weight and height were measured using an electronic scale (model 799; Electronic Column Scale) and the BMI calculated (kg/m2). Lean mass, fat mass and visceral adipose tissue were evaluated by dual-energy X-ray absorptiometry (Discovery Wi; Hologic, Inc.) following the manufacturer’s recommendations.
Statistical analysis
The sample size and power calculations are made based on the data of a randomised control trial (The FIT-AGEING project(Reference Amaro-Gahete, De-la-O and Jurado-Fasoli16); ClinicalTrials.gov ID: NCT03334357). The principal aim of the FIT-AGEING study was to determine the effect of different training modalities on health-related parameters (i.e. body composition among others) in sedentary healthy adults. The sample size and the power of the study were based on the data of a pilot sample (n 30). We considered different health-related parameters (i.e. body composition among others) and differences between pre- and post-treatment in order to assess the sample size requirements for the one-way ANOVA. A sample size of sixty-eight participants was predicted to provide statistical power of 80 %, considering a type I error of 0·05. Therefore, assuming a maximum loss of 25 %, we decided to recruit eighty participants.
Visual check of histograms, Q–Q and box plots were used to verify the distribution of all variables. The descriptive parameters are reported as means and standard deviations.
Independent-samples t tests were used to study the differences in body composition and blood parameters between MHOO and MUOO.
One-way ANOVA was used to test the differences between MHOO and MUOO in dietary parameters. The χ 2 test was used to examine the difference between MHOO and MUOO in the compliance of the PREDIMED items.
One-way ANCOVA was used to study the differences between MHOO and MUOO in dietary parameters, adjusting by sex, age and energy intake.
The analyses were conducted using the Statistical Package for Social Sciences (SPSS, version 25.0, IBM SPSS Statistics; IBM Corporation), and the level of significance was set at < 0·05. Graphical presentations were prepared using GraphPad Prism 5 (GraphPad Software).
Results
Table 1 shows the characteristics of the study participants. There were no differences between MHOO and MUOO participants in the body composition variables.
Table 1. Descriptive characteristics of participants
(Mean values and standard deviations)
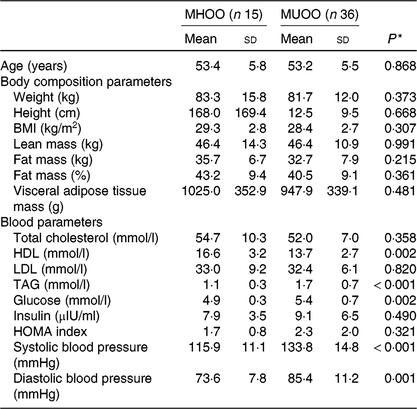
MHOO, metabolically healthy overweight-obese; MUOO, metabolically unhealthy overweight-obese; HOMA, homoeostatic model assessment for insulin resistance.
* P value obtained from independent-samples t test.
No significant differences were observed in energy intake (Fig. 1(a)), fat intake (Fig. 1(b)), protein intake (Fig. 1(c)), carbohydrate intake (Fig. 1(d)), fibre intake (Fig. 1(e)) and dietary energy density (Fig. 1(f)) between MHOO and MUOO (all P ≥ 0·352). These results remained after including sex, age and energy intake in the model (Table 2; all P > 0·313).
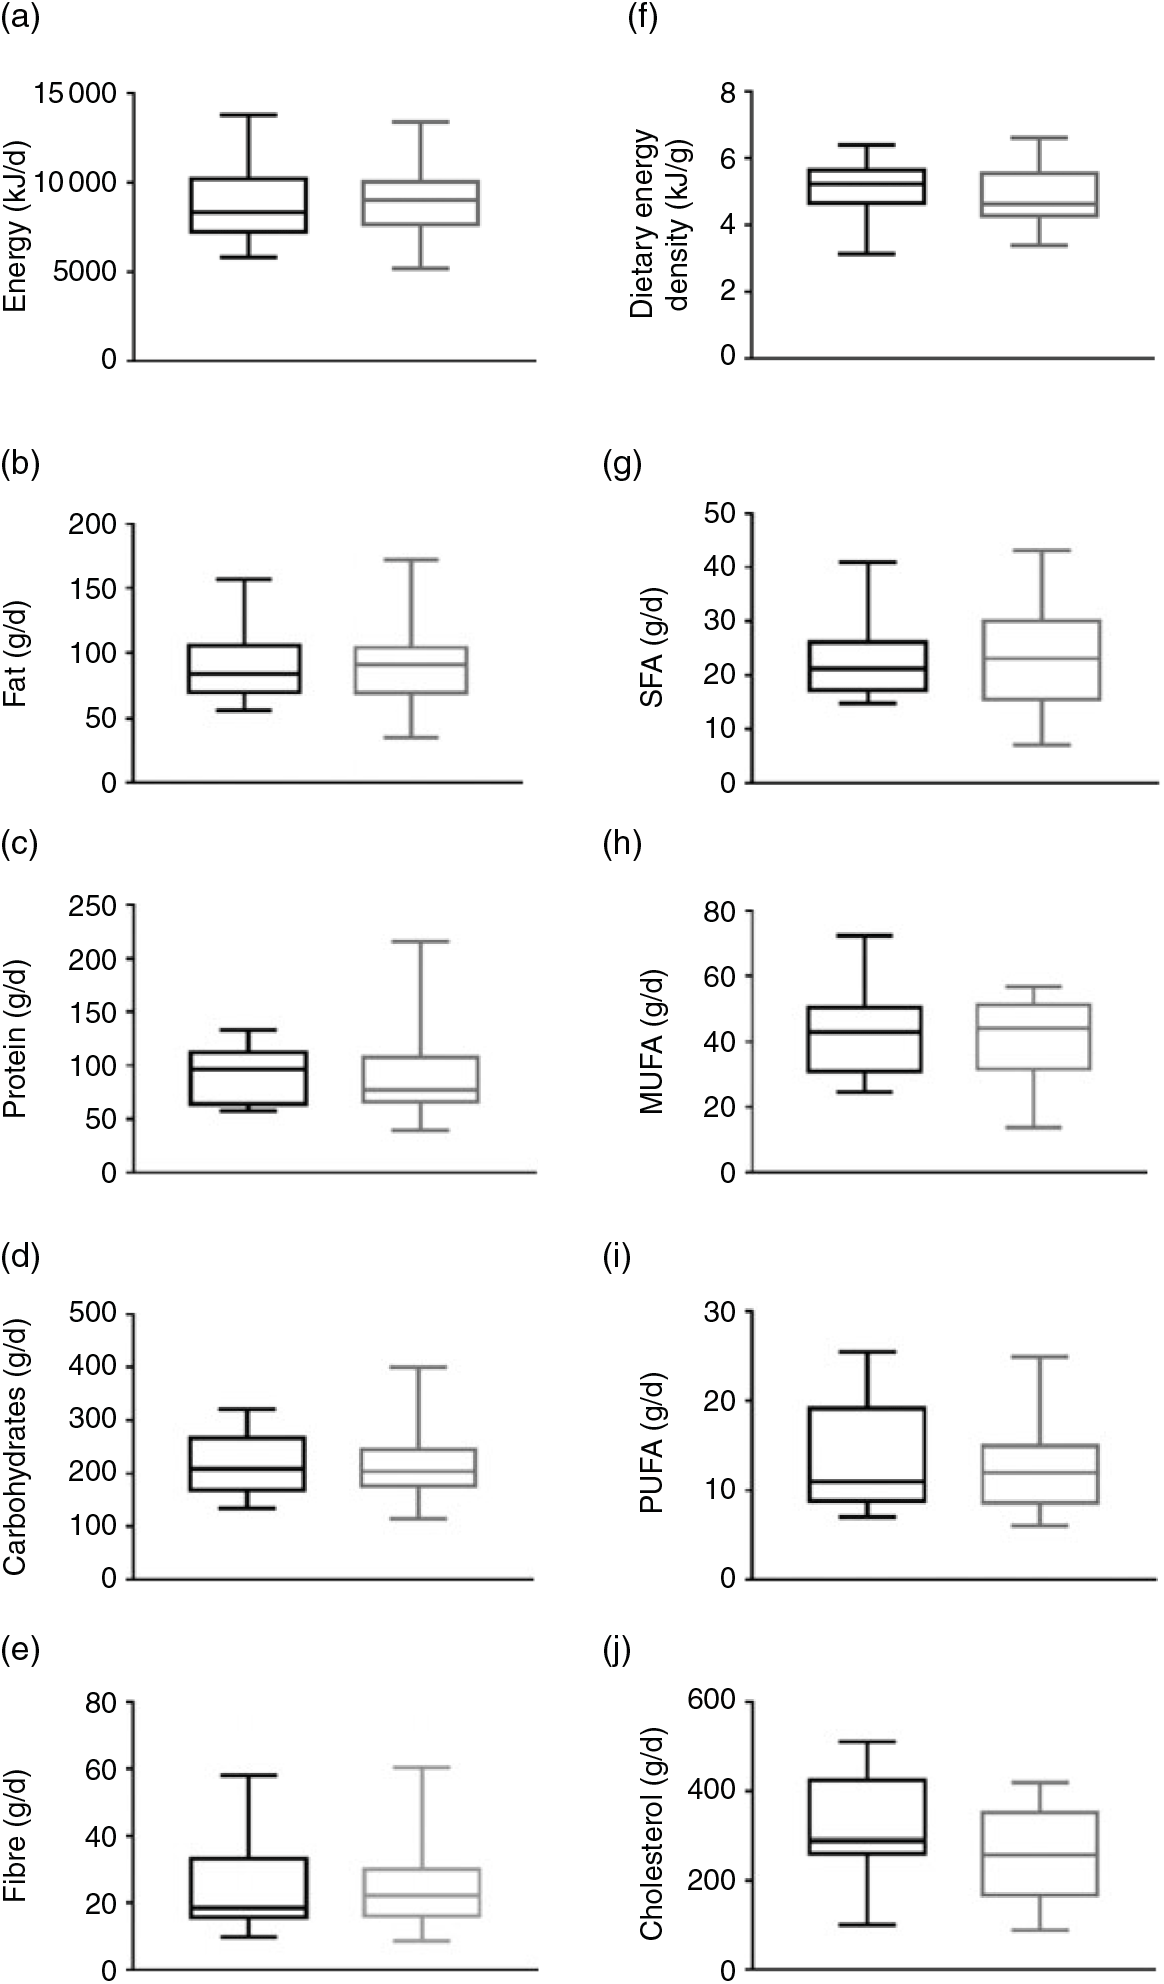
Fig. 1. Dietary intake in metabolically healthy overweight-obese (black plots) and metabolically unhealthy overweight-obese (grey plots) individuals. Data are means and standard deviations. P values are from one-way ANOVA. (a) P = 0·640, (b) P = 0·874, (c) P = 0·879, (d) P = 0·594, (e) P = 0·352, (f) P = 0·763, (g) P = 0·728, (h) P = 0·562, (i) P = 0·445, and (j) P = 0·119.
Table 2. Differences between metabolically healthy and unhealthy overweight-obese adults in energy and nutrient intake*

* Values obtained from ANCOVA adjusting by sex (model 1); age (model 2); energy intake (model 3).
The SFA, MUFA, PUFA and cholesterol fatty acid intake were similar between groups (Fig. 1; all P ≥ 0·119). These findings persisted when sex, age and energy intake were included in the model (Table 2; all P ≥ 0·107).
MHOO individuals had a higher fish consumption compared with MUOO individuals (Table 3; 7·6 (sd 2·9) v. 5·8 (sd 2·7) servings/week; P = 0·035), which remained after including sex (F = 4·731, P = 0·033, η 2 = 0·091), age (F = 4·778, P = 0·034, η 2 = 0·091) and energy intake (F = 4·681, P = 0·036, η 2 = 0·092) as the covariates (Table 4). MUOO individuals had a higher nut consumption compared with MHOO individuals (Table 3; 5·8 (sd 3·9) v. 3·3 (sd 3·8) servings/week; P = 0·047), which was attenuated after including sex (F = 3·967, P = 0·052, η 2 = 0·078), age (F = 3·984, P = 0·052, η 2 = 0·078), energy intake (F = 3·460, P = 0·069, η 2 = 0·071) as the covariates (Table 4). No differences were observed in other food group consumption between MHOO and MUOO individuals (Table 3; all P ≥ 0·105).
Table 3. Participants’ intake and consumption of different food groups
(Mean values and standard deviations)
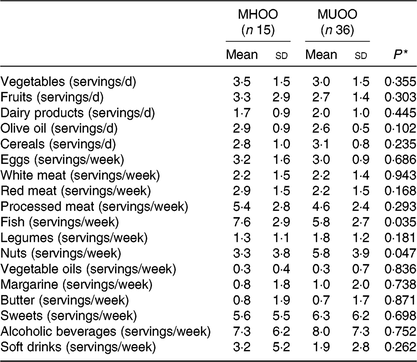
MHOO, metabolically healthy overweight-obese; MUOO, metabolically unhealthy overweight-obese.
* P values from one-way ANOVA.
Table 4. Differences between metabolically healthy and unhealthy overweight-obese adults in food group consumption*
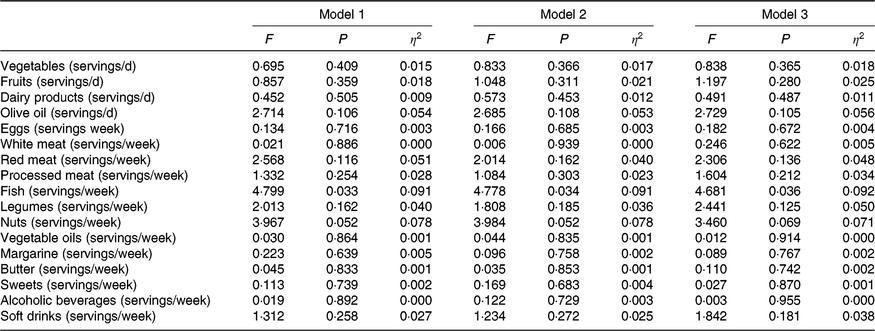
* Values obtained from ANCOVA adjusting by sex (model 1); age (model 2); energy intake (model 3).
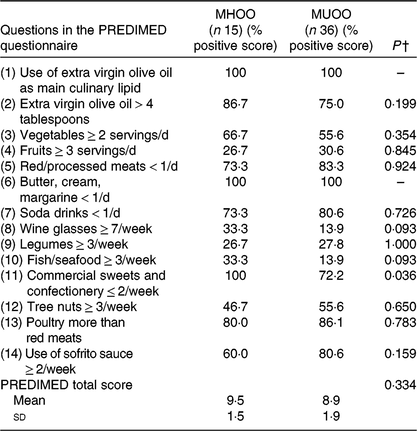
We showed significant differences in the percentage of positive score in the commercial sweets and confectionery item of the PREDIMED questionnaire between MHOO and MUOO individuals (Table 5; 100 v. 72·2 %; P = 0·036), which remained after including sex (P = 0·036), age (P = 0·036) and energy intake (P = 0·039) as the covariates (Table 6). No differences were observed in the remaining items of the PREDIMED questionnaire and in the PREDIMED total score between MHOO and MUOO individuals (Table 5; all P ≥ 0·055).
Table 5. Participants’ response frequency of food items included in the PREvención con DIeta MEDiterránea (PREDIMED) questionnaire*
(Percentage positive scores; mean values and standard deviations)
MHOO, metabolically healthy overweight-obese; MUOO, metabolically unhealthy overweight-obese.
* Data are presented as percentage of positive score of the question.
† P values from χ 2 analysis and one-way ANOVA.
Table 6. Differences between metabolically healthy and unhealthy overweight-obese adults in PREvención con DIeta MEDiterránea (PREDIMED) items and total score*
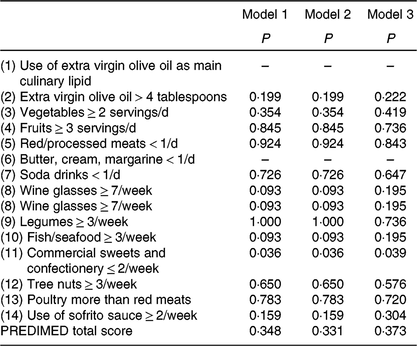
* Values obtained from χ 2 analysis adjusting by sex (model 1); age (model 2); and energy intake (model 3).
All previous analyses were adjusted by cardiorespiratory fitness, muscular fitness and physical activity levels of the participants. No differences were found when we included the above-mentioned variables in the models (data not shown).
Discussion
The present study shows that the MHOO individuals registered a higher fish consumption compared to the MUOO individuals, independently of sex, age and total energy intake. Moreover, a higher compliance (lower consumption) in the commercial sweets and confectionery item of the PREDIMED questionnaire was observed in the MHOO individuals compared with the MUOO individuals, independently of sex, age and total energy intake. However, no differences were noted in other dietary factors including energy and nutrient intake, other food group consumption and in the PREDIMED total score. A near-significant trend toward significance was observed in nut consumption, wine and fish items of the PREDIMED questionnaire.
It is well known that consumption of fish and other sea-derived products are related to lower risk of the metabolic syndrome and other cardiometabolic diseases(Reference Kim, Xun and He25). A previous meta-analysis found that the incidence of the metabolic syndrome is reduced by 6 % with an increment of one serving/week of fish consumption(Reference Kim, Xun and He25). In this sense, previous studies have suggested that high fish consumption was associated with lower TAG levels, higher HDL-cholesterol levels and lower risk of the metabolic syndrome in Norwegian middle-aged adults(Reference Karlsson, Rosendahl-Riise and Dierkes26) and in Norwegian adults of 26–70 years(Reference Tørris, Molin and Cvancarova Småstuen27). High fish consumption was also associated with lower waist circumference, lower TAG levels, higher HDL-cholesterol levels and lower risk of the metabolic syndrome in a 13-year follow-up study from the above-mentioned cohorts(Reference Tørris, Molin and Cvancarova Småstuen28). This relationship could be explained by different potential mechanisms based on the fish nutrient contents. Fish are rich in n-3 long-chain PUFA (EPA and DHA), proteins, taurine, vitamin D, vitamin B, iodine and Se(Reference Karlsson, Rosendahl-Riise and Dierkes26,Reference Tørris, Molin and Cvancarova Småstuen28) . These nutrients have anti-inflammatory properties(Reference Tørris, Molin and Cvancarova Småstuen28), reduce abdominal obesity(Reference Tørris, Molin and Cvancarova Småstuen28), improve blood lipid profile(Reference Tørris, Molin and Cvancarova Småstuen28), have hypotensive effects(Reference Tørris, Molin and Cvancarova Småstuen28) and induce fatty acid oxidation(Reference Karlsson, Rosendahl-Riise and Dierkes26), these effects are independent of the type of fish (lean or fatty) consumed(Reference Karlsson, Rosendahl-Riise and Dierkes26–Reference Tørris, Molin and Cvancarova Småstuen28). Therefore, the intake of the above-mentioned nutrients found in fish and sea-derived products could develop a better metabolic profile independent of the BMI status(Reference Castilló Garzón, De Meester and Watson29).
MHOO individuals have a higher compliance in the commercial sweets and confectionery item of the PREDIMED questionnaire (≤ 2 servings/week). A previous study conducted in adults of 19–70 years demonstrated that a higher consumption of energy-dense snacks (i.e. biscuits, cakes, candies and chocolates) could be a dietary risk factor for the development of the metabolic syndrome(Reference Mirmiran, Bahadoran and Delshad30). Commercial sweets and confectionery are rich in added sugars, and their consumption is associated with dyslipidaemia, insulin resistance, CVD and type 2 diabetes and increases the risk of metabolic diseases(Reference Stanhope31), independent of the weight or the total energy intake(Reference Stanhope31). Commercial sweets and confectionery are the main sources of trans-fatty acids(Reference Micha and Mozaffarian32). Trans-fatty acid intake influences blood lipids and lipoprotein levels(Reference Micha and Mozaffarian32), increases systemic inflammation(Reference Micha and Mozaffarian32), dysregulates endothelial function(Reference Micha and Mozaffarian32), increases adiposity(Reference Micha and Mozaffarian32) and disrupts glucose–insulin homoeostasis(Reference Micha and Mozaffarian32), increasing, therefore, the prevalence of the metabolic syndrome(Reference Micha and Mozaffarian32,Reference Cascio, Schiera and Di Liegro33) . In addition, commercial sweets and confectionery have a high content of refined flours, which are associated with insulin resistance and the metabolic syndrome in adults(Reference Radhika, Van Dam and Sudha34).
In terms of the remaining dietary factors, our results are not in accord with previous studies that observed that (i) a high adherence to the Mediterranean diet pattern protected against the metabolic syndrome(Reference Di Daniele, Noce and Vidiri35), mainly due to the higher consumption of olive oil, fruits, vegetables, legumes and nuts(Reference Di Daniele, Noce and Vidiri35); (ii) a high fruit intake was negatively associated with the prevalence of the metabolic syndrome(Reference De Oliveira, McLellan and Vaz De Arruda Silveira36), due to their high content in soluble fibre that reduces insulin secretion and regulates blood lipids(Reference De Oliveira, McLellan and Vaz De Arruda Silveira36); (iii) a low saturated fat intake was negatively associated with the prevalence of the metabolic syndrome(Reference De Oliveira, McLellan and Vaz De Arruda Silveira36), due to the fact that saturated fat increases visceral adipose tissue and dysglycaemia and (iv) energy-restricted diets and moderate-high-protein diets protected against the prevalence of the metabolic syndrome(Reference de la Iglesia, Loria-Kohen and Zulet37), due to the decrement of abdominal obesity, the regulation of blood lipids and glucose levels(Reference de la Iglesia, Loria-Kohen and Zulet37). The lack of accordance with previous studies in the remaining dietary factors might be due to the small sample size that may fail to detect meaningful differences between groups or the different nationalities of the previous study(Reference De Oliveira, McLellan and Vaz De Arruda Silveira36).
The main weakness of the present study is the cross-sectional design, which does not allow to identify any causal association. Additionally, the study sample was constituted by sedentary middle-aged adults (45–65 years), thus we cannot extrapolate our results to younger and/or physically active individuals. And lastly, we did not differ between lean and fatty fish and this differentiation could be a determinant of the association found.
In conclusion, our study showed that the MHOO individuals registered a higher fish consumption compared with the MUOO individuals, independent of sex, age and total energy intake. Moreover, a higher compliance in the commercial sweets and confectionery item of the PREDIMED questionnaire was observed in the MHOO individuals compared with the MUOO individuals, independent of sex, age and total energy intake. Longitudinal studies with fish-type differentiation are required to establish causal association.
Acknowledgements
The authors would like to thank all the participants who participated in the study for their time and effort. The present study is part of a PhD thesis conducted in the Biomedicine Doctoral Studies of the University of Granada, Spain. The study is supported by the Spanish Ministry of Education (FPU14/04172 and FPU15/03960). We are grateful to Dr Ángel Gutiérrez for his support with all of the study.
No financial support was received for this study.
L. J. F., A. D. O., M. J. C. and F. J. A. G. conceived and designed the study; L. J. F., A. D. O., M. J. C. and F. J. A. G. acquired data; L. J. F. and F. J. A. G. elaborated the statistical section; L. J. F. and F. J. A. G. drafted the manuscript, and M. J. C. revised the manuscript; all authors read and approved the final manuscript.
The authors report no conflicts of interest.


