To monitor the diet of populations there is a need for methods that are accurate, easy for the subject to complete and appropriate to the target population.
Assessing habitual food intake of any population group is challenging. Common problems encountered include under-reportingReference Goris, Westerterp-Plantenga and Westerterp1, Reference Black2, subject selection bias and recording biasReference Livingstone, Prentice, Strain, Coward, Black, Barker, McKenna and Whitehead3. Additional limitations must be considered when children are the subjects. The skills and limitations of the population to be studied must be considered. When children are the subjects these may include issues of literacy and writing skills, limited food recognition skills, memory constraints and concentration span.
In order that intakes of food can be converted into intakes of nutrients or other food constituents, a measure or estimate of the portion size of each food item consumed is required. Weighing and recording all foods eaten requires a highly motivated and committed subject population that is unlikely to be representative of the general population. Berg et al. discuss that when participation in a project requires a great deal of subject commitment or divulging information of a sensitive nature then there is a risk that the response rate will be lowReference Berg, Jonsson, Conner and Lissner4. Of those approached to take part, 64 % completed the recent National Diet and Nutrition Survey (NDNS) of young people aged 4–18 years in the UK, which used a 7 d weighed diary methodReference Gregory and Lowe5. In addition, approximately 41 % of children taking part in the NDNS survey were classified as likely to have under-reported their energy intake using cut-off points based on multiples of BMR proposed by Torun et al. Reference Torun, Davies, Livingstone, Paolisso, Sackett and Spurr6. This highlights the need to shift the burden of reporting dietary intake from the respondent to the researcher and to develop alternative methods of assessing food intake.
As an alternative to weighing all food items eaten, a number of methods of measuring dietary intake rely on subjects' estimates of portion size. Tools are available to assist the subject with this task including food photographs, food replicas and food modelsReference Nelson, Atkinson and Meyer7–Reference Livingstone and Robson10. However, the application of these tools in improving portion size estimation by children has not been investigated systematicallyReference Livingstone and Robson10.
The estimation of portion sizes from food photographs is associated with both over- and underestimation but, food photographs have been shown to increase the accuracy of food portion size estimation compared with unaided estimatesReference Lucas, Niravong, Villeminot, Kaaks and Clavel-Chapelon11, Reference Robinson, Morritz, McGuiness and Hackett12 and therefore increase the accuracy of nutrient intake estimation derived from estimated portion sizesReference Nelson, Atkinson and Darbyshire13. However, food photographs were developed for use with adults and the majority of validation studies have been conducted with adults.
Many adults have difficulty accurately estimating portion sizeReference Webb and Yuhas14, Reference Guthrie15 and it is hypothesised that children will find this even more difficult. Frobisher & MaxwellReference Frobisher and Maxwell16 found greater errors in both accuracy and precision of portion size estimates made using food photographs when children were the subjectsReference Frobisher and Maxwell16. The latter study used photographs of typical adult portion sizes and the errors in portion size estimation when children used the adult food photographs were so great that the authors concluded that the tool was unsuitable for use with childrenReference Frobisher and Maxwell16. Foster et al.Reference Foster, Matthews, Nelson, Harris and Adamson17 found that whilst the accuracy of estimates of food portion size made by children using adult food photographs was poor, children were able to estimate portion size with accuracy approaching that of adults when provided with food images of age-appropriate portion sizesReference Foster, Matthews, Nelson, Harris and Adamson17.
The present study set out to investigate the application of age-appropriate tools in improving portion size estimation by children.
Method
The aim of the present study was to examine children's perception and conceptualisation of food portion sizes and the accuracy with which children can estimate food portion sizes using three tools that explore the potential of three different media.
Study population
Children aged 4–16 years attending three primary schools and two secondary schools in Newcastle upon Tyne, UK were recruited. A recruitment letter detailing what the study involved was sent to the parents of all children attending each school and parental consent was sought for participation in the study. Ethical approval for the study was granted by the Newcastle and North Tyneside Health Authority.
Study design
The design of the study was to provide children with foods to eat of known weights and to assess the accuracy with which the children estimated the portion sizes of those foods using each portion size assessment tool in a 24 h recall interview. Using the tools, children were asked to estimate the amount of food that they were served and the amount of food they left over. The foods were served as two menus. Estimates for each menu using each tool were made on separate occasions. The order of administration of the interviews was randomised to minimise the impact of any potential learning effect. A summary of the study design is given in Fig. 1.
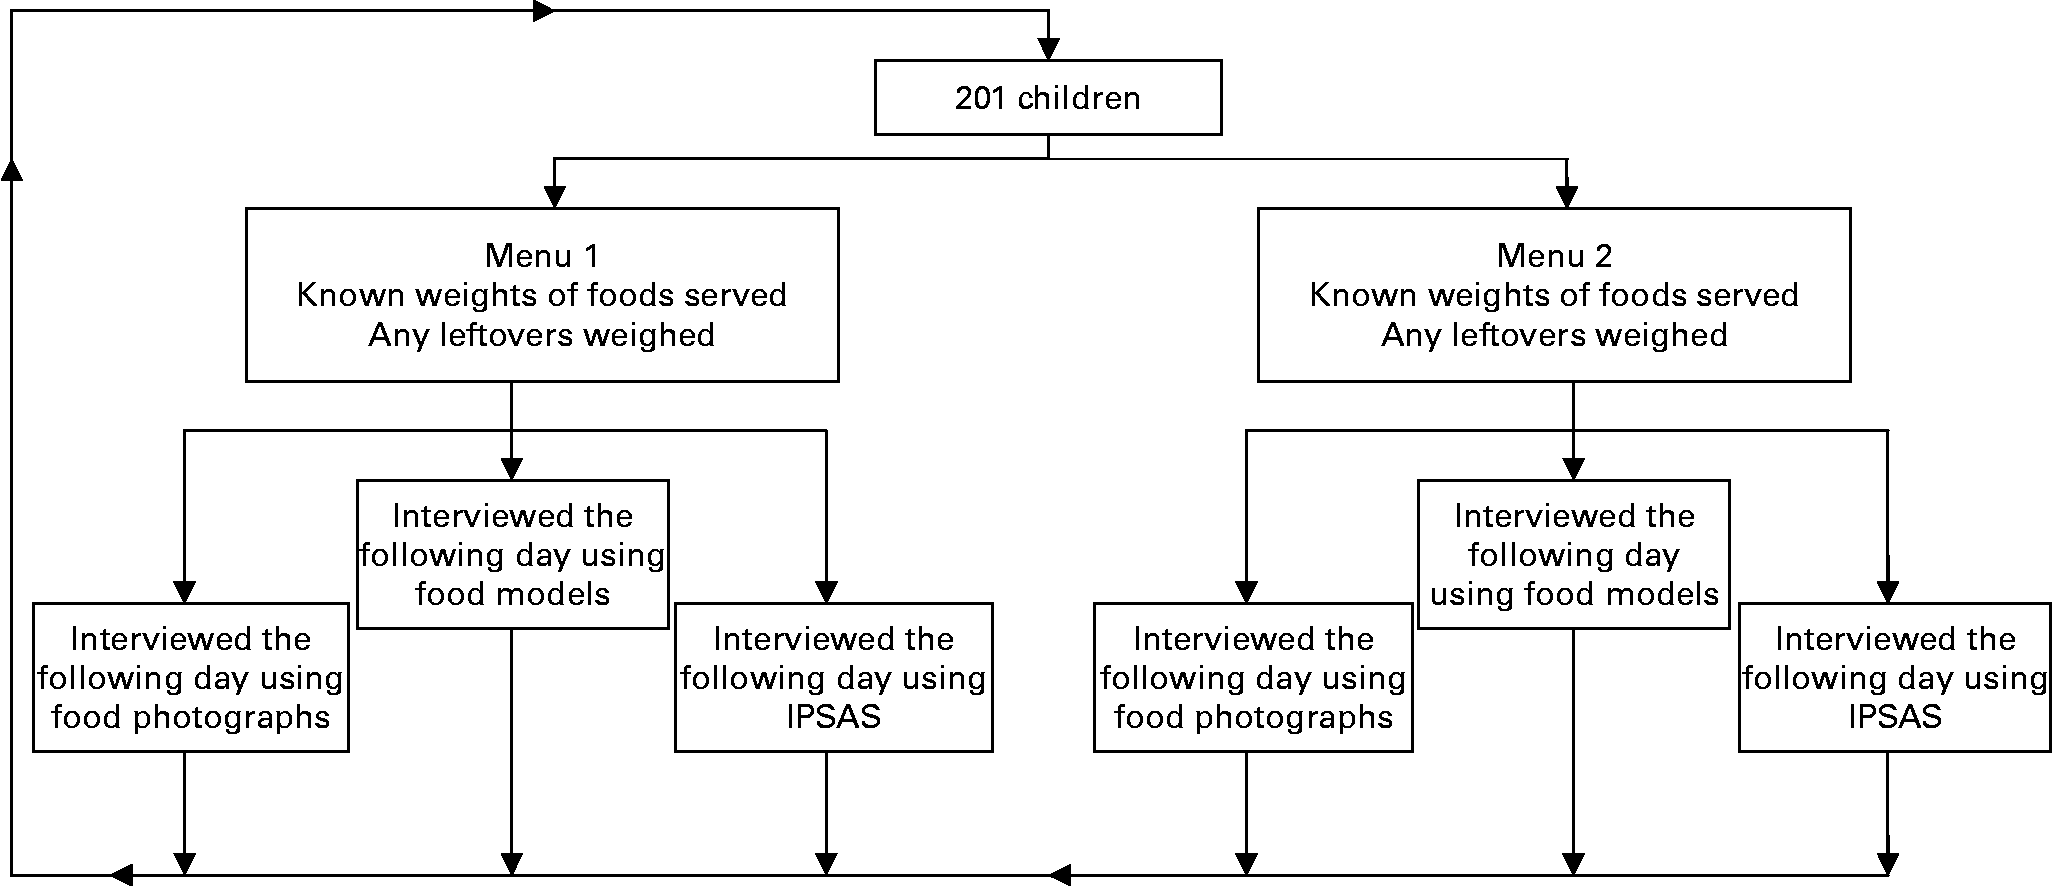
Fig. 1 Study design. All children completed all six test combinations. The order of administration of the tests was randomised. IPSAS, interactive portion size assessment system.
Portion size assessment tool development
Three portion size assessment tools were developed using three different media. These were food photographs, food models and a novel interactive portion size assessment system (IPSAS).
The food photographs are colour images of food depicting seven images of increasing portion size per A4 page (for an example page, see Fig. 2). The food models are a series of shapes, varying in size, made from wood and Pyrex that can be used for portion size estimation of a variety of foods (Fig. 3). The IPSAS is a computer-based system that allows the child or interviewer to scroll through images of food depicting increasing portion sizes. These images are photographs of real foods that are used to indicate the portion size served and any food left over (Fig. 4). The system automatically records the portion size selected and stores this and related data, including the subjects' details. These data can easily be exported into a database or statistical software.

Fig. 2 Example page of food photographs.

Fig. 3 Photograph of food models.

Fig. 4 Example screen from the interactive portion size assessment system (IPSAS).
Four sets of each tool were produced based on portion sizes appropriate to each of four age groups (4–6 years, 7–10 years, 11–14 years and 15–16 years). The portion sizes were identified from the weights of foods consumed by children in each of the four age groups during the NDNS of young people aged 4–18 yearsReference Gregory and Lowe5. For all three tools, seven weights from the 5th to the 95th centile of weight served were calculatedReference Barton, Wrieden, Longbottom, Adamson and Ogston18 and presented for estimation of the amount of food served. These same images or models were used for estimation of leftovers where these were a significant proportion of the original food served. In addition, seven separate images or models were presented to obtain a measure of the food left over when the amount left was small. These were seven weights down from the 5th centile to the smallest representable portion. These weights were chosen using equal increments on a log scale. The decision to present the portion sizes on a log scale was taken because it is known from perceptual research that the sensory system responds in a logarithmic fashion to objects in the external world, a phenomenon known as Weber's law. The just noticeable difference is defined as the minimal difference between two stimuli that leads to a change in experience. Weber's law asserts that as the magnitude of a stimulus increases, the just noticeable difference gets bigger, usually in proportion to the stimulus magnitudeReference Shiffman19. For a variety of sensory stimuli, Weber's law is experimentally verifiableReference Macmillan and Creelman20.
Details of foods served to the children
The foods selected for inclusion in the study were foods commonly consumed by children in each age group. The principal data source was the NDNS of young people aged 4–18 yearsReference Gregory and Lowe5. The foods were selected to include a variety of appearances, consistencies and textures. Both single foods and foods served as part of a meal were included. Combinations of these foods were used to create two menus each of breakfast, lunch and a snack. Details of the foods served to the children are given in Table 1.
Table 1 Foods selected for inclusion in the study
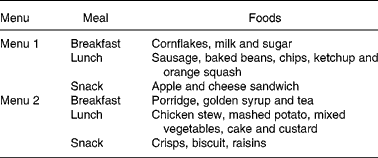
The portions served were a mixture of small, medium and large portions; these were the 25th, 50th and 75th centile respectively of weight of food served from the NDNS survey for children of primary school age or secondary school age. All children attending a particular meal were served the same foods and exactly the same quantities. Children were served breakfast, lunch and a snack prepared by the study team, in a designated room in school, at times throughout the school day. Within any one school (primary or secondary) children ate together in mixed sex and mixed age groups. Children were not forced to consume any foods they did not like but leftovers were weighed and estimated at interview at the individual food level.
Foods were served to children on a standard-sized dinner plate. We avoided using an identical plate to that used in the pictures and served portion sizes that did not exactly match any of those depicted in the portion size assessment aids. An exact match may have increased the apparent validity of the tool as it is unlikely this would occur if the tools were used in assessing dietary intake in a free living situation.
Interviews
The accuracy and precision of the portion size assessment tools were tested using a 24 h recall interview. The children were served foods of known weights and any leftovers were weighed. The following day the children were asked to estimate the amount of food that they had been served and the amount they had left over using one of the three tools. For the food photographs and IPSAS methods children were asked to select the image that was closest to the amount of food they were served and that they left over. For the IPSAS the interviewer scrolled through the images directed by the child. They were also instructed that they could indicate that the portion was in between two of the images if there was not a close match. For the food models children were instructed by the interviewer to show them the amount of food served and left over using the food models. They were informed that they could use more than one model or indicate that the portion was a proportion of one model if they wished. The models were calibrated for use in estimation of portion size of different foodstuffs based on each food's density.
All children estimated portion sizes served and the amount of food left over from both menus using each of the three assessment tools. Children were served all foods from each menu on three separate days (6 d of intake in total) and attended six interviews.
Statistical analysis
The data were analysed in two ways:
(1) The child's estimate of the amount of food served was compared with the actual weight of food served with no account of leftovers;
(2) The child's estimate of the amount of food they consumed (child's estimate of the weight of food served – child's estimate of leftovers) was compared with the actual weight of food consumed by the child.
The distribution of ratios is generally skewed and the analysis was therefore performed on the logarithms of the ratios (base 10) and the results presented in terms of ratios of geometric means. The accuracy of the portion size assessment tools was assessed by plotting the geometric mean of the ratio of the child's estimate of the amount of food served (or consumed) against the actual weight of the food served (or consumed). The error bars depict the geometric mean ± 2 standard deviations and give a measure of the precision of the estimates. Accuracy is defined as the proximity of the mean of the children's estimates of portion size to the actual weight of the food served (or consumed). Precision is defined as the variability of individual estimates around the mean.
To investigate the relative performance of the portion size assessment tools a univariate ANOVA with child identification and tool as fixed factors was performed. This allowed us to predict the significance of the difference in the ratio of the child's estimate of the amount of food served (or consumed) to the actual weight of the food served (or consumed) between the different tools.
The nutritional consequences of children's errors in portion size estimation were assessed. The actual amounts of energy, fat, protein, carbohydrate, vitamin C, Fe and Ca provided by the foods from menu 1 were calculated both for the amounts of foods served and also the amounts consumed. This was then compared with the nutrient content of menu 1 either served or consumed using the weight for each food based on the children's mean estimate of portion size.
Results
Interview completion
The target was to include 200 children in the study. A total of 201 children between the ages of 4 and 16 years participated in the study, 21 % of those approached. Interview completion rates were high for all age groups, with 80 % of all intended interviews completed (Table 2).
Table 2 Subject recruitment and interview completion

Performance using the three tools
Considering all age groups together, there was a significant difference between the portion size assessment tools, with estimates using the IPSAS being closest to the actual weight of the food both as served and as eaten (Table 3). For weight of food as served, children underestimated by 4 % on average using the IPSAS but overestimated by 7 % on average using the photographs and by 21 % using the food models (Table 3). For weight of food consumed, children overestimated by 13 % using the IPSAS, 18 % using the photographs and 46 % using the models (Table 3). The proportion of food left over was 26·3 %; this varied for different foods and ranged from 3·7 % for cake to 49·1 % for vegetables.
Table 3 Accuracy of children's estimates of food portion size served and consumed, all foods and all age groups combined (Geometric means and 95 % confidence intervals)

IPSAS, interactive portion size assessment system.
* Ratio of the child's estimate of the amount of food served (or consumed) to the actual weight of the food served (or consumed).
Fig. 5 shows the geometric mean of the ratio of the children's estimates of portion size served (and consumed) to the actual size of the portion served (and consumed), ± 2 standard deviations. Mean estimates of the amount served using the photographs and the IPSAS were very close to the actual weight. The precision of the estimates was greater using the IPSAS, as indicated by the tighter error bars. For estimates of the amount of food consumed, variability was much greater than estimates of the amount of food served for all tools. Mean estimates of the amount of food consumed using the photographs and IPSAS were close to the actual weight of the food consumed; variability was lower for estimates using the IPSAS (Fig. 5). However, this difference in variability was not as marked as for the estimates of portion size served.
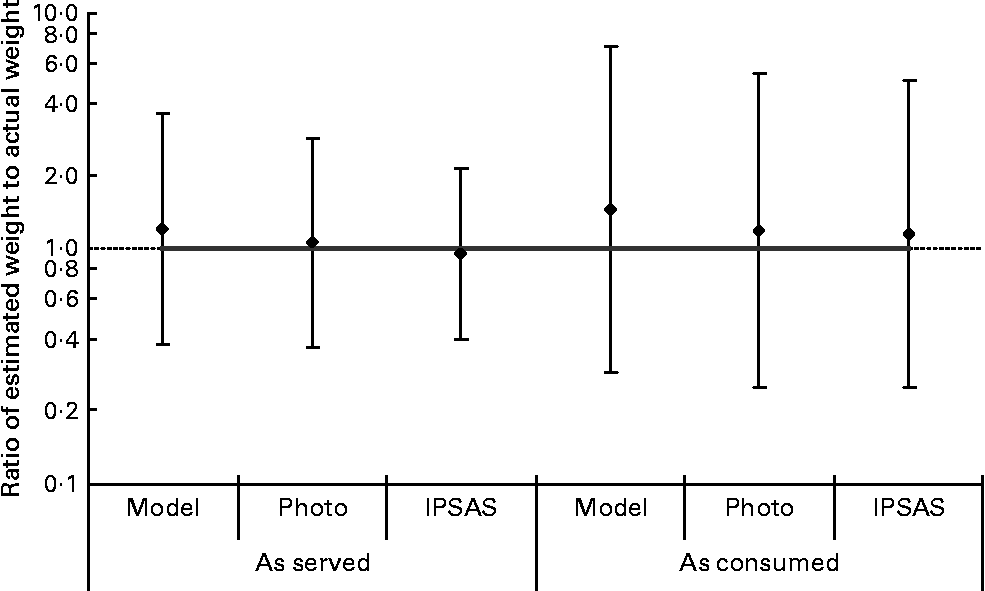
Fig. 5 Accuracy of children's estimates of food portion size using each portion size assessment tool – all foods combined (as served and as consumed). The line at 1·0 indicates where all the points would lie if estimates of portion size were completely accurate; ratios less than 1 indicate underestimation and those more than 1 indicate overestimation. Values are geometric means, with vertical bars representing ± 2 standard deviations. Model, food models; Photo, food photographs; IPSAS, interactive portion size assessment system.
Both accuracy and precision improved with age for all methods for estimates of amounts of food served and consumed (Figs. 6 (a) and 6 (b)). There was a consistent tendency for children of all ages to over-report using the food models. Accuracy of estimates of food portion size using the IPSAS and photographs were better than estimates using the food models for children of all ages.
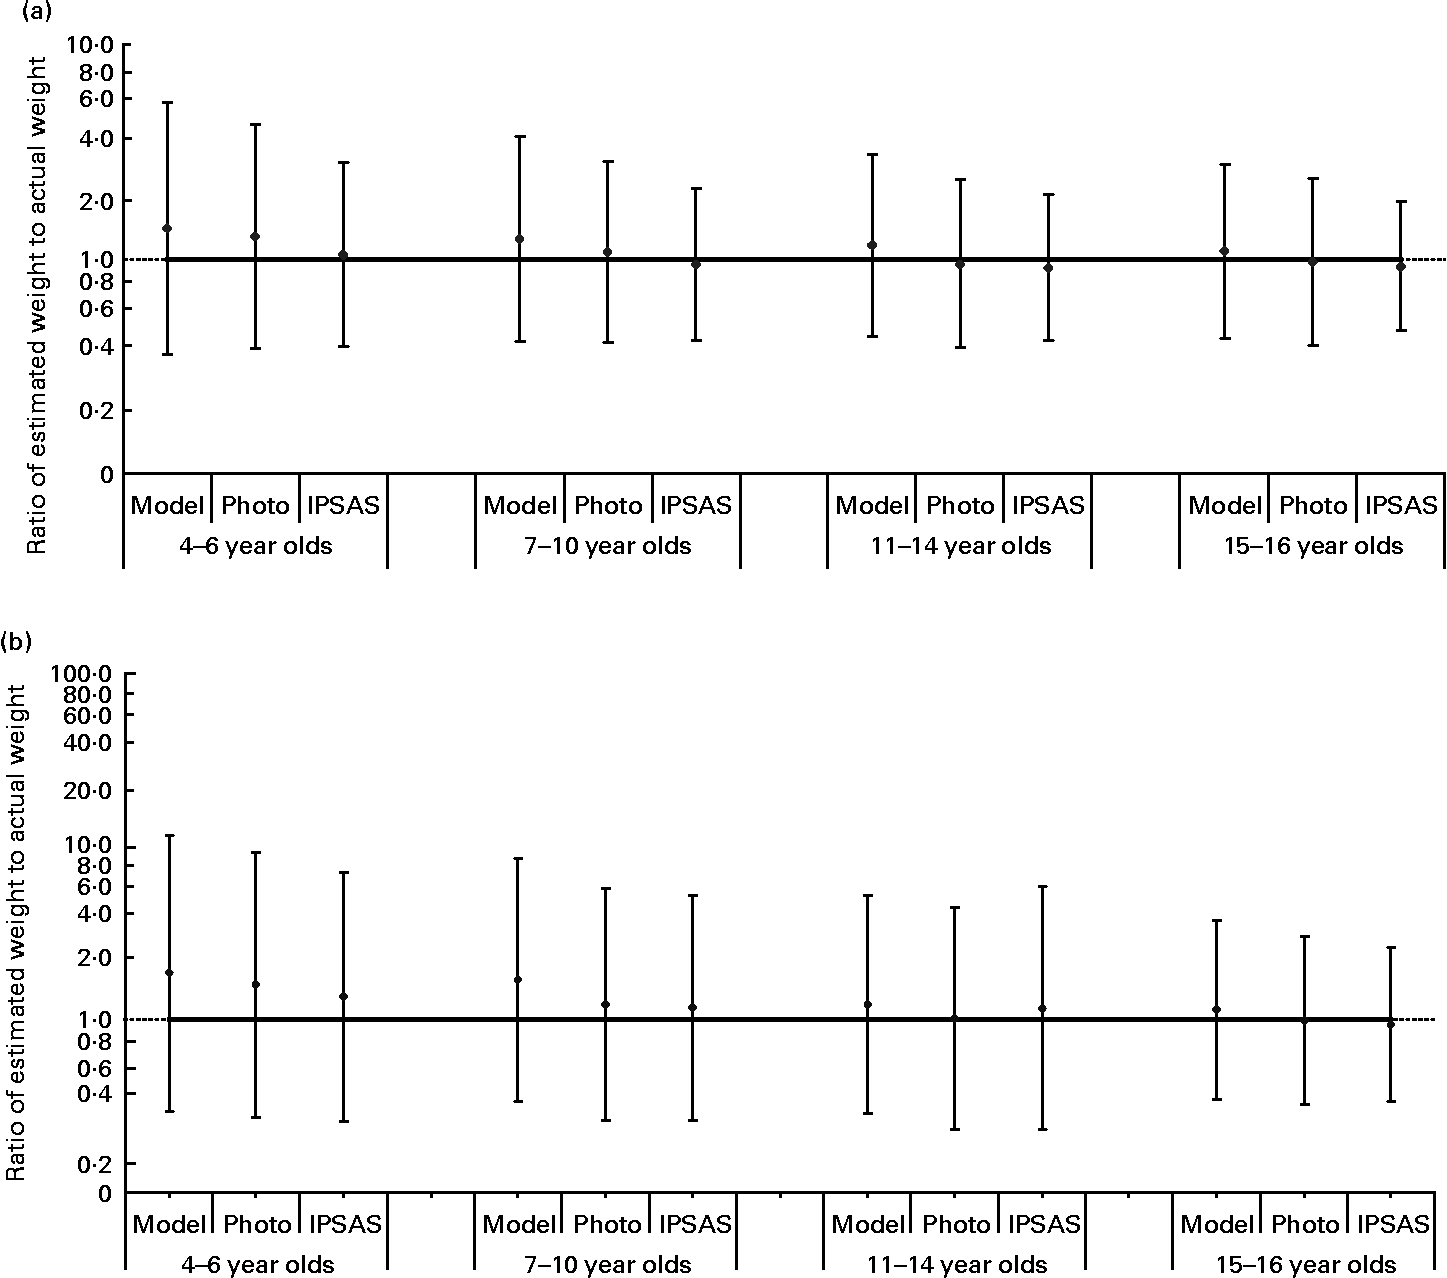
Fig. 6 Accuracy of children's estimates of food portion size (a) as served and (b) as consumed using each portion size assessment tool. All foods have been combined and are presented by age group. The line at 1·0 indicates where all the points would lie if estimates of portion size were completely accurate; ratios less than 1 indicate underestimation and those more than 1 indicate overestimation. Values are geometric means, with vertical bars representing ± 2 standard deviations. Model, food models; Photo, food photographs; IPSAS, interactive portion size assessment system.
Utility for measuring nutrient intake
When used in dietary assessment the errors in portion size estimation using each of the tools will be translated into errors in estimated nutrient intakes. As the performance of each tool varied by food, errors in estimation will have differential effects on different nutrients. To assess the potential impact of children's errors in portion size estimation on reported nutrient content, the children's estimates using each of the three tools were converted into estimates of energy (kJ), carbohydrate, fat, protein, vitamin C, Fe and Ca content of the menu 1 foods both as served, and as consumed.
Tables 4 and 5 show the percentage error in estimates of the nutrient content based on children's reports of portion size consumed and left over for the menu 1 foods both served (Table 4) and as consumed (Table 5) for all ages combined and by age group. These data along with the precision of the estimates are represented graphically in Figs. 7 (a) and 7 (b). For estimates of amount served made using the IPSAS, percentage errors ranged from 1·3 % for carbohydrate to 26·8 % for Ca for the 4 to 6 year olds and from − 0·7 % for fat to 17·7 % for Fe for the 7 to 10 year olds. In the older age groups, percentage errors for the IPSAS ranged from − 2·2 % for Ca to − 19·0 % for Fe for the 11 to 14 year olds and from − 5·5 % for protein to − 21·5 % for Fe for the 15 to 16 year olds. Percentage errors for the food photographs ranged from − 3·7 % for protein to − 21·0 % for vitamin C for the 11 to 14 year olds and from 4·0 % for energy to 39·8 % for Ca for the 15 to 16 year olds. Estimates of the amount of food served were closest to actual nutrient value twenty-two times using the IPSAS, ten times using photographs and four times using the models (Table 4).
Table 4 Percentage error in children's estimates of nutrient content of the menu 1 foods served
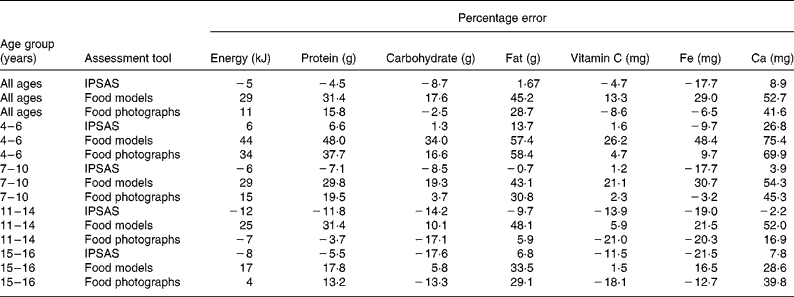
IPSAS, interactive portion size assessment system.
Table 5 Percentage error in children's estimates of nutrient content of the menu 1 foods consumed
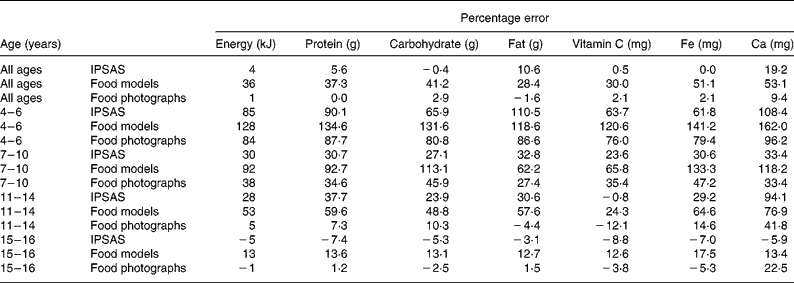
IPSAS, interactive portion size assessment system.
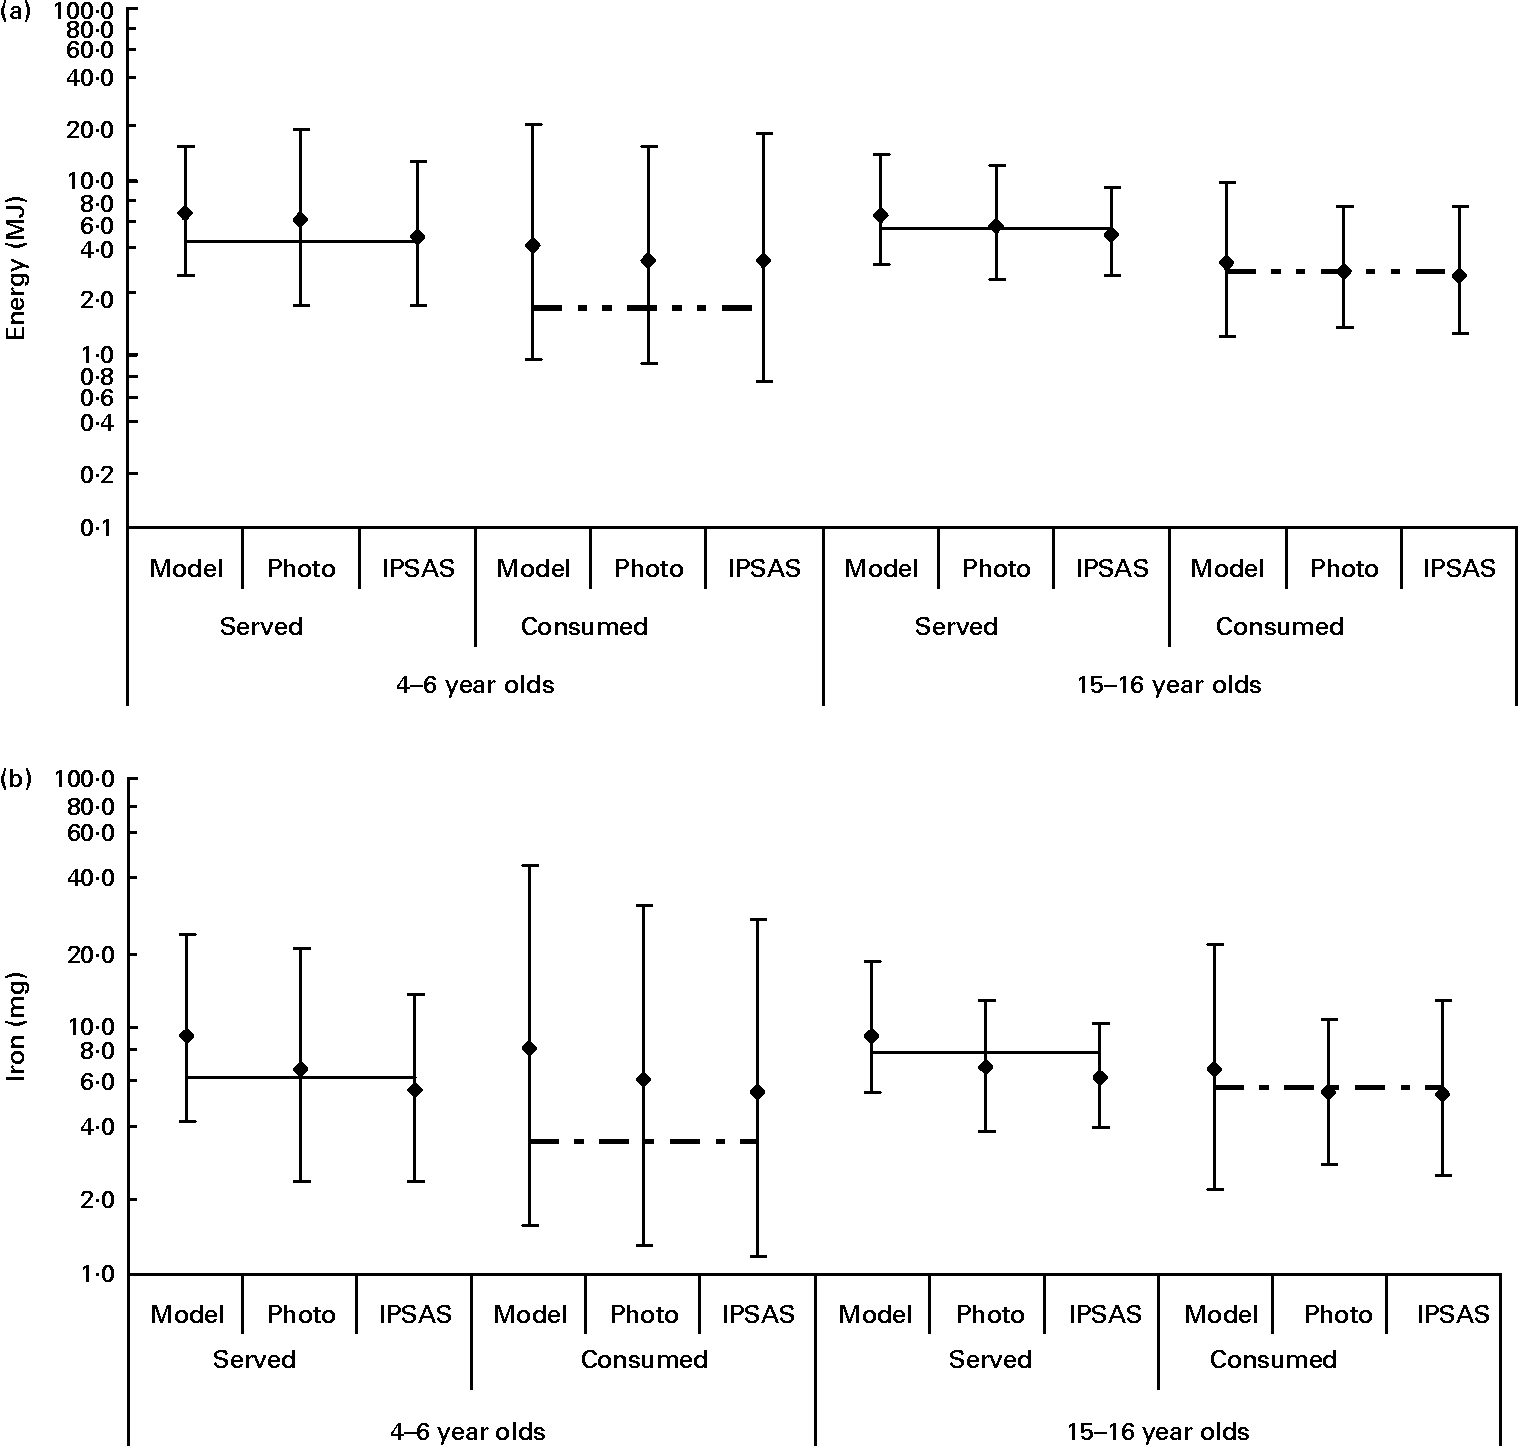
Fig. 7 Impact of errors in portion size assessment on the estimated energy content (a) and estimated Fe content (b) of menu 1 foods for 4–6 and 15–16-year-old children. Values are geometric means, with vertical bars representing ± 2 standard deviations. Model, food models; Photo, food photographs; IPSAS, interactive portion size assessment system; (–), actual served; (![]() ), actual consumed.
), actual consumed.
For the younger children percentage errors in estimating the amount of nutrients eaten were much higher than estimates of the amount served. Percentage errors for estimates made by the 4 to 6 year olds ranged from 61·8 % for estimates of Fe intake using the IPSAS to 162 % for estimates of Ca intake using the food models. For children aged 11 years and older, the percentage error in nutrient content based on estimates using the food photographs was lower, ranging from − 4·4 % for fat to 41·8 % for Ca for the 11 to 14 year olds and from − 1 % for energy to 22·5 % for Ca for the 15 to 16 year olds. The IPSAS gave the estimate closest to actual nutrient value on fourteen occasions, photographs on twenty-two occasions and models on zero occasions (Table 5).
Discussion
The present study was intensive from the subjects' point of view, requiring children not only to attend interviews to estimate the amount of foods they had been served and left over but also to attend meals served by us in place of their normal school meals. The overall recruitment rate of 21 % was very low. The recruitment rate for the younger children was about 43 %; similar to rates achieved in the NDNS studies. However, recruitment of the older children (particularly those aged 15–16 years) proved very difficult, significantly reducing the overall consent rate. The low recruitment rate is likely to have resulted in a biased sample in that those children and parents with an interest in food were more likely to take part. An incentive for completion of the study was offered to try to combat this. The study was assessing children's cognitive ability related to portion size estimation and this is unlikely to be correlated with interest in food. Recruitment was through schools with a high proportion of children eligible for free school meals; however, the socio-economic status of individual children was not assessed. There seems to be little evidence for any correlation between socio-economic status and basic pattern visionReference Farah, Shera, Savage, Betancourt, Giannetta, Brodsky, Malmud and Hurt21 and hence we would expect no differences in size perception.
The present study has established that children are able to use portion size assessment tools to estimate portion size. This includes children as young as 4–6 years, although precision and accuracy of estimates improved with age using all three tools. The use of portion size assessment tools may be a viable alternative to weighed intakes with young children.
The increase in the accuracy of estimates between the ages of 7–11 and 11–14 years are in line with theories on size perception. Perceptual abilities that would be expected to increase a subject's accuracy in estimating portion size include conservation. Conservation is the ability to recognise that a size or quantity remains the same when the appearance of the object changesReference Goswami22. The ability to conserve develops at about 7 years of age. A specific example of how this relates to portion size estimation is that children younger than 6 or 7 years of age will usually say that a tall thin container holds more liquid than a short broad container when both containers actually hold the same amount.
The fact that the errors in portion size estimation differed with type of food would be expected to result in the balance of nutrients being different rather than all nutrients being under- or overestimated to the same extent. Using estimates of amounts of food served, the percentage error in nutrient content was low using the IPSAS for even the 4–6-year-old age group. The accuracy of estimates of foods served made by the 4–6 year olds using the IPSAS compare favourably with the accuracy of estimates made by adults using food photographsReference Nelson, Atkinson and Darbyshire13. Mean percentage errors were 6 and 7 % for energy, 13·7 and 25 % for fat, 1·6 and 21 % for vitamin C, − 9·7 and 0·3 % for Fe and 26·8 and 7·7 % for Ca for 4–6 year olds and adults respectively.
When the nutrient content of the menu 1 foods based on the estimates of the amount of food eaten was analysed the percentage errors in the younger age groups (where a large proportion of the foods served were left over) were very high. This implies that whilst even very young children may be capable of estimating the amount of food served there are other issues relating to reporting of foods left over which impact on estimates of the amount of foods actually consumed. Young children, for example, may feel under pressure to eat all of the foods served to them and may report having consumed the full portion served when they actually left some. Warren et al. Reference Warren, Henry, Livingstone, Lightowler, Bradshaw and Perwaiz23 also found leftovers were not readily reported by young children (5–7 years old)Reference Warren, Henry, Livingstone, Lightowler, Bradshaw and Perwaiz23. Approximately 76 % of the children failed to report foods left over and a further 10 % gave an incomplete report of left-over food. The impact of errors in reporting of leftovers will vary depending on the size of portion served compared with the amount consumed.
Given that the proportion of food left over by the children in the present study was 26·3 (range 3·7–49·1) % in assessing dietary intake it is important to assess the portion size of foods actually consumed rather than those served. Any tool developed for assessing portion size with children must include portion sizes suitable for estimation of leftovers. The nutritional consequences of the errors in portion size estimation as eaten have been examined and found to be important. The photographs and IPSAS performed better than the models in estimating the amount of nutrients eaten.
Although the accuracy of the IPSAS and food photographs was generally good, the precision of estimates made using these tools was poor. These tools would therefore be useful in assessing the nutrient intakes of groups but would be less useful for measuring individual consumption.
The estimates of Ca intake based on portion size estimates of menu 1 foods both served and consumed using all three tools had a greater percentage error than those of other nutrients in all but the oldest age group. This is likely to be due to the way in which the two foods with a high Ca content included in the present study were presented. The milk was served over cereal, which made estimation of the amount of milk alone a very complex cognitive task. The cheese was served in a cheese sandwich and therefore was hidden from direct observation, making estimation of the amount of cheese extremely difficult. This problem arises from the way the food is prepared and consumed rather than the method of estimation. Indeed, even with weighed records of food intake, fillings of pre-packed sandwiches pose a problem. As a consequence the portion sizes of some foods (for example, sandwich filling and milk on cereal) can be estimated with different degrees of accuracy, which may result in differential errors across nutrients. With weighed food intakes, although more accurate data on the amounts of food consumed can be collected, individuals may change what they eat to facilitate recording. Assessment of portion size, using tools such as food photographs or the IPSAS, although yielding a less accurate report of the amount of food consumed, may provide a better estimate of habitual intake.
The tools were tested in an artificial situation where children were provided with foods of known quantities. All children attending a particular meal were served the same foods and exactly the same quantities. Following the first interview children were aware that they were going to be asked about the quantities of food that they had been served and had consumed. It was noticeable in the older children that more attention was paid to the amounts of foods served to them as the study progressed. The time scale over which the children were tested was also short (24 h). It can be predicted that the accuracy of portion size estimates will reduce as the time between consuming the food and estimating its portion size increases. Further work examining the accuracy of children's estimates of portion size where the time delay is longer are desirable if the portion size assessment tools are to be used with, for example, a 3 d food diary.
Although only a limited range of foods (n 22) was tested, the tools would be appropriate for use in estimating the portion size consumed for approximately 67 % of the total weight of the food and drink consumed by children during the NDNS of children aged 4–16 yearsReference Gregory and Lowe5.
Conclusion
The least accurate and precise of the three methods were the food models with all age groups; percentage errors for estimates made using this tool were high. The food models, being three dimensional, are fundamentally different from the IPSAS and food photographs which are two-dimensional representations. The IPSAS and the child-specific food photographs showed potential for use in dietary assessment with children, given that adult food photographs have been found to be inappropriateReference Foster, Matthews, Nelson, Harris and Adamson17. The IPSAS has the added potential that data collection may be automated, speeding up data processing. The anonymity of this may potentially lead to more honest reports of intake, as has been seen in the field of alcohol researchReference Waterton and Duffy24. There is potential for this to be developed into a website-based system that would be accessible in schools regardless of the platform (personal computers or Apple Mackintoshes used in a school). Equally, a system developed for the web could be made available on a compact disc for use on a stand-alone personal computer. The food photographs were only slightly less accurate than the IPSAS and may be more usable in the field.
Since, from a nutritional point of view, it is the amount of food consumed that is of importance, further work should focus on issues relating to reporting of leftovers in order to improve the accuracy of reports and estimation of foods actually consumed.
To test the validity of the tools further they would need to be extended to cover a wider range of foods and to be tested in a ‘real-life’ situation against actual food intakes. Further work to develop the IPSAS and the child-specific food photographs is due to commence in 2007.
Acknowledgements
The authors gratefully acknowledge that this research was commissioned by the Food Standards Agency (project number N08019). Special thanks to the Newcastle schools, teachers, parents and children who participated in the study.


