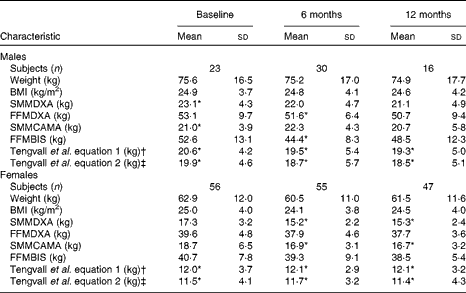
An error was made in calculating the Tengvall et al. equation in this paper( Reference Villani, Miller and Cameron 1 ). Tables 1 and 2 should read as follows:
Table 1 Anthropometric characteristics at baseline, 6 and 12 months after hip fracture in male and female participants (Mean values and standard deviations)

SMM, skeletal muscle mass; DXA, dual-energy X-ray absorptiometry; FFM, fat free mass; CAMA, corrected arm muscle area; BIS, bioelectrical impedance spectroscopy.
* Significant differences in the mean values for SMM and FFM between field methods, predictive equations and DXA assessed by paired t test (P< 0·05).
† Tengvall et al. equation 1 includes body weight as a predictor of SMM in the regression model.
‡ Tengvall et al. equation 2 excludes body weight as a predictor of SMM in the regression model.
Table 2 Correlations and 95 % limits of agreement (LOA) between dual energy X-ray absorptiometry (DXA), a reference technique, and field methods for the assessment of fat-free mass (FFM) and skeletal muscle mass (SMM) at baseline, 6 and 12 months post hip fracture

BIS, bioelectrical impedance spectroscopy; CAMA, corrected arm muscle area.
* Significant proportional bias (P< 0·05).
† Association between body composition field methods, predictive equations and DXA assessed by Spearman correlation analyses (P< 0·05).
‡ Mean bias between body composition field methods, predictive equations and DXA assessed by paired t test.
§ 95 % LOA indicates the mean difference between body composition field methods, predictive equations and DXA ± 1·96.
∥ Proportional bias in the mean difference between body composition field methods, predictive equations and DXA assessed by linear regression analyses.
¶ Study sample size at each assessment time point: baseline, n 79; 6 months, n 75; 12 months, n 63.
†† Tengvall et al. equation 1 includes body weight as a predictor of SMM in the regression model.
‡‡ Tengvall et al. equation 2 excludes body weight as a predictor of SMM in the regression model.
Under Measures of Agreement in Results:
‘Estimates of SMM from both predictive equations also overestimated SMM from DXA at each assessment time point (equation 1: baseline, 15·1 kg; 6M, 17·1 kg; 12M, 17·5 kg; equation 2: baseline, 12·6 kg; 6M, 14·4 kg; 12M, 14·8 kg) (Table 2). Significant changes were observed in the mean bias across each assessment time point for both predictive equations (equation 1: P= 0·002; equation 2: P= 0·001). Significant proportional bias was observed at baseline between SMMDEXA and predictive equation 1 (β = 0·311; P= 0·05) and at 6M between SMMDEXA and prediction equation 2 (β = 0·266; P= 0·05)’.
Should read
‘Estimates of SMM from both predictive equations underestimated SMM derived from DXA at each assessment time point (equation 1: baseline, − 4·6 kg (95 % LOA: − 10·5, 1·3); 6M, − 2·9 kg (95 % LOA: − 10·5, 4·7); 12M, − 2·5 kg (95 % LOA: − 7·6, 2·6); equation 2: baseline, − 5·3 kg (95 % LOA: − 12·0, 1·4); 6M, − 3·3 kg (95 % LOA: − 11·1, 4·5); 12M, − 3·2 kg (95 % LOA: − 9·9, 3·5)) (Table 2). No significant changes were observed in the mean bias between SMMDEXA and both predictive equations across each assessment time point (equation 1: P= 0·202; equation 2: P= 0·265). Significant proportional bias however was observed at baseline, 6M and 12M between SMMDEXA and both predictive equations (equation 1: baseline, β = − 0·404; P< 0·001; 6M, β = − 0·202; P= 0·02; 12M, β = − 0·316; P= 0·004; equation 2: baseline, β = − 0·449; P< 0·001; 6M, β = − 0·188; P= 0·02; 12M, − 0·334; P= 0·003) (Table 2)’.
Under Discussion
‘Previously established predictive equations overestimated SMM in our sample. The mean bias increased from baseline at 6 and 12 months for both predictive equations and the 95 % LOA were wide’.
Should read
‘Previously established predictive equations underestimated SMM at each assessment time point in this sample of hip fracture patients. In comparison with the two portable methods of body composition assessment used in the present study, the mean bias was greater with the LOA being equally as unacceptable.’


