Introduction
The extreme reduction of native forest cover worldwide is a current cause of concern (Collar et al. Reference Collar, Crosby and Stattersfield1994, Sodhi et al. Reference Sodhi, Posa, Lee and Warkentin2008). Declines in native forest cover have been observed in South-East Asia. In Vietnam, these declines have been largely attributed to the expansion of agriculture, logging, and the transformation of natural forest into plantations. These declines have led to the local extinction of many bird populations (Sodhi and Brook Reference Sodhi and Brook2006). In the forests of northern Vietnam there are probably 46 species listed as threatened on the IUCN Red List (Lepage Reference Lepage2010). Recently, overall forest cover in Vietnam has increased, but most of the increase has been attributed to plantations of non-native trees, and natural forests are still being reduced and replaced by other land uses (Nhat Reference Nhat2001). Pines Pinus spp. are widely used as plantation species in Vietnam. The purpose of these pine plantations is to increase overall vegetation cover for wood and for turpentine production.
The conservation value of these plantations for birds is unknown, but few native forest bird species are assumed to persist in other land uses (Hughes et al. Reference Hughes, Daily and Ehrlich2002). Bird species diversity has been found to be lower in some tree plantations relative to native forest types (Cockle et al. Reference Cockle, Leonard and Bodrati2005, Barlow et al. Reference Barlow, Mestre, Gardner and Carlos2007, Rotenberg Reference Rotenberg2007, Holbech Reference Holbech2009). For tree plantations, this may be due to low structural complexity because of uniform age and physiognomy of plantation trees and a poorly developed understorey, which may lead to lower abundance of food items and fewer opportunities for concealment for native birds (Kwok and Corlett Reference Kwok and Corlett2000). In general, bird species diversity is reported to be positively correlated with vegetation structure and composition (MacArthur and MacArthur Reference MacArthur and MacArthur1961, Wiens Reference Wiens1992). Recent evidence suggests that some land uses, such as tree plantations, have potential for conservation of native forest bird species, especially when management practices diversify forest vegetation and composition (Reitsma et al. Reference Reitsma, Parrish and McLarney2001, Beukema et al. Reference Beukema, Danielsen, Vincent, Hardiwinoto and van Andel2007).
Managing industrial forests in Vietnam for the dual purposes of wood products and conservation is of wide national interest. Measures outlined in the recently proposed plan “Five Million Hectares of Forest” (Vietnam Government 1998) would increase the forest cover nationwide in Vietnam from 33% to 43% by planting non-native trees. The overall benefits of this plan will be enhanced if conservation values can be balanced with economic concerns. Our objective was to examine the avian conservation potential of pine plantations compared to other native vegetation types, including second-growth forests and mature forests. Specifically, we tested several predictions relating to patterns in the number of bird species (i.e. species richness) with forest type. We examined predictions concerning forest specialist and forest generalist species guilds. Forest specialists are bird species that are assumed to be intolerant of forest disturbance. Forest generalists are bird species that inhabit all forest types and are assumed to be more tolerant of forest disturbance. Mature native forests have very complex vegetation composition and structure, and are hypothesised to support a larger number of bird species, especially forest specialists, than plantation forests. Therefore, we predicted that species richness of forest specialists will be higher in mature forest than the other two vegetation types and that forest generalist species will be equally rich in mature forests, second-growth forests, and pine plantations. Additionally, we predicted that total species richness will be highest in mature forests and lower in second-growth forests and pine plantations. One problem with estimating species richness is that strong heterogeneity in detection of species can bias richness estimates (Boulinier et al. Reference Boulinier, Nichols, Sauer, Hines and Pollock1998). To address this problem we used model developments by Huggins (Reference Huggins1991) and Pledger (Reference Pledger2000).
Methods
Study area
The study area was in Tam Dao National Park (TDNP), Vietnam (21°21’–21°42’N, 105°23’–105°44’E). The main part of TDNP is in the Tam Dao mountain range with the highest peak reaching 1,590 m. The park is 10–15 km wide, 80 km long, and located in three provinces: Thai Nguyen, Tuyen Quang, Vinh Phuc. The park centre is 70 km north-west of the capital, Hanoi.
The climate in TDNP is tropical with two distinct seasons caused by monsoon winds. The hot and rainy season is from May to November, the cold and dry season is from December through April. Average year-round temperature is 23.3°C, with a minimum of 1.8°C and maximum of 41.5°C. The park receives ∼160 cm of precipitation annually and relative humidity averages 82%.
TDNP supports at least 1,282 plant species and a large number of animal species, including at least 280 birds, many of which are rare or endangered (Tam Dao National Park 2005). The study area was located on the south-west slope of the Tam Dao range. Sampled forest areas ranged from 200 to 600 m in elevation. The native vegetation in this area can be divided into two types, mature forest and second-growth forest. Mature forest may have had some selective logging in the past, but the forest remains intact with three canopy layers, and with a top canopy height of 30–40 m. Second-growth forest results from intense logging and wood gathering. Small trees comprise second-growth forest vegetation, with forest height usually less than 10 m. The Tam Dao area also contains about 1,500 ha of horsetail pine Pinus massoniana plantation, an introduced species. The pine plantations were primarily planted in one main plantation (1,500 ha) with some smaller fragments. The pine plantation is about 30–50 years old.
Avian sampling
Birds were surveyed in the three forest types: mature forest, second-growth forest, and pine plantation. Sampling effort, both in terms of person-hours and area sampled, was approximately the same in all three forest types to reduce the effects of an area-species richness relationship and to reduce the effects of sampling variability on comparisons of species richness among vegetation types.
All possible 500 m transects were designated on a map of the study area. Transects were chosen to be at least 75 m away from any forest edge to minimise any edge effect. Transects were also separated by at least 100 m to ensure independence among transects. From a random start point, 12 transects were systematically selected in each vegetation type.
Each transect was surveyed six times from June to August 2006. Surveys were carried out under favourable weather conditions. Surveys were conducted from sunrise to noon. Observers walked transects at a constant speed of ∼ 0.5 km/40 minutes. While walking transects, observers recorded the species of all birds heard and/or seen except for birds flying overhead which were not recorded. Bird species were classified into two categories, forest specialist or forest generalist, following Cu et al. (Reference Cu, Trai and Phillipps2000) and Robson (Reference Robson2005).
Data analysis
Many species richness estimators have been developed, almost all of which are preferable to conventional “observed number of species” (Walther and Morand Reference Walther and Morand1998, Walther and Moore Reference Walther and Moore2005). Considerable emphasis has been placed on the use of jackknife estimators (Burnham and Overton Reference Burnham and Overton1978) and Chao estimators (Chao Reference Chao1984, Reference Chao1987). However, the jackknife and Chao estimators are not based on a maximum-likelihood framework (Walther and Moore Reference Walther and Moore2005); therefore, robust model selection and model uncertainty measurements, including model averaging (Burnham and Anderson Reference Burnham and Anderson2002), cannot be utilised. In addition, these estimators do not allow the modelling of individual covariates. Individual covariates such as relative abundance, singing propensity, or visual appearance may be expected to explain much of the individual heterogeneity in the detection probability of individual species. More recently, the Huggins estimator (Huggins Reference Huggins1991) has been developed to include individual covariates into the modelling of detection using maximum likelihood theory, but has not been used often in species richness applications (Brand et al. Reference Brand, White and Noon2008). Additionally, Pledger (Reference Pledger2000) developed a model that partitions individuals into finite groups (or mixtures) of relatively homogeneous capture probabilities. This model has been used in closed capture-recapture abundance studies (Williams et al. Reference Williams, Nichols and Conroy2002), but rarely in species richness applications (e.g. Brand et al. Reference Brand, White and Noon2008, Johnson et al. Reference Johnson, Applegate, Hoover, Gipson and Sandercock2009). Heterogeneity in capture (or detection) probability is believed to be more important at a community level (e.g. species-richness; Nichols et al. Reference Nichols, Boulinier, Hines, Pollock and Sauer1998) than at a population level (e.g. abundance) and the heterogeneity in detection probably cannot be explained fully by individual covariates. Because of these advantages of the Huggins and Pledger models, we used an estimator that combines these two models to estimate the number of bird species.
We estimated numbers of forest specialist and forest generalist species in the program MARK (White and Burnham Reference White and Burnham1999). Data from the 12 transects from one survey period were pooled within vegetation type and survey period and treated as a single sampling occasion (for a total of six sampling occasions within each vegetation type). An encounter history was constructed for each bird species detected during the surveys. Due to sparseness of data and preliminary modelling, two mixtures were used for modelling detection probability with a common probability of inclusion in each mixture across habitat types. Pledger (Reference Pledger2000) suggests that using two mixtures is enough to substantially correct for heterogeneity-induced bias in estimation of population size (or in our case, species richness).
Regional commonness index, singing propensity and body length were used as covariates to test predictions concerning detection probabilities. Information used to develop the regional commonness index of each species and information on the body length was inferred from previous avian surveys conducted in TDNP in 2005 (Davidson et al. Reference Davidson, Hung, Trai and Tuong2005) and from Cu et al. (Reference Cu, Trai and Phillipps2000) and Robson (Reference Robson2005). Singing propensity was used as an indicator variable in which bird species that can be recognized easily by their typical songs and that sing often (covariate value of 1) were compared with species that are not as easy to detect by song (covariate value of 0). Relationships among body length, singing propensity, and detection probability were assumed to be linear. We thought the regional commonness index might have a quadratic, rather than a linear, relationship with detection probability because the detection probability does not depend much on abundance if abundance is high.
The importance of these covariates in modelling detection probabilities, as well as vegetation types, was examined using model rankings (∆AICc), AICc weights (wi), and cumulative AICc weights (Σwi) (Burnham and Anderson Reference Burnham and Anderson2002). Cumulative AICc weight for a given covariate is the sum of the AICc weights of all models that contain that covariate. The main candidate models were: (1) equal detection probabilities (p) in the three vegetation types (PMF=SG=PP), where MF = mature forest, SG = second-growth forest, and PP = pine plantation), (2) equal detection probabilities in mature forests and second-growth, with pine plantations being different (PMF=SG#PP); (3) equal detection probabilities in second-growth forest and pine plantations, with mature forest being different (PMF#SG=PP); and (4) different detection probabilities for each of the three vegetation types (PMF#SG#PP). In addition to vegetation types, we also modelled detection probabilities as a function of survey occasion (t) as an additive (+) and interactive (*) effect. For each of these models we also added covariate effects of observer, singing propensity, body length, and regional commonness index separately or in combination. Models were constructed to estimate number of forest specialist species and number of forest generalist species separately. Parameters of interest were model-averaged across the entire model set. Overall species richness was then estimated by summing the number of forest specialist and forest generalist species and the variance of this estimate was calculated using the Delta method (Powell 2007).
Results
Raw data
Observers recorded 3,648 individual birds and detected 71, 60, and 45 avian species in mature forest, second-growth forest, and pine plantations, respectively. Out of 98 species detected, 49 were classified as forest specialists and 49 as generalists, with 46, 24, and 14 forest specialist species detected in mature forest, second-growth forest, and pine plantation, respectively and 25, 36, and 31 forest generalist species detected in mature forest, second-growth forest, and pine plantation, respectively. These species belonged to eight orders and 21 families. The families Sylviidae, Corvidae, Pycnonotidae, and Nectariniidae were most frequently observed. The most frequently observed species were: Common Tailorbird Orthotomus sutorius, Puff-throated Bulbul Alophoixus pallidus, Red-whiskered Bulbul Pycnonotus jocosus, Grey-cheeked Fulvetta Alcippe morrisonia, Striped Tit-babbler Macronous gularis, Buff-breasted Babbler Pellorneum tickelli, and Puff-throated Babbler Pellorneum ruficeps. For the full list of species detected see Vu (Reference Vu2009).
Forest specialist species
Models for forest specialist species in which detection varied by vegetation type had strong explanatory ability, with effects of vegetation type included in all models with wi > 0.01 (Table 1). Models that included the effect of vegetation type were always selected over models that did not include this effect. Detection probability for forest specialist species was highest in mature forest, lower in second-growth forest, and least in pine plantation (Figure 1a). Models with time-varying detection probability did not have much explanatory value (Table 1). All models containing temporal effects had ∆AICc > 5.00 and AICc weight (wi) < 0.01. Detection probabilities in two mixtures were substantially different (Figure 1a) indicating that 31% of species (95% CI = 18%, 47%) were highly detectable and the rest had low detection probabilities.
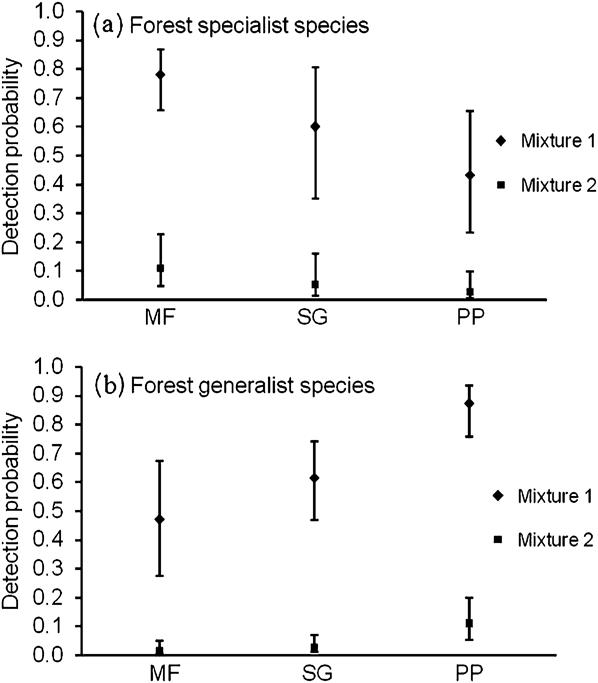
Figure 1. Model-averaged detection probability (with 95% confidence intervals) for the first occasion in the analysis of specialist (a) and generalist (b) species in different vegetation types (MF = mature forest, SG = second-growth forest, and PP = pine plantation). Species with high detection probabilities were categorized in mixture 1 and species with low detection probabilities were categorized in mixture 2.
Table 1. Model selection results for models describing detection probabilities in three habitats (MF = mature forest, SG = Secondary growth forest, and PP = Pine plantation), with observer (ob), regional commonness (co), singing propensity (si) and body length (bo) effects for forest specialist species with AICc weights ≥ 0.01.
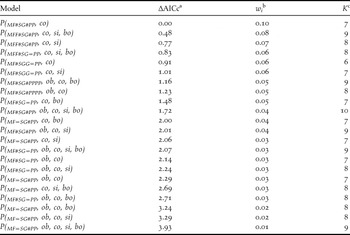
a The scaled (minimum AIC = 582.89), small-sample size adjusted Akaike information criterion.
b The AICc model weight.
c The number of parameters in each model.
Regional commonness index (Σwi = 1.00) had the most influence on detection probability, and consistently appeared in the top models (Table 1 and Figure 2a). Singing propensity (Σwi = 0.52, Figure 2a) and body length (Σwi = 0.45) had similar but weaker influence on detection probability. Models with wi > 0.01 consistently contained the regional commonness index and models using regional commonness index as a single individual covariate were always selected over models using singing propensity or body length as single individual covariates. Body length only occasionally appeared in the top models.
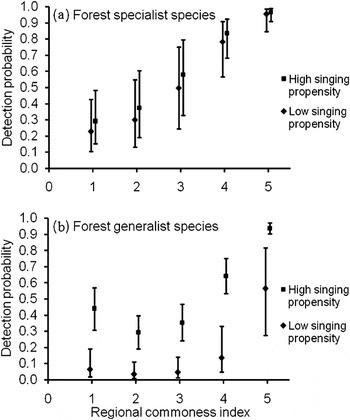
Figure 2. Model-averaged detection probability (with 95% confidence intervals) of species with high and low singing propensity and regional commonness index (1 to 5 with 1 being lowest) during the first occasion for the higher detection probability mixture in mature forest for the forest specialist species (a) and forest generalist species (b).
Based on model-averaged results, we estimated the number of forest specialist species to be highest in mature forest, lower in second-growth forest, and lowest in pine plantations (Figure 3). There was considerable uncertainty in these estimates.
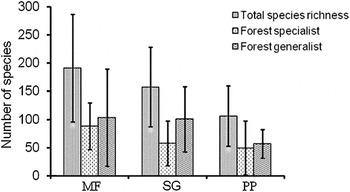
Figure 3. Model-averaged species richness estimates (with 95% confidence intervals) for different vegetation types (MF = mature forest, SG = second-growth forest, and PP = pine plantation).
Forest generalist species
Models in which detection varied by vegetation type had strong support; all top models with low ∆AICc values contained effects of vegetation type (Table 2). Models incorporating observer and/or vegetation type effects were always selected over models not incorporating these effects. Detection probability was highest in pine plantation, lower in second-growth forest, and lowest in mature forest (Figure 1b). Models with time-varying detection probability did not have much explanatory value. All models containing temporal effects had ∆AICc > 6.00 and AICc weight (wi) < 0.02 (Table 2). Detection probabilities in two mixtures were substantially different (Figure 1b) indicating that 26% of species (95% CI = 15%, 41%) were highly detectable and the rest had low detection probabilities.
All three covariates, regional commonness index (Σwi = 1.00), singing propensity (Σwi = 1.00), and body length (Σwi = 0.86) had explanatory ability as some top models included all three of these covariates. Regional commonness index was the best in explaining the variation in detection probability; all models with wi > 0.01 consistently contained regional commonness index (Table 2). Singing propensity consistently appeared in the top models and was the second best explanatory covariate (Table 2 and Figure 2b). Body length had weaker influence on detection probabilities than regional commonness index and singing propensity, and was included less frequently in the top models.
Table 2. Model selection results for models describing detection probabilities in three habitats (MF = mature forest, SG = Secondary growth forest, and PP = Pine plantation), with observer (ob), regional commonness (co), singing propensity (si) and body length (bo) effects for generalist species with AICc weights ≥ 0.01.
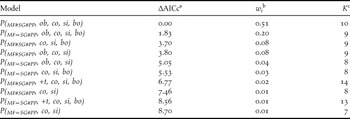
a The scaled (minimum AIC = 582.89), small-sample size adjusted Akaike information criterion.
b The AICc model weight.
c The number of parameters in each model.
Based on model-averaged results, we estimated number of forest generalist species to be highest in mature forest, lower in second-growth forest and in pine plantation (Figure 3). There was also considerable uncertainty in these estimates.
Total species richness
Using estimates of number of forest specialist and generalist species, we estimated species richness to be highest in mature forest, lower in second-growth forest, and lowest in the pine plantation (Figure 3).
Discussion
Detection probability
Many species richness estimators that incorporate heterogeneity in detection probabilities have been developed and the jackknife (Burnham and Overton Reference Burnham and Overton1978) and Chao estimators (Chao Reference Chao1984, Reference Chao1987) have received a good deal of attention. However, these estimators do not allow the modelling of individual covariates, and are not based on a maximum-likelihood framework that allows the use of modern model selection criteria (e.g. AIC). Recently, the development of the Huggins (Huggins Reference Huggins1991) and Pledger (Reference Pledger2000) estimators have allowed for more flexibility in modelling detection probability by modelling heterogeneity in detection probabilities among individual species by incorporating individual covariates and partitioning individuals into groups (or mixtures) of relatively homogeneous capture probabilities. By adequately modelling the detection probability, the richness estimate will be more precise than that of former estimators.
In our analyses, using a combined Huggins-Pledger approach, a two-point mixture model described detection probabilities well and the estimates for the two mixtures were substantially different. Models without mixtures were also run in a pre-analysis and had much higher AICc values suggesting that models incorporating mixtures would better describe bird detection probabilities. Species varied greatly in their detection probabilities and, although the covariates modelled some of this heterogeneity, the mixture structure was also needed to model heterogeneity not accounted for by the covariates. Unmodelled heterogeneity in detection could have been influenced by other factors (e.g. colour, behaviour) and the Pledger model was useful in describing this unmodelled heterogeneity; 26–31% of species were categorised as having a relatively high detection probability, while the rest had low detection probabilities. Although some top models contained observer effects, upon further inspection the differences between the observers were minimal.
Regional commonness index had a large influence on detection probabilities (Σwi = 1 in both analyses). The probability of detecting a species often increases with increased abundance of individuals (Royle and Nichols Reference Royle and Nichols2003) and our regional commonness index and the combination of linear and quadratic terms of regional commonness index probably captured this relationship well. Singing propensity had the second best explanatory ability. In the analysis of forest specialists, the effect of singing propensity (Σwi = 0.52) is much lower than in the analysis of forest generalists (Σwi = 1.00), possibly due to observers who were less familiar with the songs of forest specialist species than those of forest generalist species.
Body length had little explanatory ability. Visual cues are not the only way species are detected. Although species with large body size are generally more easily seen than small ones, most large species forage solitarily during the breeding season, thus making their detection lower than for small species that forage in flocks. These aspects probably made body length a poorer predictor of detection probability.
Detection probabilities varied strongly by vegetation type in the estimation of number of forest specialist and forest generalist species. This is partially due to detection probabilities being possibly influenced by relative abundance (sensu Royle and Nichols Reference Royle and Nichols2003). Forest specialist species may be more abundant in mature forest than in second-growth forest and pine plantations making the species detection probabilities in mature habitat higher than in other vegetation types (Figure 1a). In contrast, forest generalist species may be more abundant in second-growth forests and pine plantations than in mature forests. Therefore, in the analysis of forest generalists, detection probabilities in second-growth forests and pine plantations were higher than in mature forests (Figure 1b). Although forest generalist species may be more abundant in second-growth forest than in pine plantation, detection in pine plantation was still slightly higher than in second-growth forest. This higher detection probability in pine plantation was likely attributed to better visibility in this habitat. Detection probabilities also did not vary by time possibly because all surveys were conducted under similar conditions.
Our analytical methods have not often been used in estimating species richness (but see Brand et al. Reference Brand, White and Noon2008; Johnson et al. Reference Johnson, Applegate, Hoover, Gipson and Sandercock2009), but may be useful in other situations with high detection heterogeneity. For birds in northern Vietnam, we found that relative abundance and singing propensity can explain much of the variability in detection probabilities among individual species. For other taxa, however, other relevant individual covariates should also be considered. To improve the certainty of the estimates, repeated surveys should be designed to be as uniform as possible. Sampling occasions should occur in similar weather conditions, during similar times of the day and during a condensed time period so that there is minimal change in community structure and detection rates. This may allow for simpler models (i.e. fewer parameters) to be needed. Surveyors with similar field experience/training should also be utilised. The adequate number of survey occasions can be determined using simulations based on expected detection probabilities.
Species richness
Species richness was highest in mature forest, less in second-growth forest, and least in pine plantation although 95% confidence intervals overlapped for estimates in mature forest compared to second-growth forest and second-growth forest compared to pine plantation. The number of forest generalist species seems to be similar between mature forest and second-growth forest and lower in pine plantations. Our results are similar to those reported in several studies conducted within a variety of plantations (Greenberg et al. Reference Greenberg, Bichier, Angon and Reitsma1997, Raman and Sukumar Reference Raman and Sukumar2002, Cockle et al. Reference Cockle, Leonard and Bodrati2005, Barlow et al. Reference Barlow, Mestre, Gardner and Carlos2007, Rotenberg Reference Rotenberg2007). The number of forest specialist species was also highest in mature forest, less in second-growth, and least in pine plantations. Although some studies found similar total species richness in native forest and plantations, the number of forest specialist species was always higher in native forest (Kwok and Corlett Reference Kwok and Corlett2000, Reitsma et al. Reference Reitsma, Parrish and McLarney2001). Second-growth may have lower species richness due to lower overall canopy height and fewer canopy layers, and due to the history of logging, wood gathering, and cattle grazing. Pine plantations may have lower species richness due to the lack of tree species diversity and tree-age diversity. Because habitat structure complexity and diversity have been reported to be highly correlated with bird species richness (MacArthur and MacArthur Reference MacArthur and MacArthur1961, Wiens Reference Wiens1992), the lower tree diversity and complexity in plantations may directly lead to lower diversity of fructivorous, granivorous, and nectarivorous bird species there. Only 50% of the total species detected use pine canopy as foraging habitat, and no fructivorous species were detected in pine plantations in this study.
Cockle et al. (Reference Cockle, Leonard and Bodrati2005) found a similar result with the absence of forest understorey and forest floor bird species in plantations in Paraguay. The pine plantation understorey may be poorer than other vegetation types for many avian species because pine leaves contain oils that create a barrier on the forest floor, preventing seeds from reaching soils and inhibiting the regrowth and development of shrubs and native trees. The absence of fructivorous avian species, in turn, inhibits seed dispersal in pine plantations. The pine plantation canopy is also more permeable to light, causing the microclimate in the pine plantation understorey to be drier than that under mature forest and second-growth forest canopies. Besides low plant diversity, the drier habitat in pine plantation may make it an unfavourable environment to support a high abundance of invertebrates, especially arthropods, on the forest floor. In turn, this may reduce the overall insectivorous species and ground-feeding insectivores in pine plantations.
The availability of cavities and snags in second-growth may be less than in mature forest because second-growth does not have old and large stems. Pine plantations also lack cavities because of forest management practices. Therefore, the smaller overall species richness and fewer numbers of forest specialist species in second-growth and pine plantations may also be attributed to the reduction of cavity nesting and stem foraging species (Schwab et al. Reference Schwab, Simon and Sinclair2006, Tomasevic and Estades Reference Tomasevic and Estades2006). For example, seven woodpecker species were detected in mature forest, whereas only one species was detected in second-growth and two species were detected in pine plantation.
Based on species richness, avian conservation value is probably highest in mature and second-growth forests and least in pine plantations in northern Vietnam. Although pine plantations can support a number of species, most of these species are not forest specialists. Besides commercial plantations, exotic trees are also being planted in national parks and watersheds in mountainous areas to prevent soil erosion and floods and to manage water quality and quantity in reservoirs, streams, and rivers. Primarily, we recommend that where natural succession is practical, native forests should be preserved and natural regeneration promoted. Thinning practices should be implemented in existing pine plantations to create more openings for natural trees to regenerate and to develop undergrowth and to diversify the age structure of the forest. Determining optimal levels of thinning would be an important contribution. Forest enrichment with more native trees within pine plantations should also be considered. Other forest enrichment strategies such as providing nest boxes for cavity-nesting birds, or leaving snags, could be considered.
Acknowledgements
We thank the Tam Dao National Park and Forest Ranger Department, Ministry of Agriculture and Rural Development, Vietnam, for allowing us to conduct the research. We thank Dr. A. Franklin, Dr. J. Moore and an anonymous reviewer for critical reviews of the manuscript. We are grateful to many colleagues and students at various institutions in Vietnam. Finally, we thank the Rufford Small Grant Foundation, Columbus Zoo and Aquarium, IdeaWild, and Colorado State University who provided partial funding for our project.


