Introduction
During the winter months in Canada, public avalanche bulletins are prepared for regions ranging in size from about 100 km2 to >30 000 km2. Before venturing into avalanche terrain, many backcountry travellers read these bulletins and rely on the regional ratings as an estimate of avalanche danger for the area in which they plan to travel. Given the spatially variable nature of snowpack stability (e.g. Reference Schweizer, Kronholm and WiesingerSchweizer and others, 2003, Reference Schweizer, Kronholm, Jamieson and Birkeland2008a), however, a single danger rating cannot be expected to capture the actual avalanche danger at all locations; this is particularly true for large forecast regions. Other factors which may contribute to differences between the regional danger rating and the actual avalanche danger at a specific location include the following: limitations in data available to the forecasters preparing the regional bulletin, disparity between actual and forecast weather and snowpack conditions and, because regional bulletins are not always prepared daily, temporal changes in avalanche danger.
For recreationists, the avalanche danger for the area to be covered in a typical day of backcountry travel (estimated to be approximately 10 km2), or local avalanche danger, is more relevant than the danger rating for a large forecast region. Experienced backcountry travellers and avalanche practitioners may adjust their assessment of local avalanche danger (which may have originated with a regional bulletin rating) based on signs of instability, weather factors and snowpack conditions observed while travelling. Occasionally, detailed snow profile information and stability tests that require digging are also completed to supplement field observations. Even with a good understanding of factors that contribute to snowpack instability, experience is required to weigh these different pieces of information and come up with an accurate assessment of the local avalanche danger.
The intent of this study is to determine whether or not the results of a single stability test are useful in identifying areas where the local avalanche danger differs from the regional danger rating and, if so, to develop guidance to help recreationists with limited experience interpret stability test results. We consider recreationists with limited experience to be those who have travelled in backcountry avalanche areas less than approximately 20 days. A previous study by Reference Jamieson, Schweizer, Haegeli, Campbell and GleasonJamieson and others (2006), posed this question about the value of stability tests for recreationists as ’To dig or not to dig?’. This paper follows the approach taken by Reference Jamieson, Schweizer, Haegeli, Campbell and GleasonJamieson and others (2006) with an expanded dataset including two subsequent seasons of data. Additional data collected during the field component of this study have been used in a similar analysis to assess the effectiveness of local avalanche danger verification using various simple weather and snowpack observations that do not require digging (Reference Jamieson, Haegeli and SchweizerJamieson and others, 2009).
Although spatial variability in stability test results has been established (e.g. Reference Campbell and JamiesonCampbell and Jamieson, 2007; Reference Schweizer, Kronholm, Jamieson and BirkelandSchweizer and others, 2008a), studies have also shown that, with expert site selection, stability tests can be indicative of stability on adjacent slopes (e.g. Reference FöhnFöhn, 1987; Reference Schweizer and JamiesonSchweizer and Jamieson, 2007). We recognize that the ability to identify avalanche danger on the slope scale would be of even greater benefit to recreational backcountry travellers than the ability to identify an area where the local avalanche danger differs from the regional danger rating. However, the latter was deemed a more practical objective for this study for several reasons. First, many recreationists lack the knowledge and experience necessary to select sites relevant for slope scale stability assessment. Second, it is difficult for inexperienced recreationists to understand the different scales which contribute to spatial variability, and to combine this concept with the results of a single stability test result to make an accurate slope scale danger assessment. Third, although recreationists are often encouraged to undertake several quick stability tests (e.g. Reference TremperTremper, 2008, p.163) – ideally one representative of each slope on which they plan to travel – many only dig once a day, if at all. Completion of one stability test which requires digging for a single day of travel, however, seems a reasonable expectation if the information obtained can help recreationists improve their estimate of the local avalanche danger.
Methods and Dataset
Stability test results were collected over four seasons (winter 2004/05 to winter 2007/08) in the Coast, Columbia and Rocky Mountains of British Columbia (Fig. 1). The Coast Mountains are considered to have a maritime snow climate, typically characterized by relatively mild temperatures, heavy snowfall, deep snow cover and rapidly fluctuating periods of instability which generally occur during or immediately following storms. The Rocky Mountains are considered to have a continental snow climate typical of inland areas. Characteristics include relatively cold temperatures and low snowfall. Instability can linger over long periods due to unstable snowpack weaknesses that commonly develop and persist in a thin, cold snowpack (Reference McClung and SchaererMcClung and Schaerer, 2006, p. 21–23; Reference TremperTremper, 2008, p. 35–38). The Columbia Mountains are described by Reference Hägeli and McClungHägeli and McClung (2003) as having a transitional snow climate with a strong maritime influence.

Fig. 1. Sketch map of western Canada showing public avalanche bulletin regions in which field data were collected.
For the majority of the field days, stability test sites were limited to sheltered areas at treeline or below. Alpine sites were typically not selected because wind effect and aspect-dependent differences in exposure to the sun in this vegetation zone contribute to increased spatial variability within the snowpack and we felt that recreationists with limited experience could not be expected to choose representative locations for stability tests. Some alpine data were collected in the winter of 2007/08, but these were not included in this analysis.
Regional avalanche danger (D RF)
A typical Canadian avalanche bulletin consists of danger ratings for three different elevation bands or vegetation zones (alpine, treeline and below treeline), along with several paragraphs of text that include a brief travel advisory, a summary of recent avalanche activity, a description of the snowpack, and a weather forecast. Avalanche danger ratings follow the five-level scale presented in Table 1 (Reference Dennis and MooreDennis and Moore, 1997). Canadian definitions of the five danger levels differ from those used in Europe by referring only to the probability of avalanche occurrences without referencing avalanche size. While the numerical values provided in Table 1 are not typically associated with the danger ratings in Canada, they are common in Europe and have been used in this analysis. For the majority of the public forecast regions in Canada, bulletins are issued every 2–3 days (three times per week) except during holiday periods.
Table 1. Canadian avalanche danger scale and descriptors (after Reference Dennis and MooreDennis and Moore, 1997)

Public avalanche forecasters in western Canada prepare regional bulletins based on local weather, snowpack and avalanche observations, current and forecast regional weather and daily reports of avalanche activity, snowpack structure and stability ratings from operations within the forecast region. Much of this information, which comes from avalanche safety programs associated with parks, highways, resource industries, ski areas and commercial backcountry ski operations, is at least 24 hours old at the time of bulletin preparation. For each of the larger forecast regions, daily reports from at least five small-scale operations are generally available to the forecaster (Reference Jamieson, Campbell and JonesJamieson and others, 2008).
Regional bulletins for the forecast areas represented in the dataset are issued on different spatial and temporal scales by different agencies (Table 2). For this analysis, the most recent danger rating for each applicable vegetation zone available to a recreationist on the morning of the observation day was selected as the regional avalanche danger (D RF).
Table 2. Summary of avalanche bulletin regions included in the analysis

Local avalanche danger (D LN)
Each observation day, a field team of two or three observers travelled on touring skis to a study site at or below treeline. Field teams had typically been working in the area, were familiar with local conditions and had access to weather, snowpack and avalanche observations from avalanche safety operations in the vicinity. While travelling (typically for at least 15 minutes and often for more than 60 minutes), observers made simple but valuable weather, snowpack and avalanche observations. Field teams were directed to select sites at or below treeline that appeared representative of sheltered snowpack areas, and to avoid wind-affected and low-elevation sites.
At the study site, a detailed snow profile was completed following the procedure outlined in the Canadian Avalanche Association (CAA) Observation guidelines and recording standards for weather, snowpack and avalanches (CAA, 2007, p.16–22). To capture variability expected due to site selection by inexperienced recreationists, observers did not ensure uniformity of the proposed site by probing prior to digging. At least two compression tests (Fig. 2; Table 3) and sometimes one rutschblock test (Fig. 3; Table 4) were completed with each snow profile. Test score (number of taps) and fracture character (Table 5) were recorded for each compression test, and test score (loading step) and release type (Table 6) were recorded for each rutschblock test.
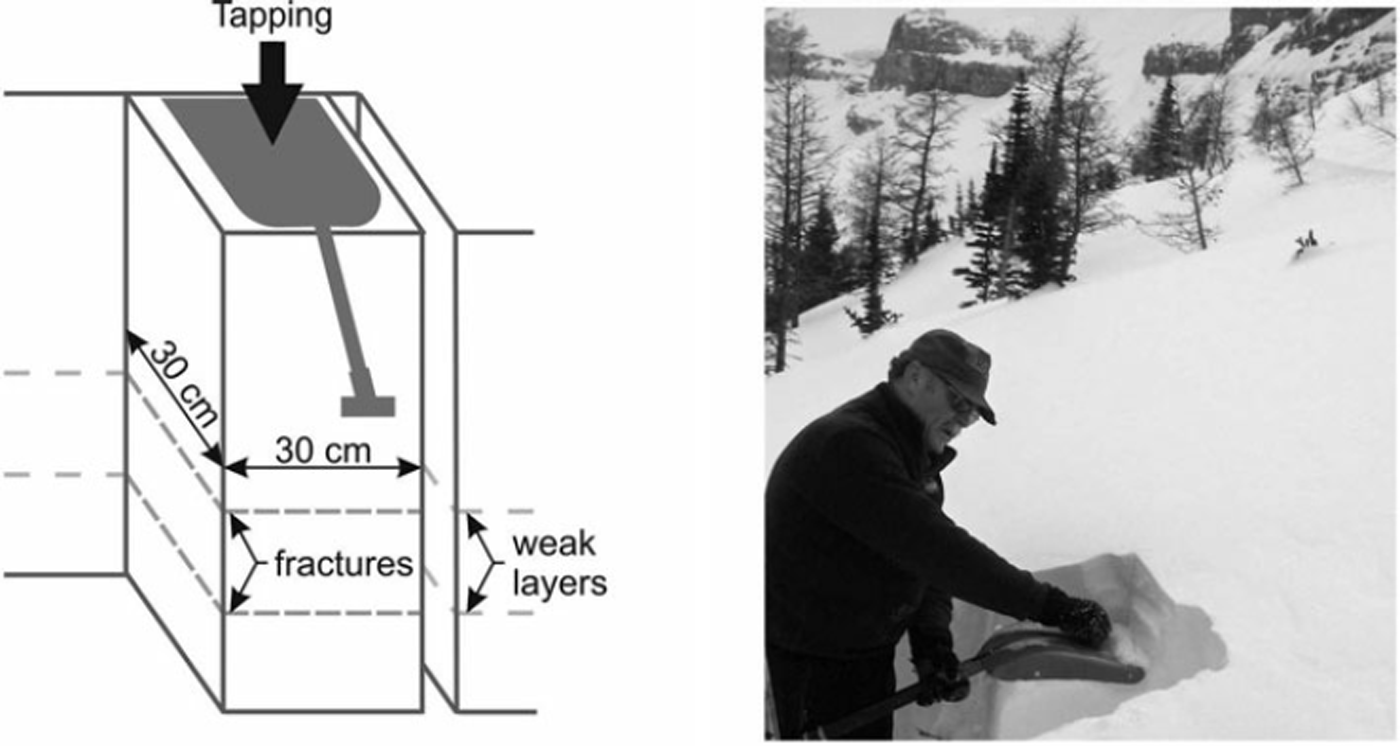
Fig. 2. Compression test (after CAA, 2007, p. 36–37).
Table 3. Compression-test loading steps (after CAA, 2007, p.39)
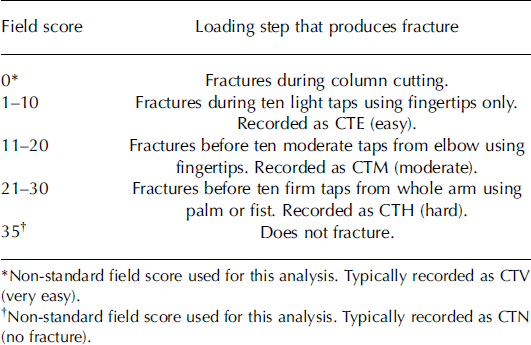
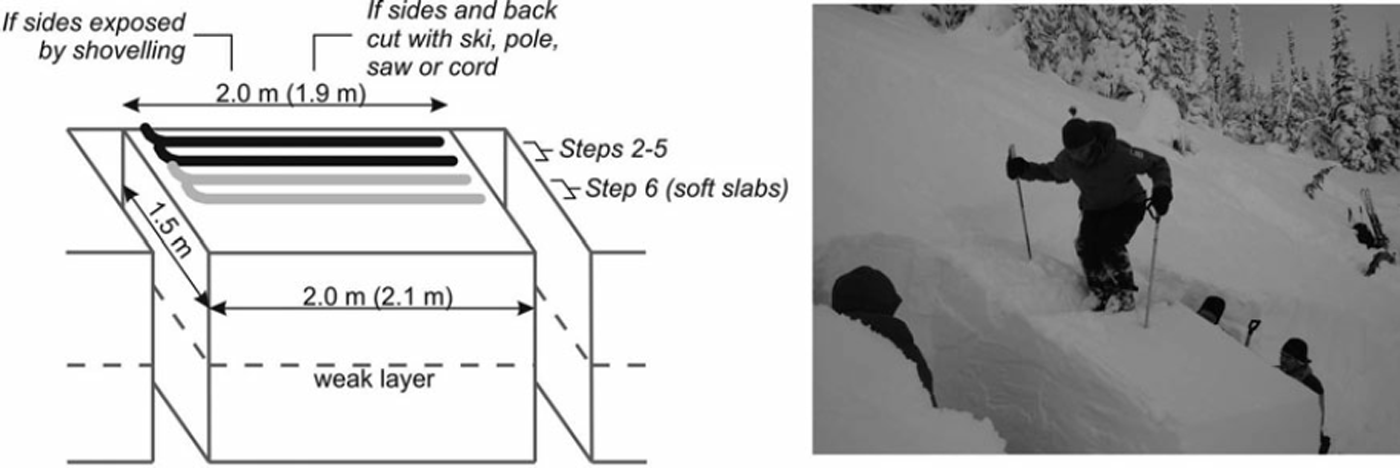
Fig. 3. Rutschblock test (after CAA, 2007, p. 30–34).
Table 4. Rutschblock test loading steps (after CAA, 2007, p. 32–33)
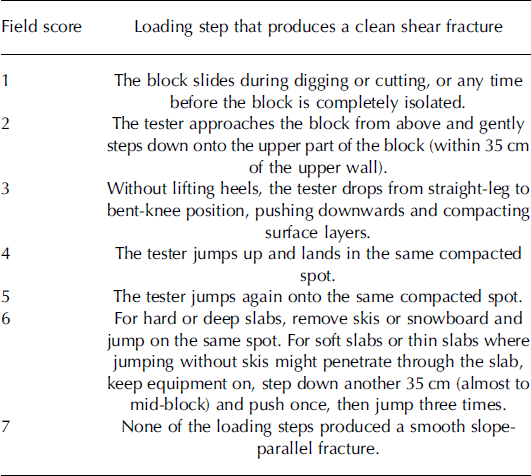
Table 5. Fracture character for compression tests (CAA, 2007, p. 40; Reference Van Herwijnen and JamiesonVan Herwijnen and Jamieson, 2007)
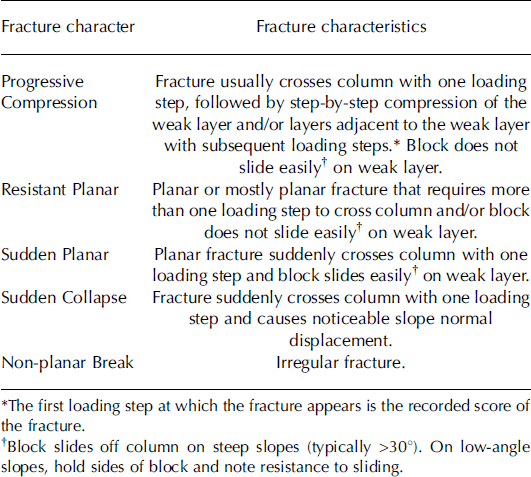
Table 6. Rutschblock release type (CAA, 2007, p. 33)

Using all the information available, including prior knowledge regarding conditions, observations made while travelling and information garnered through completion of the snow profile and stability tests, field teams agreed upon a local danger rating (using the same five-level danger scale as the regional ratings) for their area of travel on that particular day (D LN). When observers felt confident to do so, local danger was rated for both the treeline and below-treeline vegetation zones, resulting in two data points for many observation days. In this study we assume that the local danger ratings, after two potential biases have been filtered out (as discussed below in this section), are the best possible assessments of the local avalanche danger.
Stability test variables
Data collected for this study included results from compression tests and rutschblock tests. The compression test is a popular, and perhaps the most widely used, stability test in Canada. The rutschblock test is the standard stability test used by the Swiss Avalanche Warning Service (Reference SchweizerSchweizer, 2002).
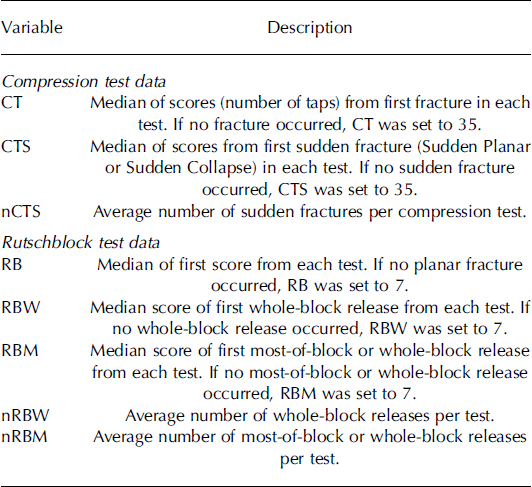
As per Reference Jamieson, Schweizer, Haegeli, Campbell and GleasonJamieson and others (2006), three compression test variables and five rutschblock test variables were extracted from the stability test results (Table 7). To incorporate fracture character into the compression test variables, the number of taps for the first sudden fracture (CTS) and the average number of sudden fractures per compression test (nCTS) were considered as well as the compression test score (number of taps for the first fracture, CT). Sudden fractures were defined as those recorded in the field as Sudden Planar or Sudden Collapse (see Table 5); this is consistent with Q1 shear quality as defined in Reference GreeneGreene and others (2004, p.37). Similarly, rutschblock test variables included the median of the first rutschblock score from each test (RB), the median of the score of the first whole-block and first whole- or most-of-block release (RBW and RBM), and the average number of whole-block (nRBW) and whole-or most-of-block (nRBM) releases per test. Our research assumes that, even with minimal experience, recreationists with basic training will be able to accurately identify sudden failures in compression tests and whole- or most-of-block releases in rutschblock tests.
Table 7. Stability test predictor variables
Bias due to specific stability test result
Because observers included the results of stability tests among the information used to determine the local avalanche danger, there was some concern that the stability test results could not then be considered an independent predictor variable in the analysis. To address this concern, observers collecting data in the latter 3 years of this study were asked to rate the local avalanche danger after travelling to the study site but before starting to dig, and to provide a second local danger rating following completion of the snow profile and stability tests. If there were differences between the pre- and post-dig danger ratings, the reason for the change was also recorded.
Of the 254 compression test cases for which pre- and post-dig ratings were available, the local danger rating was changed 40 times (16%). In 23 of the changed cases (9% of all cases with pre- and post-dig ratings), either no reason was given (2 cases) or the compression test results were noted as a reason for this change (21 cases); the local danger rating increased by one step in 8 cases and decreased by one step in 15 cases, usually because neither test indicated the presence of an expected persistent weak layer. Of the 100 rutschblock test cases for which pre- and post-dig ratings were available, the local danger was changed 12 times (12%). In 5 of the changed cases (5% of all cases with pre- and post-dig ratings), the rutschblock test results were noted as a reason for this change; the danger rating increased by one step in 4 cases and decreased by one step in 1 case.
Cases for which no reason was given and those for which the specific test was noted as a reason for changing the local danger rating were removed from the dataset, leaving 295 compression test cases and 132 rutschblock test cases for analysis (Table 8). Data from the first field season (64 compression test cases and 37 rutschblock test cases without pre- and post-dig ratings) were left in the dataset and we acknowledge a small percentage (approximately 2%) of biased data.
Table 8. Exclusion of cases in which the local danger rating was changed due to the stability test result

Bias due to presence of bulletin readers
A second potential bias in the dataset stems from the presence of field observers who had read the regional bulletin prior to going out for the day. Of 284 compression test cases for which the presence or absence of a bulletin reader could be confirmed, at least one of the field observers had read the regional danger rating in 159 cases (56%). Bulletin readers were present in 77 of the 126 rutschblock test cases (61%) for which the presence or absence of a bulletin reader could be confirmed. In both datasets, the Spearman rank correlations between regional (D RF) and local (D LN) danger ratings and the hit rates, i.e. the fraction of total cases in which D RF= D LN (Reference WilksWilks, 1995, p. 240), were higher when bulletin readers were present than when none of the field observers had read the bulletin (Table 9). Spearman rank correlations (Reference Walpole, Myers, Myers and YeWalpole and others, 2006, p. 690–691) were chosen because of the ordinal nature of the regional and local danger ratings.
Table 9. Bias check for presence of bulletin readers in the field team
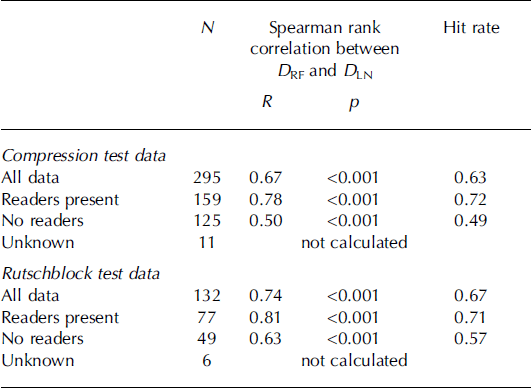
The significance of the difference between correlations for the bulletin readers and non-readers groups was assessed by first converting the correlations to z scores using Fisher’s transformation. A z statistic was then calculated from the difference between the two z scores and their pooled standard error (Reference Myers, Sirois, Kotz, Read, Balakrishnan and VidakovicMyers and Sirois, 2006). Within the compression test data, a two-sided z test yielded a p value of <0.001, indicating a statistically significant difference between the correlations for the two groups. For the rutschblock test data, the two-sided z test was also significant, with a p value of 0.044. These results suggest that the local danger ratings may have been influenced by prior knowledge of the regional danger rating on days when field observers had read the regional bulletin before heading into the field.
To eliminate this potential bias, all cases for which at least one bulletin reader was (or may have been) present were removed from the dataset. This reduced the number of compression test cases to 125 and the number of rutsch-block cases to 49. Because field teams collecting data in the Rockies always included at least one person involved in writing the Banff, Yoho and Kootenay National Parks public bulletin, the remaining data included observations from the Coast and Columbia Mountains only. The remaining compression test data included 21 cases from Glacier National Park, 78 cases from the North Columbia region, 1 case from the North Shore region, 21 cases from the South Coast region and 4 from Whistler Backcountry. The remaining rutschblock test data included 6 cases from Glacier National Park, 35 cases from the North Columbia region, 4 cases from the South Coast region and 4 from Whistler Backcountry.
Effect of vegetation zone
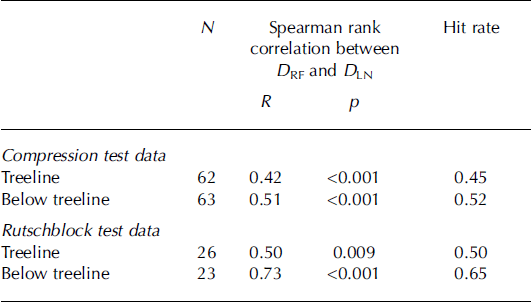
To determine whether or not vegetation zone had any effect on the local danger ratings, separate hit rates and Spearman rank correlations (between the regional and local danger ratings) were calculated for below-treeline and treeline data (Table 10). For both compression test and rutschblock test cases, data collected below treeline showed stronger correlations and higher hit rates than data collected at treeline. Considering that less spatial variability is expected in below-treeline areas, better agreement between local and regional danger ratings in this vegetation zone is perhaps not surprising. A two-sided z test for the significance of the difference between Spearman rank correlations yielded p values of 0.53 and 0.22 for the compression test and rutschblock test data, respectively. Because these results indicated no statistically significant difference between the correlations for the two groups, treeline and below-treeline data are combined in the following analysis.
Table 10. Comparison of data by vegetation zone
Analysis and Discussion
After removal of the biased data, the dataset used for analysis included 125 compression test cases and 49 rutschblock test cases collected at and below treeline in the Coast and Columbia Mountains. More than 90% of the cases in each dataset were collected during January, February and March.
Comparison of regional and local danger ratings
Figure 4 illustrates the relative frequencies of local and regional danger ratings for the compression test and rutschblock test data. It is evident that many more data were collected when the regional rating was Low, Moderate or Considerable than when it was High or Extreme, and that the most frequent regional danger rating on observation days was Moderate. For rutschblock test cases, Moderate was also the most frequent local danger rating, while Low occurred most frequently as the local danger rating for the compression test cases.
The difference (ΔD) between the regional (D RF) and local (D LN) danger ratings was calculated as follows:
Cases for which the regional and local danger ratings were the same (ΔD=0) are referred to as ‘Hits’ in subsequent discussion. The hit rates for the filtered compression test and rutschblock test cases were 0.49 and 0.57, respectively (Table 9).

Fig. 4. Relative frequencies of the regional and local danger ratings for the (a) compression test (N = 125) and (b) rutschblock test (N = 49) data.
Cases for which the regional danger rating was higher than the local danger rating (ΔD>0) are called ‘Overs’, and those for which the regional danger rating was lower than the local danger rating (ΔD<0) are called ‘Unders’. With respect to public bulletins, Unders are of greater concern because recreationists are more likely to make riskier decisions in the backcountry when the bulletin underestimates the local avalanche danger.
The relative frequencies of Hits, Unders and Overs are plotted in Figure 5, which shows that there are no cases in the dataset with a difference of more than two steps between the regional and local ratings. It is also apparent that, for both compression test and rutschblock cases, there were more Overs than Unders. This suggests that the regional bulletins tended to overestimate danger relative to our local ratings. Because Overs are not possible when the regional rating is Low and Unders are not possible when the regional rating is Extreme, we expect that the disparity between Overs and Unders would be even more pronounced if we had an equal number of cases corresponding to Low and Extreme regional ratings in our dataset. As noted in Reference Jamieson, Campbell and JonesJamieson and others (2008), public forecasters may account for uncertainty associated with forecasting over large areas up to 3 days in advance by focusing on sub-regions with higher danger and/or ‘erring on the side of caution’.
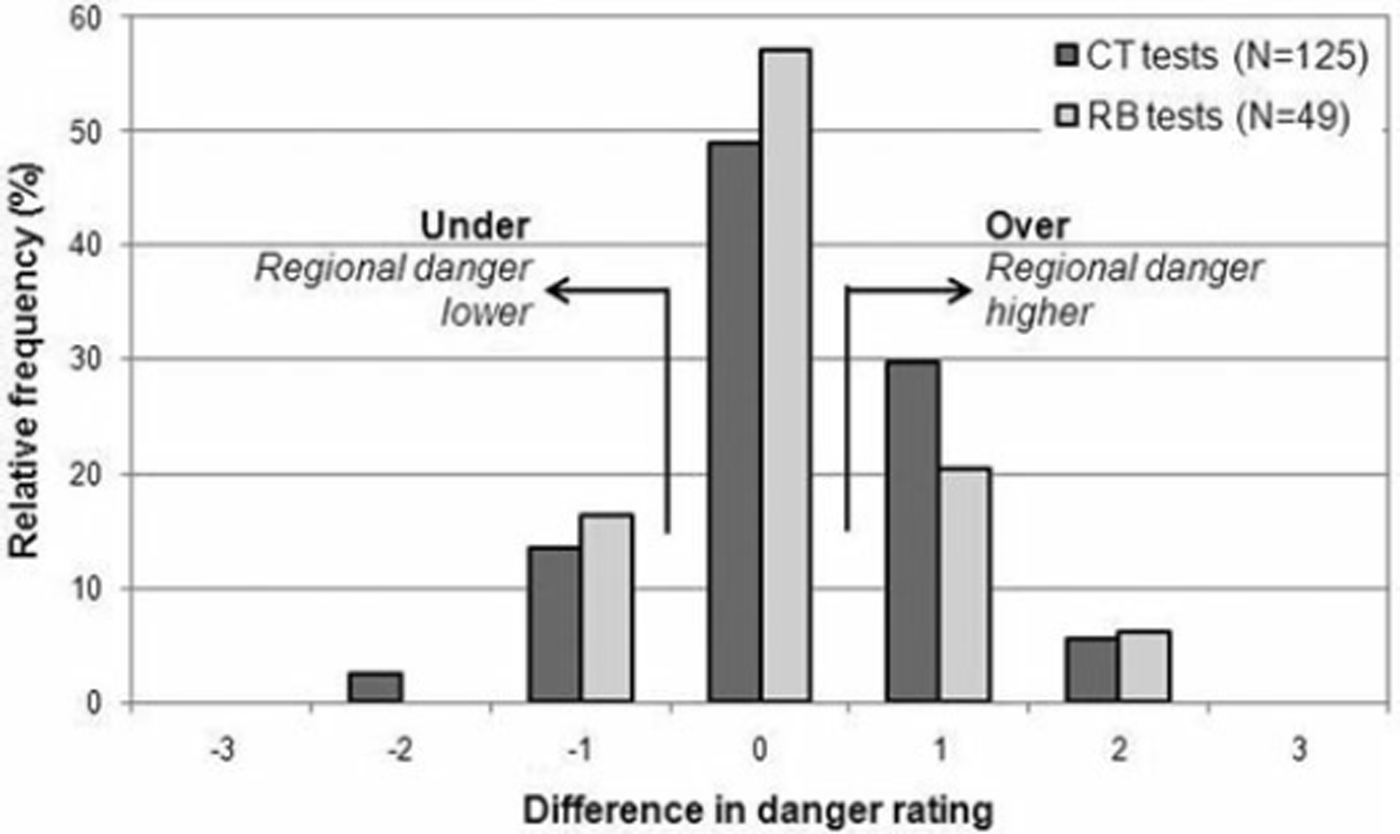
Fig. 5. Relative frequencies of the difference between regional and local danger ratings (ΔD = D RF-D LN) for the compression test (CT) and rutschblock test (RB) data.
Correlations between stability test variables and danger ratings
As a first look at how stability test results might relate to local avalanche danger, Spearman rank correlations between the various stability test variables and D RF, D LN and ΔD were evaluated. Because differences in snow climate were expected to affect these relationships, correlation coefficients were calculated for the dataset as a whole and for data from the Coast and Columbia Mountains separately; these results are summarized in Table 11.
Table 11. Spearman rank correlations between stability test variables and danger variables. Significant correlations (ρ<0.05) marked in bold italics
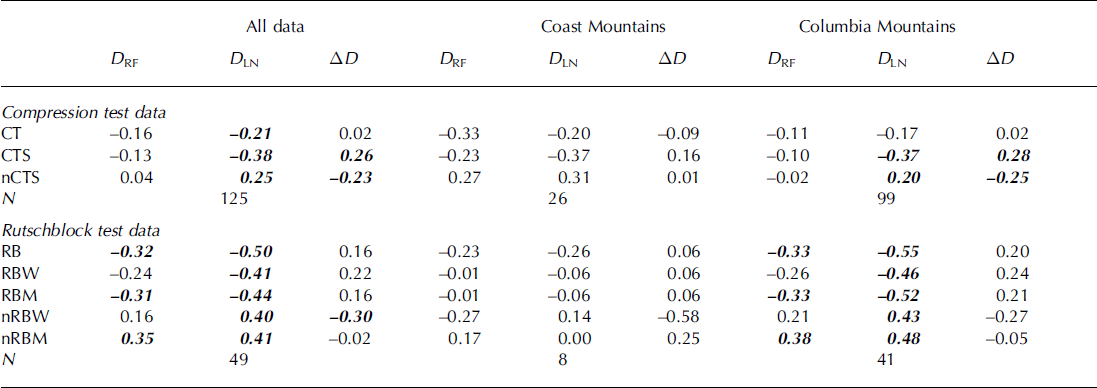
Within the Coast Mountains data, the Spearman rank correlation between regional and local danger was 0.60 in the compression test data and 0.76 in the rutschblock test data; both are significant at p<0.05. We acknowledge that we have limited data for the Coast Mountains, particularly for the rutschblock test. No statistically significant correlations were identified between the stability test variables and any of the danger variables (i.e. D RF, D LN and AD) within the Coast Mountains data. We therefore conclude that, in our dataset, a single stability test result appears to have limited use in helping recreationists with limited experience assess local avalanche danger in the Coast Mountains.
Within the Columbia Mountains data, the Spearman rank correlation between regional and local danger was 0.47 in the compression test data and 0.61 in the rutschblock test data; both are significant at p < 0.05. None of the correlations between stability test variables and danger variables were as strong, confirming that the regional danger rating is by far a better predictor of local avalanche danger than any single stability test result. Because stability tests represent such a small area (0.09 m2 for a compression test and 3 m2 for a rutschblock test) relative to even the local danger ratings, and because substantial slope scale variability in stability test score has been well documented (e.g. Reference Campbell and JamiesonCampbell and Jamieson, 2007; Reference Schweizer, Kronholm, Jamieson and BirkelandSchweizer and others, 2008a), strong correlations between stability test variables and local danger were not expected. Three of the rutschblock variables yielded significant correlations with the regional danger rating, but, in general, correlations with the regional danger were weaker than with the local danger and fewer correlations were significant.
The rutschblock test variables examined in this study appeared to consistently exhibit stronger correlations with the local danger rating than the included compression test variables. This seems reasonable given the greater test area or support, although a two-sided z test comparing the correlation between CTS and D LN against the correlation between RB and D LN showed no statistically significant difference (p= 0.22) between the two stability tests. The addition of information about rutschblock release type as well as rutschblock score did not change the correlation with local danger much. Both of the compression test variables which correlated significantly with local danger included a measure of fracture character. The signs of all significant correlations in Table 11 were as expected, with higher stability test scores corresponding to lower danger ratings, and more sudden fractures (or whole- and most-of-block failures) corresponding to higher danger ratings.
Can stability test variables be used to estimate local avalanche danger?
As noted above, the regional danger rating provided a much better estimate of local avalanche danger than can be determined from the result of any single stability test. However, there are areas in western Canada for which no regional bulletin is issued, and there is interest and value in identifying whether or not stability tests can provide some direction towards estimating the local avalanche danger. In the Columbia Mountains data, the correlation analysis identified that two compression test variables (CTS and nCTS) and all five rutschblock test variables had significant correlations with the local avalanche danger; the strongest of these was RBM (R = –0.55). As shown in Figure 6, however, there are too few data for local ratings of High or Extreme, and too much variation at local ratings of Considerable, Moderate or Low for the stability test variables alone to be of much predictive value.
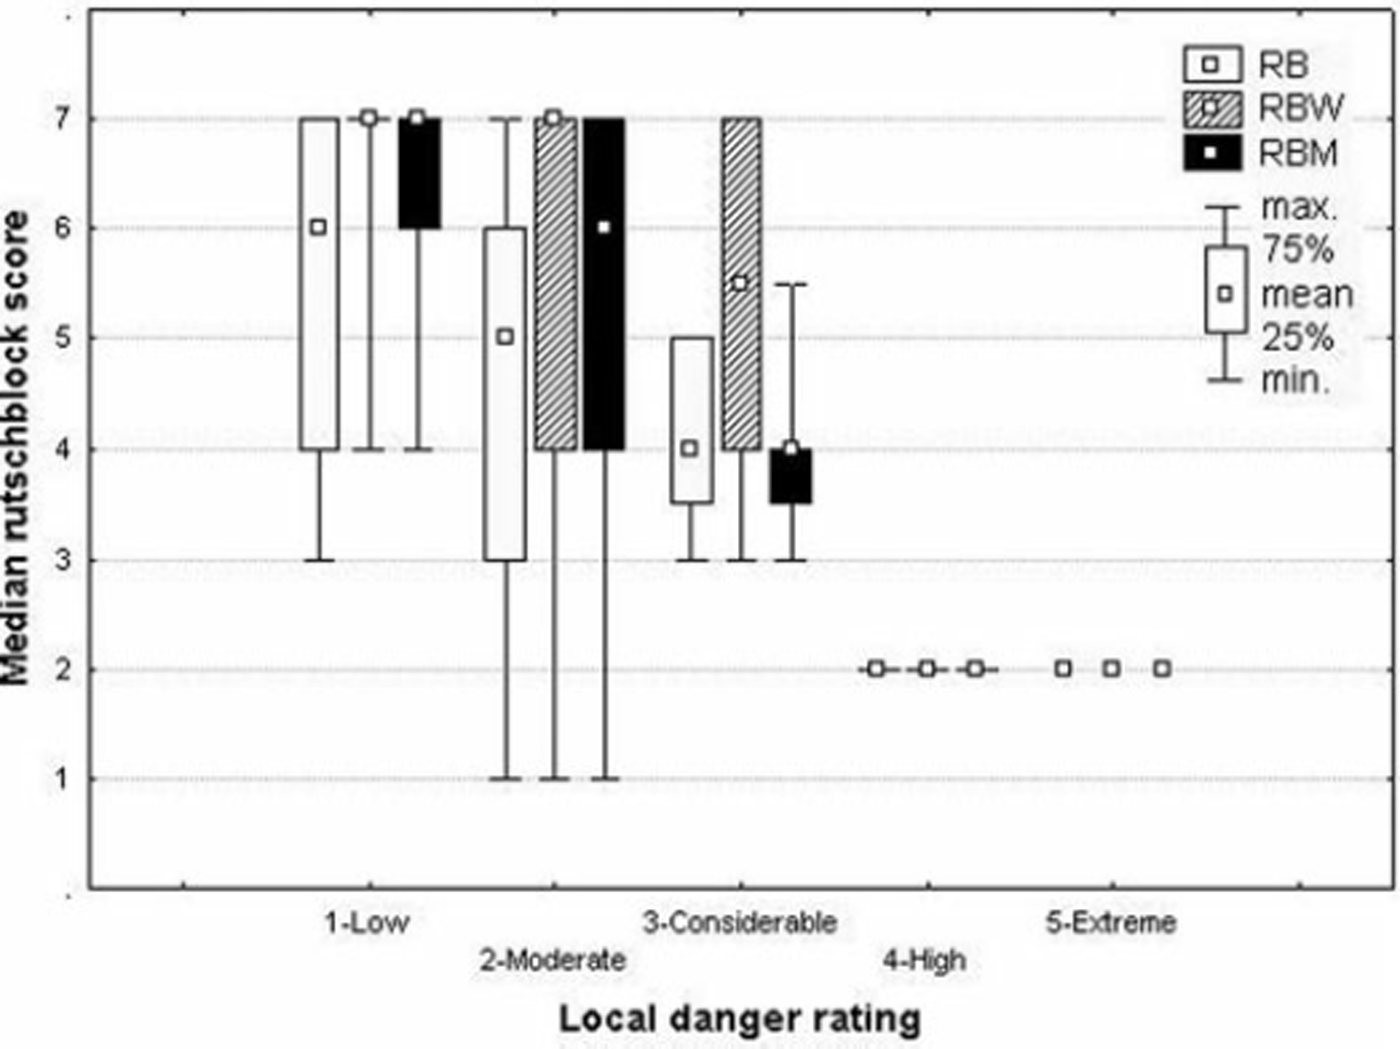
Fig. 6. Rutschblock test variables RB, RBW and RBM for each level of local avalanche danger for Columbia Mountains data (N = 41).
To see if stability test results could at least help identify times when the local avalanche danger was not Low, cumulative frequency distributions for different values of RBM were plotted against local avalanche danger for the Columbia Mountains data. Figure 7 suggests that, if there are any whole- or most-of-block failures in the rutschblock test, there is about a 75% chance that the local danger at and below treeline is higher than Low. This approach could be used to develop some general guidance that may help recreationists travelling in areas for which regional danger ratings are not available.
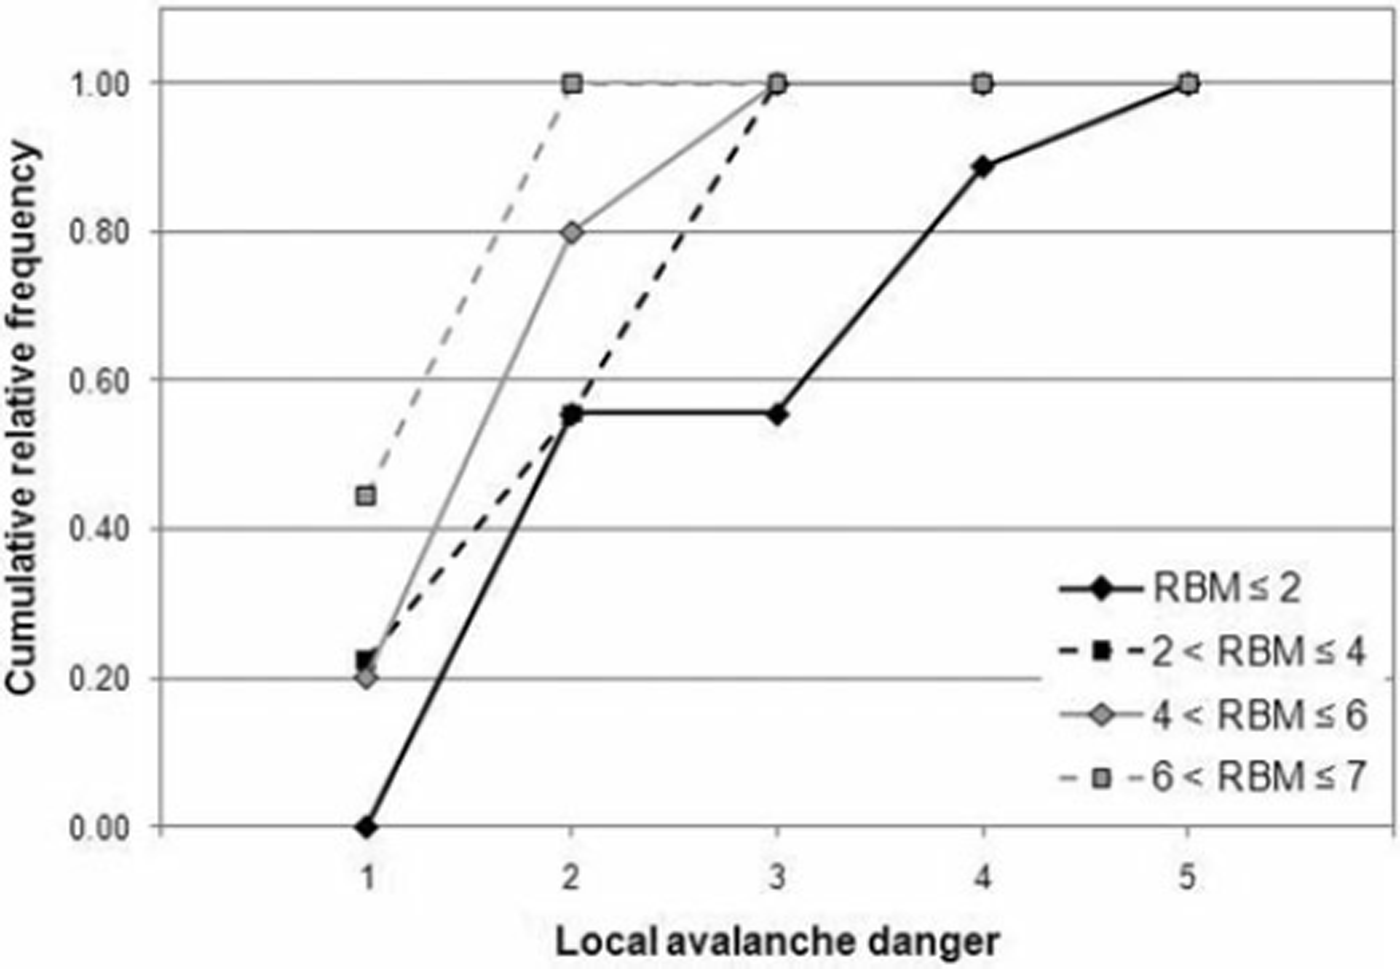
Fig. 7. Cumulative relative frequency of rutschblock test variable RBM by local avalanche danger rating for Columbia Mountains data (N= 41).
Using stability test variables and regional avalanche danger to estimate the local avalanche danger
In analyzing the use of stability test variables with the regional avalanche danger rating to estimate the local avalanche danger, we focused primarily on identifying Unders, as these are the cases of most concern with respect to decisions made by recreational backcountry travellers. Following the method used by Reference Jamieson, Schweizer, Haegeli, Campbell and GleasonJamieson and others (2006), we applied if-then rules in the following form:
IF [regional danger rating condition] AND [stability test result condition] THEN [conclusion about local danger]
The regional danger rating condition used was D RF≤ D RF*, where D RF* is a specific threshold regional danger rating. The stability test result condition is a similar greater-than or less-than statement for each of the stability test variables relative to a specific threshold value (e.g. CTS<CTS* or nRBW> nRBW*). Two different approaches were examined for the conclusion about local danger. The first approach was the prediction of quantitative danger-rating adjustments such as D LN' = D RF+1 or D LN' = D RF + 2, where D LN' represents the predicted local danger. Danger-rating adjustments of more than two danger-scale steps (e.g. D LN' = D RF + 3) were not considered because discrepancies of more than two steps between the local and regional ratings were not observed in the dataset. The second approach examined was the more general qualitative conclusion that ‘The regional rating underestimates the local avalanche danger’.
To evaluate the quantitative approach, we compared the number of Hits, Unders and Overs for different threshold values of the regional danger rating and each stability test variable. Table 12 summarizes, for each compression test variable, the rule that resulted in the highest number of Hits with the fewest Unders. For this dataset, the highest hit rate was achieved by:
IF D RF ≤ 1 AND CTS<21, THEN D LN' = D RF +1
or
‘If the regional danger rating is Low and the compression test score for the first sudden fracture is less than 21, then the predicted local danger is Moderate.’
Table 12. Results of quantitative if–then rule analysis for compression test data (N = 99)
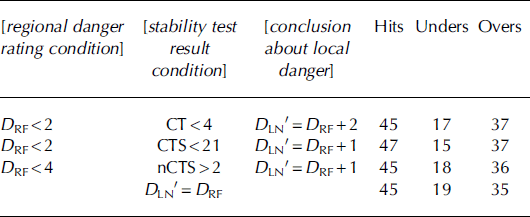
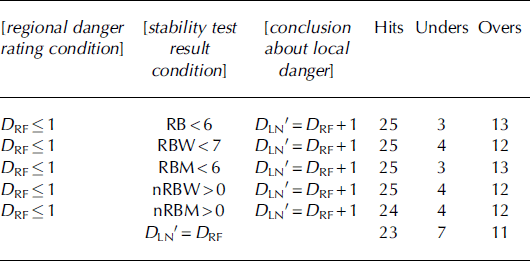
Relative to using the regional danger rating alone as an estimate of the local avalanche danger, this rule increased the number of Hits by 2 (approximately 2 percentage points) and reduced the number of Unders by 4 (approximately 4 percentage points). In the rutschblock test dataset, the biggest improvement was achieved by two separate assessment rules (Table 13). Both rules increased the number of Hits by 2 (approximately 5 percentage points) and reduced the number of Unders by 4 (approximately 10 percentage points).
Table 13. Results of quantitative if–then rule analysis for rutsch-block test data (N = 41)
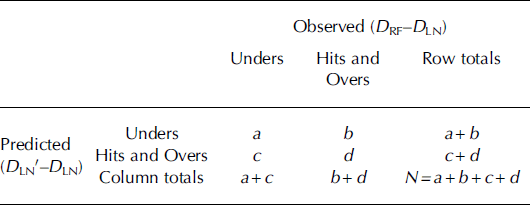
The qualitative conclusion about local avalanche danger was evaluated using three different measures commonly used in two-category forecast verification: the Threat Score (TS), False Alarm Rate (FAR) and True Skill Score (TSS), as described below (Reference WilksWilks, 1995, p. 240–250). The ability of each if–then rule to identify Unders was assessed using Table 14, a two-by-two contingency table.
The TS is calculated by dividing the number of times an Under is correctly predicted by the number of times an Under is either predicted or observed. This value can range from 0 (indicating that no Unders are correctly predicted, a = 0) to 1 (indicating that all Unders are correctly predicted and none are falsely predicted, b + c = 0). The FAR, which also ranges from 0 to 1, represents the fraction of predicted Unders that were not observed. A FAR of 0 is a good score, indicating that no observed Hits or Overs were incorrectly predicted as Unders (b = 0), while a FAR of 1 indicates that none of the observed Unders were correctly predicted (a = 0). The TSS, also known as the Hanssen-Kuipers discriminant, is a comparison against a random forecast. Negative values indicate predictions that are worse than random, while a TSS of 1 indicates perfect prediction.
Table 14. Contingency table used to evaluate qualitative if–then rule analysis
For each stability test variable in turn, the regional danger rating threshold, D RF*, and the stability test variable threshold were adjusted to achieve the maximum possible TS. In the compression test dataset, the same threshold values also resulted in the maximum TSS (Table 15). In the rutschblock test dataset, however, this was not the case. As shown in Table 16, TS values were maximized when the regional danger rating was less than or equal to 1 (Low), while maximum TSS scores were associated with a regional danger-rating threshold of 3 (Considerable). However, the TS criterion seems more desirable, as the rules identified by the maximum TSS scores are associated with very conservative identification of Unders and substantially higher FAR.
Table 15. Results of qualitative if–then rule analysis for compression test data (N = 99)

Table 16. Results of qualitative if–then rule analysis for rutschblock test data (N = 41)

The rules developed to maximize TS using the rutschblock data generally performed better than those developed using the compression test data, with slightly higher values of TS and TSS, and slightly lower FAR. It is noteworthy that, in both the compression test data and the rutschblock test data, the rules with the highest TS and TSS were associated with stability test variables that did not include a measure of fracture character (compression test data) or release type (rutschblock test data). However, when fracture character or release type was considered, the rules developed to maximize TS showed that, when the regional rating is low, the presence of any sudden fracture or whole-/most-of-block release indicated that the regional rating has underestimated the local avalanche danger.
The rutschblock test variables that incorporate a measure of release type showed promise by having the lowest FAR. Although our results showed no advantage to considering whole-block releases separately from most-of-block releases, we acknowledge that the number of most-of-block releases in our dataset is limited and that Reference Schweizer, McCammon and JamiesonSchweizer and others (2008b) found that whole-block releases correlate much better with skier-triggered avalanches on adjacent slopes than most-of-block releases did.
Although difficult to compare directly, it is clear that the rules developed to identify Unders based on a qualitative conclusion about local danger resulted in more conservative estimates of local danger than the rules developed based on a quantitative conclusion about local danger. In both cases, rutschblock test results showed slightly more promise for use with regional danger ratings to estimate the local avalanche danger than compression test results. The limited value of one or two adjacent stability tests within an extent of less than a few metres for estimating the avalanche danger rating over approximately 10 km2 is not surprising because of the inherent and spatial variability of the tests in relation to the processes that cause instability (Reference Hägeli and McClungHägeli and McClung, 2004; Reference Schweizer, Kronholm, Jamieson and BirkelandSchweizer and others, 2008a).
Conclusions
A dataset consisting of regional avalanche danger ratings, corresponding local avalanche danger ratings, and stability test results at sites similar to those a recreationist with limited experience would select was collected over four winter seasons in the Coast, Columbia and Rocky Mountains of British Columbia. Because local danger ratings were typically made for treeline and below-treeline areas on each field day, the overall number of data available for analysis was approximately twice the number of field days. After filtering to remove potential biases, 125 compression test cases and 49 rutschblock test cases remained for analysis. Because the majority of the data were collected during January, February and March, the results of this analysis are applicable to dry snow conditions only. Comparison of the local avalanche danger ratings with the regional avalanche danger ratings showed that regional bulletins in western Canada had a hit rate of 0.49 or better, and that the regional bulletin ratings tended to overestimate the local danger relative to the field ratings of local avalanche danger.
Within this dataset, comparison of the stability test results with local and regional avalanche danger ratings suggested that, in the Coast Mountains, a single stability test result appears to be of limited benefit to inexperienced recreationists in estimating the local avalanche danger. For data collected in the Columbia Mountains, three of eight stability test variables correlated significantly with the regional avalanche danger and seven of eight correlated significantly with the local avalanche danger. However, none of these correlations was as strong as that between the regional danger rating and the local danger rating; this confirms that, although there are a number of factors contributing to differences between local and regional ratings, the regional danger rating was by far the best single predictor of local avalanche danger. The analysis also supports the conclusion reached by many avalanche experts that, without expert site selection, a single ‘point’ stability test is a relatively poor predictor of local avalanche danger (e.g. Reference Schweizer, Kronholm and WiesingerSchweizer and others, 2003; Reference TremperTremper, 2008, p. 148, 180).
Rutschblock test results correlated better with local avalanche danger than the compression test results did. Although compression test variables which included information about fracture character correlated better than those without, the addition of information about rutschblock release type did not substantially improve the strength of the correlation with the local avalanche danger in this dataset.
Correlations between stability test results and local avalanche danger were generally weak, indicating that a single point stability result is a poor predictor of local avalanche danger. However, stability results showed promise in helping recreational backcountry travellers identify areas where the local avalanche danger is higher than the regional danger rating. Using if–then rules based on both qualitative and quantitative assessments of local avalanche danger, the analysis showed that in the Columbia Mountains information obtained from a single stability test can be useful in helping backcountry recreationists identify areas of avalanche danger which are locally higher than the regional rating. The rules developed appear to be of most use when the regional avalanche danger is Low. Rutschblock test variables typically performed better than compression test variables in this task, and including a measure of rutschblock release type showed promise for better estimates of local avalanche danger.
This analysis was limited to data collected at sheltered sites at treeline or below, and included results from compression tests and rutschblock tests only. We assume that other point stability tests (e.g. extended column test) would have similar limitations. While the dataset did not include field weather and snowpack observations that do not require digging a pit, Reference Jamieson, Haegeli and SchweizerJamieson and others (2009) suggested that these also show merit. Combining the results of stability tests with simple field observations and the regional danger rating may prove to be the most successful means of estimating local avalanche danger. We draw no conclusion about the value of the same stability tests to slope-scale assessments of avalanche danger undertaken by experienced avalanche practitioners.
Acknowledgements
For meticulous snowpack observations, we thank P. Langevin, A. Zeidler, K. Matheson, A. Haeri, J. Floyer, D. Gauthier, C. Brown, T. Exner, M. Kolanski, W. Rens, C. Ross, M. Smith and C. Campbell as well as Parks Canada wardens from Banff, Yoho and Kootenay National Parks. The study relied on logistical support and advice from the Avalanche Control Section of Glacier National Park; British Columbia Ministry of Transportation and Infrastructure offices in Pemberton and Hope; Whistler Blackcomb Ski Resort; Cypress Mountain, Banff, Yoho and Kootenay National Parks; Kicking Horse Mountain Resort; and Mike Wiegele Helicopter Skiing. We are grateful to the National Search and Rescue Secretariat for funding for the fieldwork part of this study under the CAA’s Avalanche Decisions for Amateur Recreationists (ADFAR) project.


