1. Presentation
Numerical and theoretical studies of ice sheets and ice shelves are numerous. The numerical studies model past, present or future large ice masses, while the theoretical work tries to derive the main characteristics of these flows. The theoretical approach generally uses perturbation methods to solve the equations describing either the ice sheet or the ice shelf. It has been possible to determine the relative magnitude of the main physical quantities (stresses, strain rates and their gradients; for both ice sheets and ice shelves (see, for example, Smith and Morland, Reference Sani, Gresho, Lee and Griffiths1981 Reference Morland and ShoemakerMorland and Shoemaker, 1982These studies show that ice-sheet flow is dominated by shear stress while ice-shelf now is dominated by longitudinal deviatoric stress. I t is therefore possible to use reduced equations for each of these flows. This is, however, not possible in a transition zone. In view of the supposed complexity of such flow, a numerical method has been chosen to solve the steady-flow equations. With this approach, non-reduced Stokes equations can be used. Furthermore, as the primary aim of this work is to derive the main features of the flow, the transition zone has been modelled by simplifying characteristics such as the geometry and the temperature field.
A transition zone is characterized by the more-or-less gradual change in basal-boundary conditions. Two limiting cases can be considered: either the change in basal drag occurs at the grounding line (called the TZno-slip case) or it occurs over very long distances compared to the ice thickness. The latter case corresponds to nearly floating ice streams. The present study considers only a steady sharp transition zone.
2. Modelling the transition zone
The usual assumptions are made: the ice is considered to be an isotropic material (no texture), a homogeneous and continuous medium (constant density and no crevasses) and incompressible. Its rheology is described by a nonlinear flow law. The dynamics of the now are governed by steady Stokes equations.
Further assumptions are:
-
(1) The flow is studied in a longitudinal vertical section considering that the lateral margins are far from the center (the thickness/width ratio is very small).
-
(2) The ice is isothermal.
-
(3) The bedrock geometry is very simple in order to use simple basal-boundary conditions.
-
(4) No accumulation/ablation processes arc used.
The non-linear flow law used in this work is the one deduced by data-fitting by Reference Morland and ShoemakerMorland andShoemaker (1982)Large ice-mass flows are opened flows. Free surfaces therefore have also to be computed. This will be done by solving the associated kinematic equations. Various geometries have been used in the numerical experiments. The one presented here has the following features: bedrock slope (2× 10⁴), mean ice thickness (843 m) and width (40 km). This geometry and the reference frame arc presented in Figure 1 and the above characteristics are summarized inTable 1

Fig. 1. Geometry and reference frame of the transition
3. Numerical method
The numerical method used to solve the Stokes equations and their associated boundary conditions is a mixed finite-element method using the Galerkine approach. Presentations of the unite-element method can be found in Reference ReddyReddy (1984)and Reference Dhatt and TouzotDhatt and Touzot (1984)"Mixed" means that the computed unknowns are the two velocities U (horizontal) and W (vertical) and the pressure P. Stresses and strain rates are then deduced from the computed U and TV values. This mixed method is very often used in incompressible Huid mechanics (for a review see Reference Norrie and devriesNorrie and de Vries (1978)).Respecting the rules for numerical stability Reference Hood, Gresho, Sani, Oden, Zienkiewicz, Gallgher and andTaylur(Hood and others, 1974;Kawahara and others, 1971;Reference Sani, Gresho, Lee and GriffithsSani and others, 1981 Reference GunzburgerGunzburger, 1990a six-node triangular element was chosen.
Table I equations and definitions


viscouslaw(morland andshoemaker,1982)

With this element, velocities and pressure are continuously interpolated respectively by second- and first-order polynomials. Because of the dependence of the viscosity on the strain rates (i.e. on the computed velocities), the equation system resulting from this method is not linear and requires the use of an iterative scheme.
The free surfaces z = f(x, t) are governed by a kinematic equation with the following analytical form:
Various numerical schemes (finite-difference or finite element methods) have been tested to solve this nonlinear equation. The scheme used to obtain the results presented in this study is a finite-difference method with implicit temporal and left-side spatial derivatives. For each iteration, the free surfaces are calculated with the computed surface velocities. The program stops when a convergence criterion (relative error in the horizontal velocity between two steps of the iteration) is satisfied. To be sure that the results for the transition zone are as accurate as possible, the program was fully tested. The sub-routines were either tested separately (for example, the solver) or the program was used to provide the solution of various known flows. These flows are either described by a theoretical solution (Poiseuille flow for ice and water) or they are known by computed solutions: for instance, the driven cavity flow for low Reynolds number, rectangular-channel flow Reference NyeNye, 1965and ice-divide flow Reference RaymondRaymond, 1983
As the derivatives calculated using the computed velocities are discontinuous, a smoothing technique was needed. The one used in the program is based on the mean over each node: one node is common to several elements and each element has its derivatives; so, for one given node, the value of a given derivative (for instance •U/•x) is the mean of the element derivatives. This technique has been compared with that of Reference Lee, Gresho and SaniLee and others (1979)
4. Previous study
The only study published up to now on the transition zone is by Reference Herterich, Van der Veen and andOerlemansedsHerterich (1987)In his numerical study, he simplified the basic steady Stokes equations and considered the TZno-slip case. There was no sliding on the bedrock up to the grounding point. The vertical velocity was imposed on the floating surface. An ice-sheet-like velocity profile was imposed at the rear vertical section and an ice-shelf-like velocity gradient was imposed at the front. The numerical method used was a finite-difference scheme. Nevertheless, the geometry was fixed (i.e. no change of the free surfaces). Furthermore, the zero vertical-velocity constraint on the floating surface was not natural and strengthened artificially the vertical velocity field. The results obtained are strongly dependent on the no-change assumption for the free surfaces and on the chosen boundary conditions. The orders of magnitude of the vertical velocity arc not valid and the imposed horizontal velocity does not obey global mass balance. The present study eliminates almost all these problems. The first tests performed for the present study give results in line with those of Herterich. However, rapidly, the discrepancies in the vertical velocity showed that something was inconsistent in the model, either in the boundary conditions or concerning the fixed-geometry assumption. It is indeed very important to take into account the free-surface changes.
5. Boundary conditions
The numerical tests were made using two sets of boundary conditions. The first set was used for the no-sliding problem, while the second takes into account a sliding effect. The two sets differ only by the basal boundary conditions. The different parts of the flow boundary arc shown inFigure 2

Fig. 2 Boundary conditions
The common boundary conditions of the two kinds of tests are described as follows. On the inlet AB, the velocity is set by the Poiseuille theoretical solution. At the outlet DC, we still impose the velocities: U is constant and follows the global mass balance, and W = 0. On the floating surface GC, the Archimedes force is imposed. The upper free surface AD is traction-free. With regard to the basal boundary conditions, we chose to use either no-sliding velocities (U = W = 0) or a mixing of vertical velocity and the x component of the force. For the latter case, the bedrock was divided into two parts. From B to I, the x component of the basal force is set to its no-sliding value, and on IG we have used a linearly decreasing x component of the force from the no-sliding value to the free-sliding value. Furthermore, from B to G the vertical velocity - updated at each iteration - is imposed. The value of the force imposed at the grounding point G is updated iteratively with the value of the ice thickness above G.
For practical computing reasons, G was chosen so as to give a symmetrical transition-zone geometry
6. The no-sliding experiment
a. Presentation
This first category of test concerns the no-sliding basal boundary condition. The numerical method provides the velocities (U,W) and the pressure (P). Then, the shear stress (axz) and the longitudinal deviatoric stress (a'xx) are calculated using the computed velocity field. The free surfaces evolve to a steady state to define the final geometry.
b. How to read the diagrams
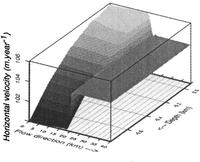
The quantities U, W, axz, a'xx are displayed on three-dimensional diagrams. The reading of this kind of diagram generally needs some experience. An explanation is therefore given. As shown in section 2, the physical geometry is defined in a vertical plane with Cartesian coordinates x and z: x indicates the flow direction (from upstream to downstream) and z is upward. U, W,xz, a'xx, are functions of these two variables and define two-dimensional surfaces in three-dimensional space. This three-dimensional space has as basal plane the physical plane Oxz (0 is the frame origin) and its third dimension is defined by the two-dimensional surfaces. Each diagram is displayed from a different viewpoint in order to give the best possible observation. The reader must locate the depth direction (from top to bottom) and the flow direction pointed out by arrows in the axis text. The two-dimensional surfaces are also displayed using a grey scale which shows at a first glance the gradients.
Finally, the steady profiles of the free surfaces are presented in the usual manner: (x,z = f(x)) diagrams.
c. Description of the results
This section describes all the computed quantities. The aim of the present work is to provide information on flow within the transition zone. Thus, each physical quantity has been listed and analysed in order to bring out the features which are useful in this respect.
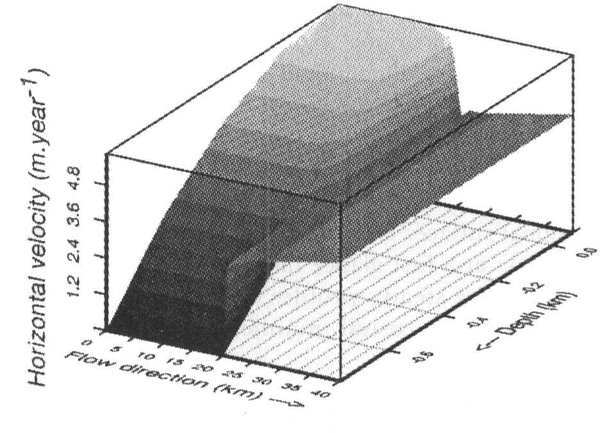
The horizontal velocity field UFig. 3upstream of the grounding point G, shows the expected profile (i.e. the profile of a grounded ice sheet). Furthermore, this field does not show any perturbations, indicating that the inlet-boundary conditions are reliable. The same conclusions hold for the outlet-boundary conditions. A decrease of the surface velocity occurs only over a short distance (several kilometres) around the transition point G. This behaviour was observed in all tests performed with different geometries.

Fig.3 Horizontal velocity
The vertical velocity W Fig. 4shows surprising behaviour around point G. Though it is a steady-state field, the variations shown in the diagram arc too strong. Throughout the tests W was always very sensitive. Nevertheless, the quality of W never really influenced the other results. What strongly affects W is the evolution or the non-evolution of the free surfaces. If they are steady, W is very poor and, according to the test, the other fields can be perturbed. From some viewpoints, the evolving process for the free surfaces fails to produce the most reliable geometry.

Fig.4 Vertical velocity
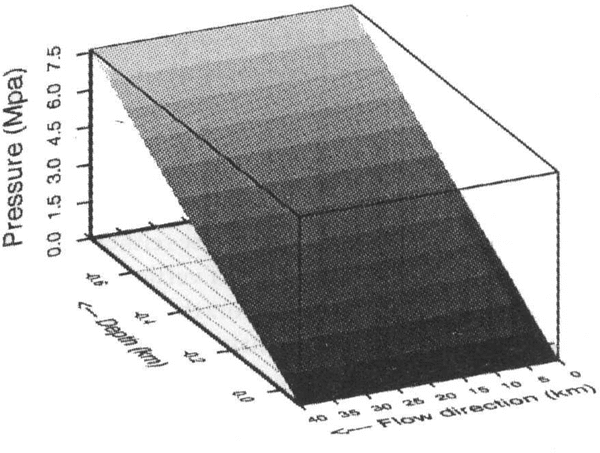
Figure 5shows the pressure P. P is vertically linear with a gradient equal to the hydrostatic gradient

Fig. 5 Pressure
More interesting is the shear stress (axz displayed inFigure 6The (axz field shows no discrepancies. That means that the boundary conditions used for this problem are still relevant. Upstream (from top to bottom) (axz increases linearly from near zero to the usual basal shear for grounded ice-sheet flow. On the floating part, (axz is near zero as expected in an ice shelf. Once again, a change between the two kinds of flows occurs only over several kilometres around point G, showing a strong horizontal gradient

Fig. 6 Shear stress.
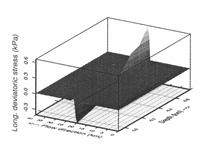
The horizontal deviatoric stress (a'xx. Fig. 7shows a strong change that agrees well with the horizontal velocity changes

Fig. 7 Longitudinal stress.
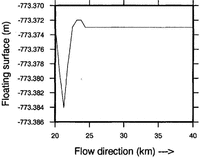
The last results deal with the free-surface changes.Figures 8and 9 show respectively the upper and the floating surfaces. Comparing these two figures shows that the ice shelf dips slightly under the floating equilibrium level downstream of the grounding point G before returning to hydrostatic equilibrium. Though the magnitude of this effect is very small (∼0.l%), it appears to be real. Indeed, studies dealing with the elastic bending of ice shelves due to tidal forcing show the same result Reference StephensonStephenson, 1984 Reference SmithSmith, 1991Furthermore, in situ measurements also demonstrate this effect (personal communication from A. Hombosch). Very recently, GPS missions over a grounding line have measured such a deflection Reference VaughanVaughan, 1994

Fig.8 Upper surface after evolution

Fig. 9. FLoating swface after elwLution
7. The basal-sliding experiment
In this second test, sliding was introduced in the basal boundary conditions by way of the forces. The aim of this was to show the influence of sliding on the solutions given in the previous section. This sliding has been described in section 5. The only quantity which has been slightly changed is the horizontal velocity U. U shows (Fig. 10) the same properties as in the no-slip experiment, except on the bedrock. There, it increases slightly and its x gradient is smoother than for the no-sliding case. Note that the velocity field is not perturbed by the boundary conditions. That shows their suitability

Fig. 10 Horizontal velocity
Remark
A Weertman-like sliding law (linking the basal velocity to the basal shear stress) was tested. If the sliding component is small compared to the total velocity (∼10%), the results are satisfactory. But, if sliding predominates, then the solution is not at all valid. This sliding law exaggerates the variations of the basal force, producing unsuitable variations of the basal velocity (used as a boundary condition on the bedrock). This introduces spurious behaviour in the boundary conditions and the system is excessively stressed. This suggests that these basal-boundary conditions arc not those expected by the system. Some authors (personal communication from C. Ritz) consider that this kind of sliding law is only valid for small basal velocities, a possibility that may be supported by our results.
8. Conclusions
In this numerical study, we have tried to answer the question: what are the mechanical features (velocities, stresses, pressure and free surfaces) in a sharp transition zone between an ice sheet and an ice shelf?
We have defined the transition zone not as the place where an ice sheet becomes an ice shelf but rather the place where the basal drag changes from a high to a small value. "High drag" means no-slip or nearly no-slip drag, and "small drag" means free-slip or nearly free-slip drag. With this definition, the results of this study can be extended to other transition zones: transition between an ice sheet and an ice stream, sticky spots, etc. The difficulty is to define a realistic basal-boundary condition. In this study, the change in basal drag has been introduced by way of the forces and not by way of a sliding law. This method has given correct results.
The main results of this study are as follows:
The horizontal velocity shows two distinct regimes:
the ice-sheet and the ice-shelf regimes. The change from the former to the latter occurs in a very narrow zone over the grounding line. The surface velocity decreases smoothly from one regime to the other.
The pressure is linearly dependent in the vertical coordinate with a gradient equal to the hydrostatic gradient.
The shear stress also changes from an ice-sheet regime to an ice-shelf regime. This transition is smooth with a strong horizontal gradient.
The free surfaces have been allowed to evolve to a steady state. The present study shows that, downstream of the grounding line over several kilometres, the surface elevation/thickness ratio passes through the hydrostatic equilibrium value. This result is in agreement with in situ measurements of the deflection due to tidal forcing. Nevertheless, the magnitude of this effect is very small (∼0.1 %) when only due to the flow.
These results lead to the following conclusions:
(1) It seems impossible to use reduced Stokes equations in the transition zone. (2) The results concerning the horizontal velocity and the shear stress suggest that, in global ice-sheet-ice shelf modelling, the former and the latter can be uncoupled; the ice sheet and the ice shelf are then linked by a jump-boundary condition for the horizontal velocity.
Limit of the study: this two-dimensional transition zone has been modelled assuming that no drag effect comes from the sides. That means that the ice shelf does not affect the upstream flow, as if it were unconfined. In a realistic transition zone, an ice stream or an outlet glacier flows into a confined ice shelf. The anchorage of a confined ice shelf on the sides causes strong drag and the ice shelf then becomes a velocity sink for the input flow. Confirmation of these effects will require a three-dimensional study to be taken into account. Nevertheless, the uncoupling of the ice sheet and the ice shelf should remain valid.


