Introduction
Sulfur-containing compounds in the troposphere play an important role in atmospheric acid-base chemistry and in the formation and growth of aerosol particles, and may thus affect the climate through the potential interaction of such aerosols with incoming solar radiation (Reference Charlson, Lovelock, Andreae and WarrenCharlson and others, 1987). Studies conducted in the past 20 years indicate that most of the sulfate aerosol originates from chemical reactions of sulfur gases discharged into the atmosphere. Sulfur gases have various sources, such as the marine and terrestrial biosphere, volcanoes, biomass burning and anthropogenic emissions. Present-day anthropogenic emissions are thought to represent around 84% and 40% of the sulfur budget in the Northern and Southern Hemispheres, respectively (Reference Bates, Lamb, Guenther, Dignon and StoiberBates and others, 1992). However, in the region south of 50°S, > 90% of the sulfur budget is derived from the marine biosphere, mainly in the form of dimethylsulfide (DMS) (Reference Bates, Lamb, Guenther, Dignon and StoiberBates and others, 1992). In the atmosphere, DMS is oxidized via two routes by the hydroxyl radical: H-abstraction and OH-addition (Reference Saltzman and DelmasSaltzman, 1995). Methanesulfonic acid (MSA) and SO2 (further oxidized to SO4 2-) are the two major oxidation products. Unlike SO4 2-, DMS oxidation is the only known source of atmospheric MSA. Thus, the MSA record in snow and ice cores has been used to investigate the variability of marine DMS emissions in the past (Reference Saigne and LegrandSaigne and Legrand, 1987; Reference Legrand and Feniet-SaigneLegrand and Feniet-Saigne, 1991; Reference Pasteur, Mulvaney, Peel, Saltzman and WhungPasteur and others, 1995). However, in order to reconstruct the atmospheric record based on snow or ice-core records, we need to understand the processes by which particles and gases reach their final position embedded in glacial ice. These processes include (1) particles and gases being emitted from sources and carried through the atmosphere to the air over the glacier, (2) the constituents being transported from the atmosphere to the surface of the glacier by a combination of deposition processes, i.e. wet deposition, dry deposition and fog deposition, and (3) post-depositional modification (Reference Davidson, Bergin, Kuhns, Wolff and BalesDavidson and others, 1996). At present, the relationship between the composition of snow and that of the atmosphere, and the processes of air/sea exchange and DMS oxidation are unclear. Therefore, we assume that the MSA record in snow and ice cores reflects the variability of marine DMS emissions in the past.
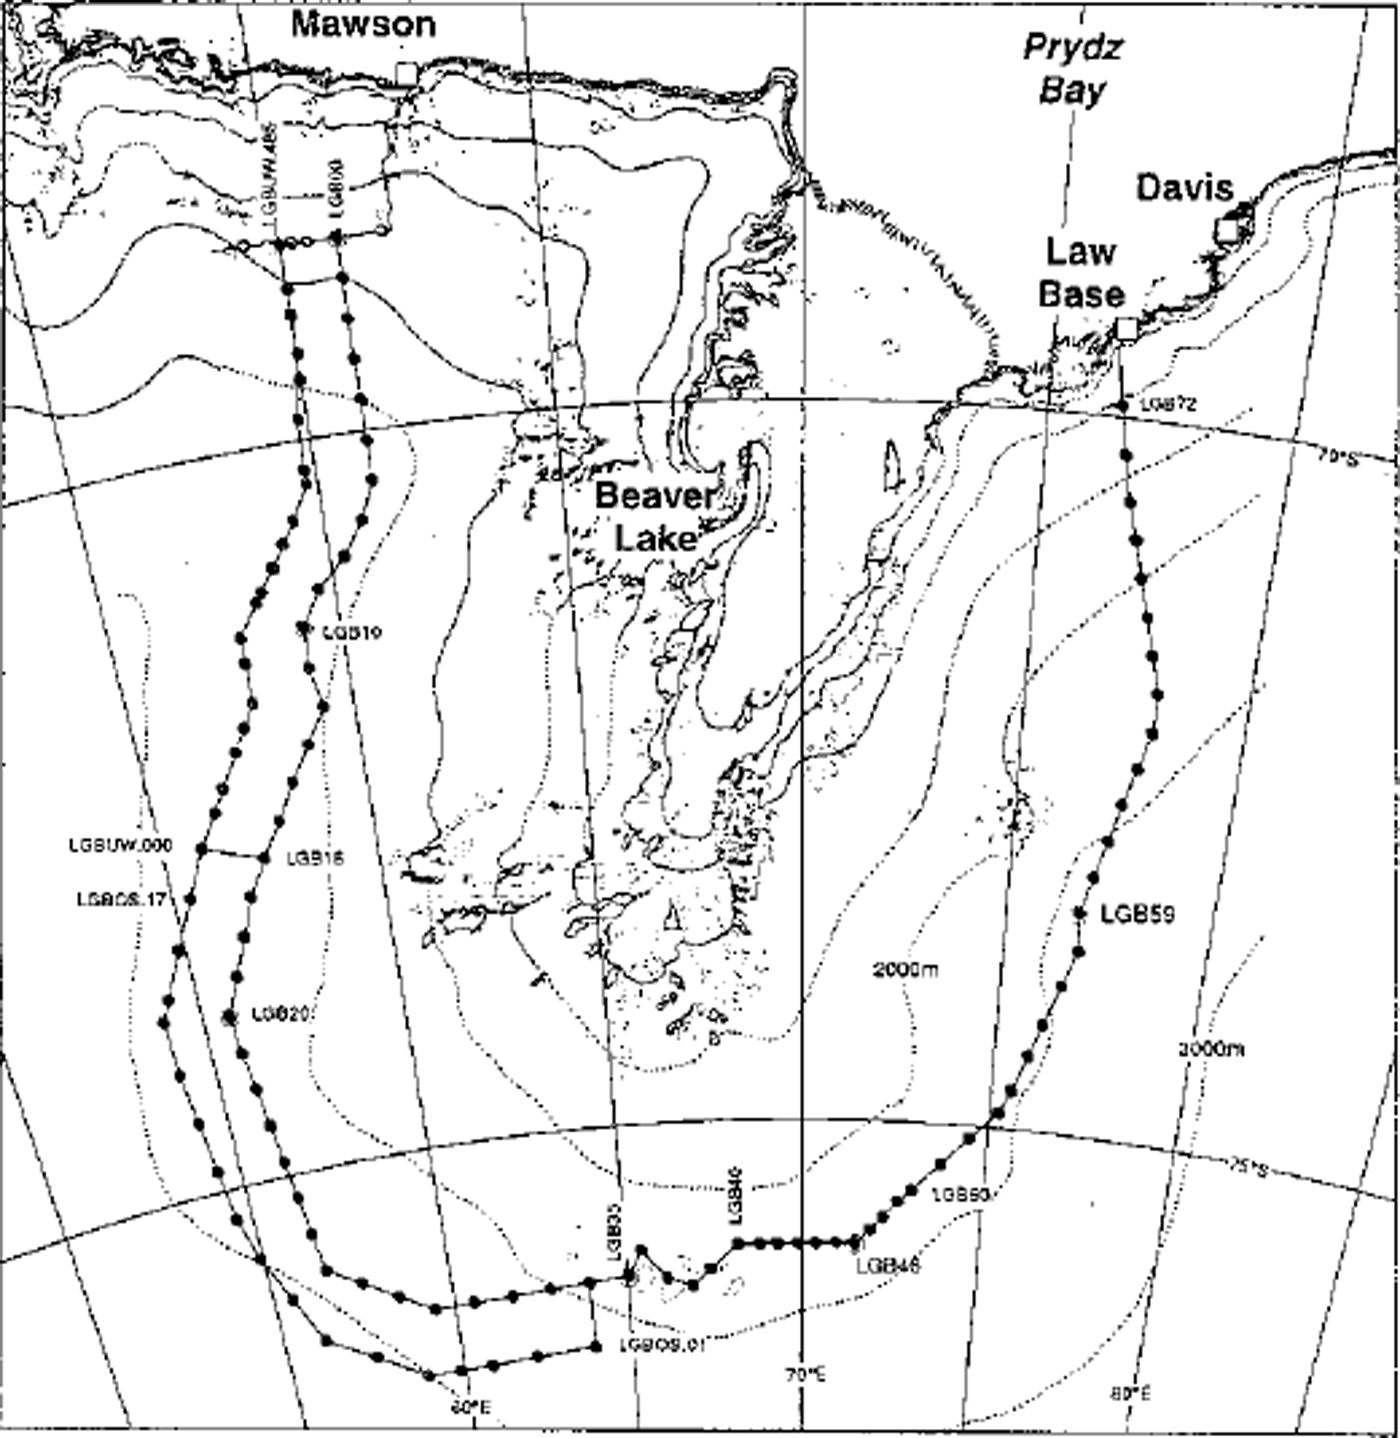
To date, MSA data for snow and ice cores in Antarctica are concentrated on the coastal areas and are rather sparse. During the 1992-93 Australian National Antarctic Research Expeditions (ANARE) Lambert Glacier basin (LGB) traverse program, a 2.7 m snow pit was sampled at station LGB16 (Fig. 1). Based on the analysis of snow-pit samples, this paper focuses on (1) understanding the range and seasonal pattern of MSA and non-sea-salt SO4 2- (nssSO4 2-), (2) the effect of volcanoes on the nssS042- record, and (3) the relationship of MSA with sea-ice extent and El Niño-Southern Oscillation (ENSO) events.

Fig. 1 Map of Antarctica, showing locations mentioned in text.
Sampling Sites and Analytical Procedure
A 2.7 m snow pit was excavated at LGB16 (72.8° S, 57.3° E) in the Lambert Glacier basin, East Antarctica (Fig. 1), on 13 January 1993 (Reference Jiawen, Junying and DaheRen and others, 1998). The sampling site, about 650 km from the coast, was at approximately 2690ma.s.l. The mean snow accumulation was 110 kg m–2 a–1 (corresponding to 25.7 cm snow a−1), and the 10 m firn temperature was approximately -42.9°C. The prevailing winds at this location are continental in origin, predominantly from the south. The annual wind speed is about 7-8 m s−1, which is substantially less than on the coast (about 10-12 ms−1) (Reference Higham and CravenHigham and Graven, 1997). The snow pit was sampled at 3 cm intervals, which resulted in about eight samples per year. To prevent contamination of the samples, the collector wore pre-cleaned gloves and a mask. After the snow pit was dug, the stratigraphic profile was first recorded, then the leeward wall of the snow pit was scraped clean for sampling. Samples were directly collected into pre-cleaned polyethylene containers for shipment back to Lanzhou, China. Samples were stored frozen at-15°C, and were melted immediately before analysis.
Analyses were carried out for anions (Cl-, NO3 –, SO4 2–) and cations (Na+, NH4 +, K+, Mg2+, Ca2+) prior to this study (Reference Jiawen, Junying and DaheRen and others, 1998). The MSA analyses were carried out using a Dionex Model DX-300 instrument equipped with an ASH analytical column, an AG11 guard column, anion self-regenerating suppressor and sodium hydroxide eluant (personal communication from S. I. Whitlow, 1996). All measurements were conducted at the Laboratory of Ice Core and Cold Regions Environment, Lanzhou Institute of Glaciology and Geocryology. The analytical uncertainty was estimated at 10% or less.
For aerosol species, the main deposition processes are considered to be wet deposition, dry deposition and fog deposition (Reference Davidson, Bergin, Kuhns, Wolff and BalesDavidson and others, 1996). Both model and experimental estimates suggest that dry deposition and fog deposition are minor contributors to the annual flux for coastal Antarctica, and the key deposition process is wet deposition (Reference Wolff, Hall, Mulvaney and PasteurWolff and others, 1998). Experiments at Summit, Greenland, also suggest that wet deposition is responsible for the bulk of mass deposition of several chemical species onto the ice sheet. For MSA, SO4 2- and Na+, wet deposition accounts for an average of 64% of total deposition (Reference Davidson, Bergin, Kuhns, Wolff and BalesDavidson and others, 1996). Although no experiments on relative contribution of deposition processes have been carried out in the Lambert Glacier basin, we assume that wet deposition is a dominant process contributing to the annual flux in this region. Therefore, we use the concentrations of sodium, sulphate and MSA in the snow as proxies for focal atmospheric concentration of these species in this study.
The sea-ice data were obtained from the U.S. Navy/U.S. National Oceanic and Atmospheric Administration satellite maps of the northern limit of the sea-ice extent. The records of sea-ice extent were compiled byT.H. Jacka. They are available via the internet at http://www.antcrc.utas.edu.au/∼jacka/climate.html and include the distance from the South Pole to the ice edge at every 10° of longitude, with one map for each month from 1973 through 1997. The sea-ice area for each month was determined by calculating the area for each 10° wedge, summing them and then subtracting the area of the Antarctic continent. The monthly sea-ice area for the South Indian Ocean sector was determined by using the distance to the ice edge from 40° to 90° E longitude.
Results and Discussion
Dating
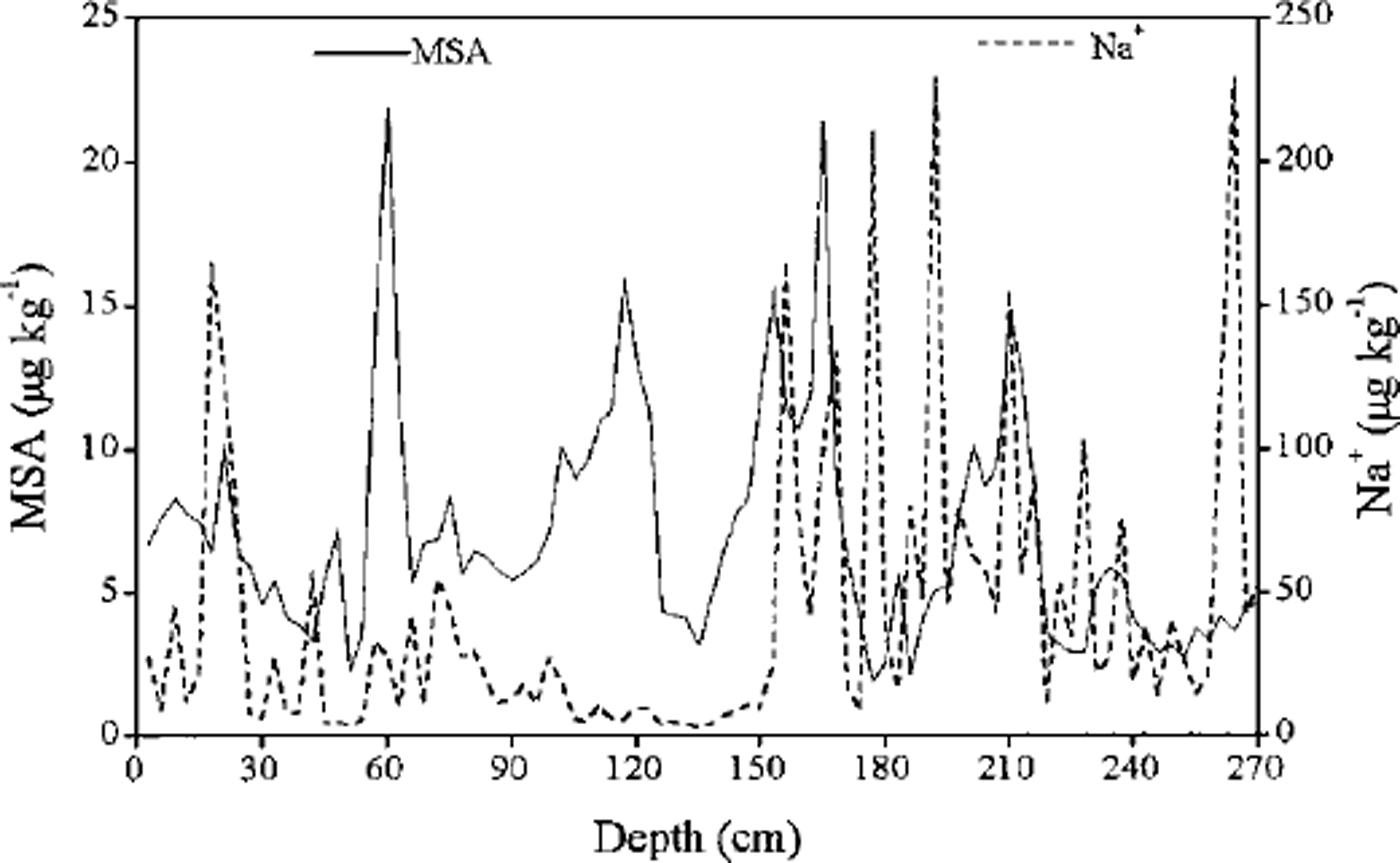
It is well known that MSA exhibits a consistent and strong seasonal cycle, with maxima in the summer and minima in the winter, in aerosol and surface snow samples from Antarctica (Reference MinikinMinikin and others, 1998). However, MSA concentrations from the deeper sections of a Dolleman Island ice core (Reference Mulvaney, Pasteur, Peel, Saltzman and WhungMulvaney and others, 1992) demonstrate well-defined seasonal maxima in winter rather than summer, and are out of phase with nssSO4 2- concentrations maxima, which suggests that MSA migrates out of the layers of snow with relatively high SO4 2- concentrations and into adjacent layers rich in sea salt. Ice cores from the Dyer Plateau and Gomez Nunatak (Reference Mulvaney, Pasteur, Peel, Saltzman and WhungMulvaney and others, 1992), however, have MSA and nssSO4 2– concentration maxima in summer. A similar pattern is reported for MSA in Antarctic ice cores from Law Dome (Reference Ivey, Davies, Morgan and AyersIvey and others, 1986; Reference Curran, van Ommen and MorganCurran and others, 1998). The profiles of MSA and Na+ do not show a clear relationship in our snow pit (Fig. 2). Generally, MSA and Na+ concentration maxima do not coincide, so we assume that post-depositional migration of MSA is negligible. We thus assign MSA maxima to summer periods. Using MSA variations for dating, our snow samples cover the time period 1981-92, which is the same as that assigned by stratigraphic observations (Reference Jiawen, Junying and DaheRen and others, 1998). This suggests that our assumption of summer MSA maxima is valid for this snow pit.

Fig. 2. Concentration of MSA and Na+ vs depth for snow-pit samples collected at LGB16.
nssSO4 2– calculations
Using sodium concentration as an indication of sea-salt content, the nssSO4 2– concentrations are commonly calculated by
Negative nssSO4 2– concentrations were first reported by Reference GjessingGjessing (1984) for firn-core samples from the Riiser-Larsen Ice Shelf and by Reference Wagenbach, Gorlach, Moser and MunnichWagenbach and others (1988) at Neumayer for winter aerosol samples. This phenomenon was also observed in firn cores from the Antarctic Peninsula (Reference Mulvaney, Pasteur, Peel, Saltzman and WhungMulvaney and others, 1992) and the Filchner-Ronne Ice Shelf (Reference Minikin, Wagenbach, Graf and KipfstuhlMinikin and others, 1994), and in aerosol and fresh-snow samples from Neumayer, Halleyand Dumont d’Urville (Reference WagenbachWagenbach and others, 1998). The negative nssSO4 2– concentration may be due to the occurrence of significant sulfate depletion in the aerosol compared to the sea-water ratio, due to the low temperature as a result of Na2SO4. 10H2O precipitation during the freezing of sea water (Reference WagenbachWagenbach and others, 1998). It is noteworthy that the calculated negative nssSO4 2– values in snow and aerosol are common in the coastal regions during the winter months. We assume no fractionation of sea-salt Na+ and SO42- during transport to the ice sheet, because no year-round aerosol samples allow us to estimate the fractionated sulfate/sodium ratio of aerosol in the study area.
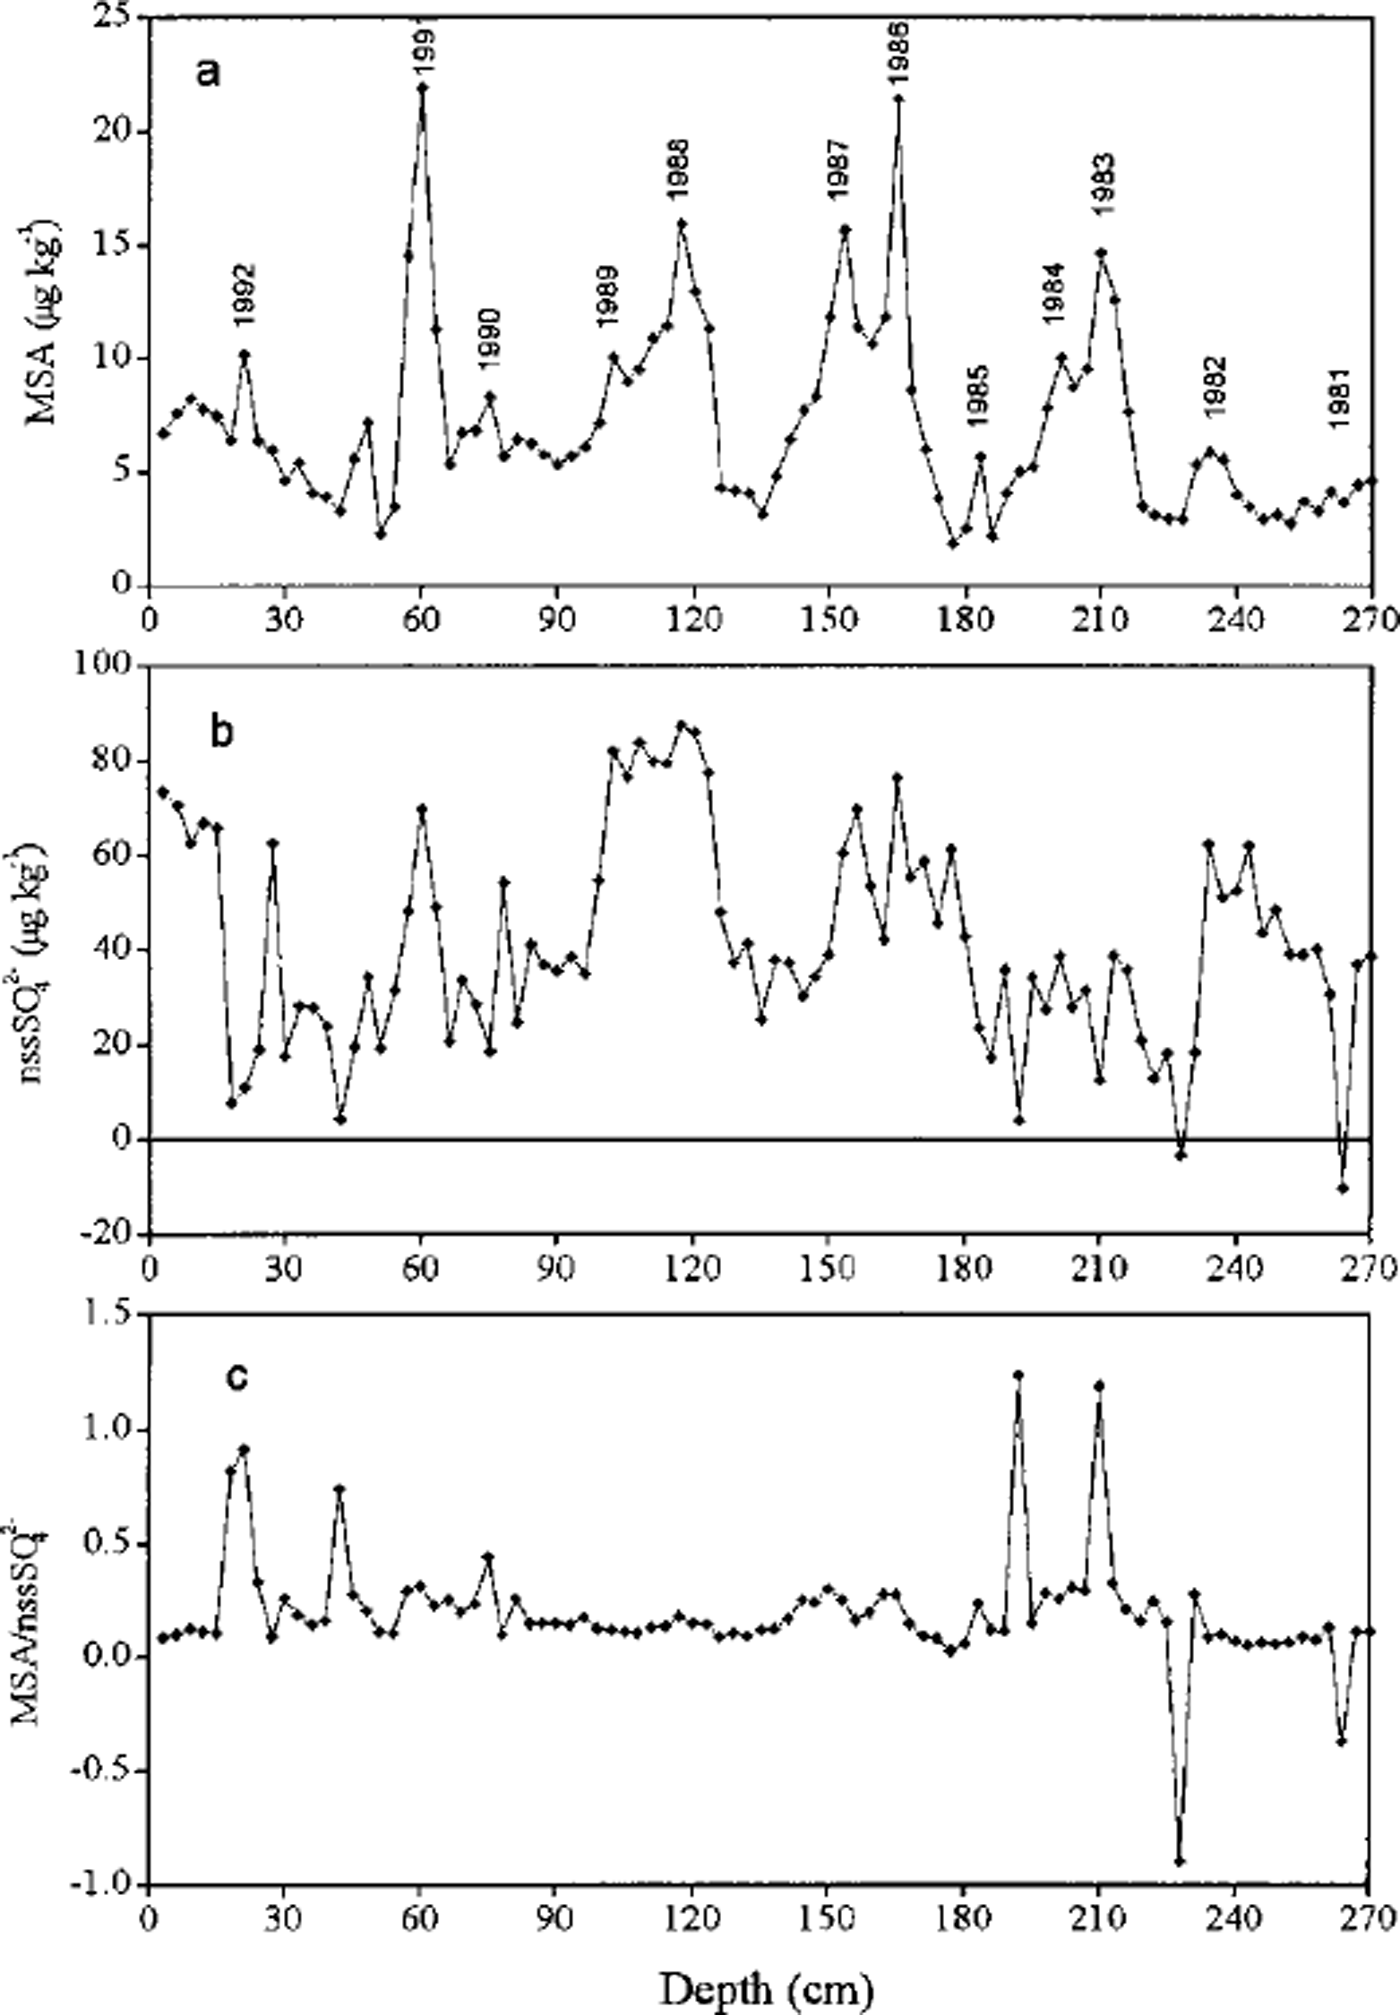
Negative values of nssS42- were calculated for depths of 228 cm (-3.8μkg−1) and 264 cm (-10.6μkg−1) (Fig. 3). This small number of negative nssSO4 2– values suggests that sulfate fractionation is not large during sea-salt aerosol production and transport to this site.

Fig. 3. Profiles of (a) MSA and (b) nssSO4 2–, and (c) their mass ratio with depth in the snow pit at LGB16.
MSA and nssSO4 2– profiles
Concentrations of MSA and nssSO4 2– and their mass ratio vs depth are shown in Figure 3. The seasonal pattern of MSA is clearer than that of nssSO4 2–, which attains maxima presumably during summer as a result of elevated marine biogenic production (Reference Saigne and LegrandSaigne and Legrand, 1987; Reference Legrand and Feniet-SaigneLegrand and Feniet-Saigne, 1991; Reference Pasteur, Mulvaney, Peel, Saltzman and WhungPasteur and others, 1995). The concentration of MSA ranges from 1.9 to 22.0 μgkg−1, with a mean of 7.0 ±4.0 μg kg−1, while the total sulfate ranges from 18.9 to 114.5 Mg kg"1 with a mean of 52.6 ± 21.4 μkg−1. On average, MSA accounts for about 12% of total sulfur deposition (MSA + SO4 2-) and thus is a relatively minor contributor. The mean value and the range of MSA concentrations are in good agreement with those measured at Law Dome, Antarctica (Reference Ivey, Davies, Morgan and AyersIvey and others, 1986), at South Pole in snow for 1922-80 (Reference Legrand and Feniet-SaigneLegrand and Feniet-Saigne, 1991) and in snow over the International Trans-Antarctic Expedition route where MSA concentrations vary from 1.0 to 28.7 μgkg−1 (Reference DaheQin, 1995). The mean MSA concentrations at LGB16 are approximately one-half of those in snow at the Filchner-Ronne Ice Shelf (Reference Minikin, Wagenbach, Graf and KipfstuhlMinikin and others, 1994) and are much lower than those recorded in snow at Dolleman Island (Reference Mulvaney, Pasteur, Peel, Saltzman and WhungMulvaney and others, 1992), but a little higher than those in snow/ice at Dome C and Vostok during the Holocene (Reference Legrand, Feniet-Saigne, Saltzman, Germain, Barkov and PetrovLegrand and others, 1991). The nssSO4 2– varies from 0 to 87.6 ^gkg−1, with a mean of 42.5 ± 20.7 (ignoring the two negative values), and on average explains about 80% of the total sulfate in the snow pit. At South Pole, nssSO4 2– accounts for > 90% of the total sulfate (Reference Whitlow, Mayewski and DibbWhitlow and others, 1992) whereas it accounts for about 70% at Dolleman Island and Gomez Nunatak (Reference Mulvaney, Pasteur, Peel, Saltzman and WhungMulvaney and others, 1992). This suggests that nssSO4 2– becomes more dominant towards the interior of the Antarctic continent.
The mean mass ratio of MSA to nssSO4 2– is 0.176, which is very close to the ratio of 0.18 observed at South Pole (Reference Dibb and WhitlowDibb and Whitlow, 1996) but much higher than that observed (0.06-0.07) in the low to mid-marine atmosphere (Reference Saltzman, Savoie, Prospero and ZikaSaltzman and others, 1986). The ratio of MSA to nssSO4 2– in snow for the period 1981-92 is more stable than the MSA record, which suggests that there has been little change in the location and relative magnitudes of the sources of MSA and nssSO4 2– transported to this location during 1981-92.
Volcanoes and the nssSO4 2– record
Explosive volcanic eruptions inject a large quantity of dust and gases (including S02) into the atmosphere and often into the stratosphere. This SO2 is oxidized to form sulfuric acid aerosol particles, which can be spread globally via atmospheric circulation to then be recorded in polar snow as high nssSO4 2– concentrations and high acidity (Reference Legrand and DelmasLegrand and Delmas, 1987; Reference Dibb and WhitlowDibb and Whitlow, 1996; Reference Cole-Dai, Mosley-Thompson and ThompsonCole-Dai and others, 1997b).
In the period 1981-92, there were three eruptions that likely influenced the SO2 content of the atmosphere over Antarctica. The eruption of El Chichon (17.3° N, 93.2° W) in April 1982 loaded 7 ± 2Mt of SO2 (Reference Bluth, Doiron, Schnetzler, Krueger and WalterBluth and others, 1992) to levels as high as 20-26 km into the atmosphere (Reference SeftorSeftor and others, 1997). The 1991 Pinatubo eruption (15.14° N, 120.35° E) in the Philippines emitted an estimated 18 ± 2 Mt of SO2 (Reference KruegerKrueger and others, 1995), which was oxidized to 28 Mt of aerosol sulfuric acid in the stratosphere within the following two months (Reference Cole-Dai, Mosley-Thompson and ThompsonCole-Dai and others, 1997b). The August 1991 eruption of Mount Hudson (45.92° S, 73.0° W) in Chile was much smaller, emitting an estimated 1.5 Mt of SO2 (Reference Doiron, Bluth, Schnetzler, Krueger and WalterDoiron and others, 1991). But the Hudson eruption was much closer to Antarctica than the Pinatubo eruption. Thus, the Hudson volcanic aerosol began to appear over South Pole in September 1991 and disappeared by the end of January 1992, whereas the Pinatubo volcanic aerosol began to spread poleward in late August or early September 1991 and covered the entire globe by mid-1992 (Reference Cacciani, di Girolamo, di Sarra, Fiocco and FuaCacciam and others, 1993; Reference Hitchman, McKay and TrepteHitchman and others, 1995)
It typically takes 1 or 2 years for stratospheric volcanic sulfate to be transported from the low latitudes to Antarctica (Reference Cole-Dai, Mosley-Thompson and ThompsonCole-Dai and others, 1997a). During the 2 years following the 1982 El Chichon eruption, nssSO4 2- in snow at LGB16 was below the mean nssSO4 2- concentration in this snow pit. This suggests that the El Chichon signal was not detected in snow at this site. Increased concentration of nssSO4 2- in snow from late 1991 and after mid-1992 would be expected, due to the contributions of the Hudson and Pinatubo eruptions, respectively (Reference Cole-Dai, Mosley-Thompson and ThompsonCole-Dai and others, 1997b). The nssSO4 2- concentration in 1992 snow at LGB16 is elevated compared to the mean concentration, but similar to that observed in 1988-89, when no large volcanoes erupted. Thus, we believe that our nssSO4 2- record shows no significant perturbation due to the Hudson eruption. We cannot make a definitive conclusion regarding the effect of the Pinatubo eruption on our nssS04 2- record, since it extends only to 1992.
The volcanic eruptions of El Chichon, Hudson and Pinatubo are recorded in nssSO4 2- in the snow at South Pole (Reference Legrand and Feniet-SaigneLegrand and Femet-Saigne, 1991; Reference Dibb and WhitlowDibb and Whitlow, 1996; Reference Cole-Dai, Mosley-Thompson and ThompsonCole-Dai and others, 1997b). Moreover, Reference Cole-Dai, Mosley-Thompson and ThompsonCole-Dai and others (1997b) differentiated the Pinatubo eruption layer from the Hudson eruption layer using tephra particles as a tracer. However, the 1982 El Chichon nssSO4 2- signal was not detected in the Siple and Dyer ice cores (Reference Cole-Dai, Mosley-Thompson and ThompsonCole-Dai and others, 1997a). Similar results were reported for the Dolleman ice core (Reference Peel and MulvaneyPeel and Mulvaney, 1992) and a james Ross Island firn core (Reference Aristarain, Delmas and BriatAnstarain and others, 1982). Reference Legrand and DelmasLegrand and Delmas (1987) reported that the Agung volcanic SO4 2– signal is better defined in central Antarctic areas (Vostok, Dome C and South Pole) than in more coastal areas (D80), although the volcanic SO4 2- signal is smoothed at Siple station. It seems that volcanic SO4 2- signals are clearer in snow at low-accumulation inland sites than at high-accumulation sites near the coast such as LGB16.
ENSO, sea-ice extent and MSA record
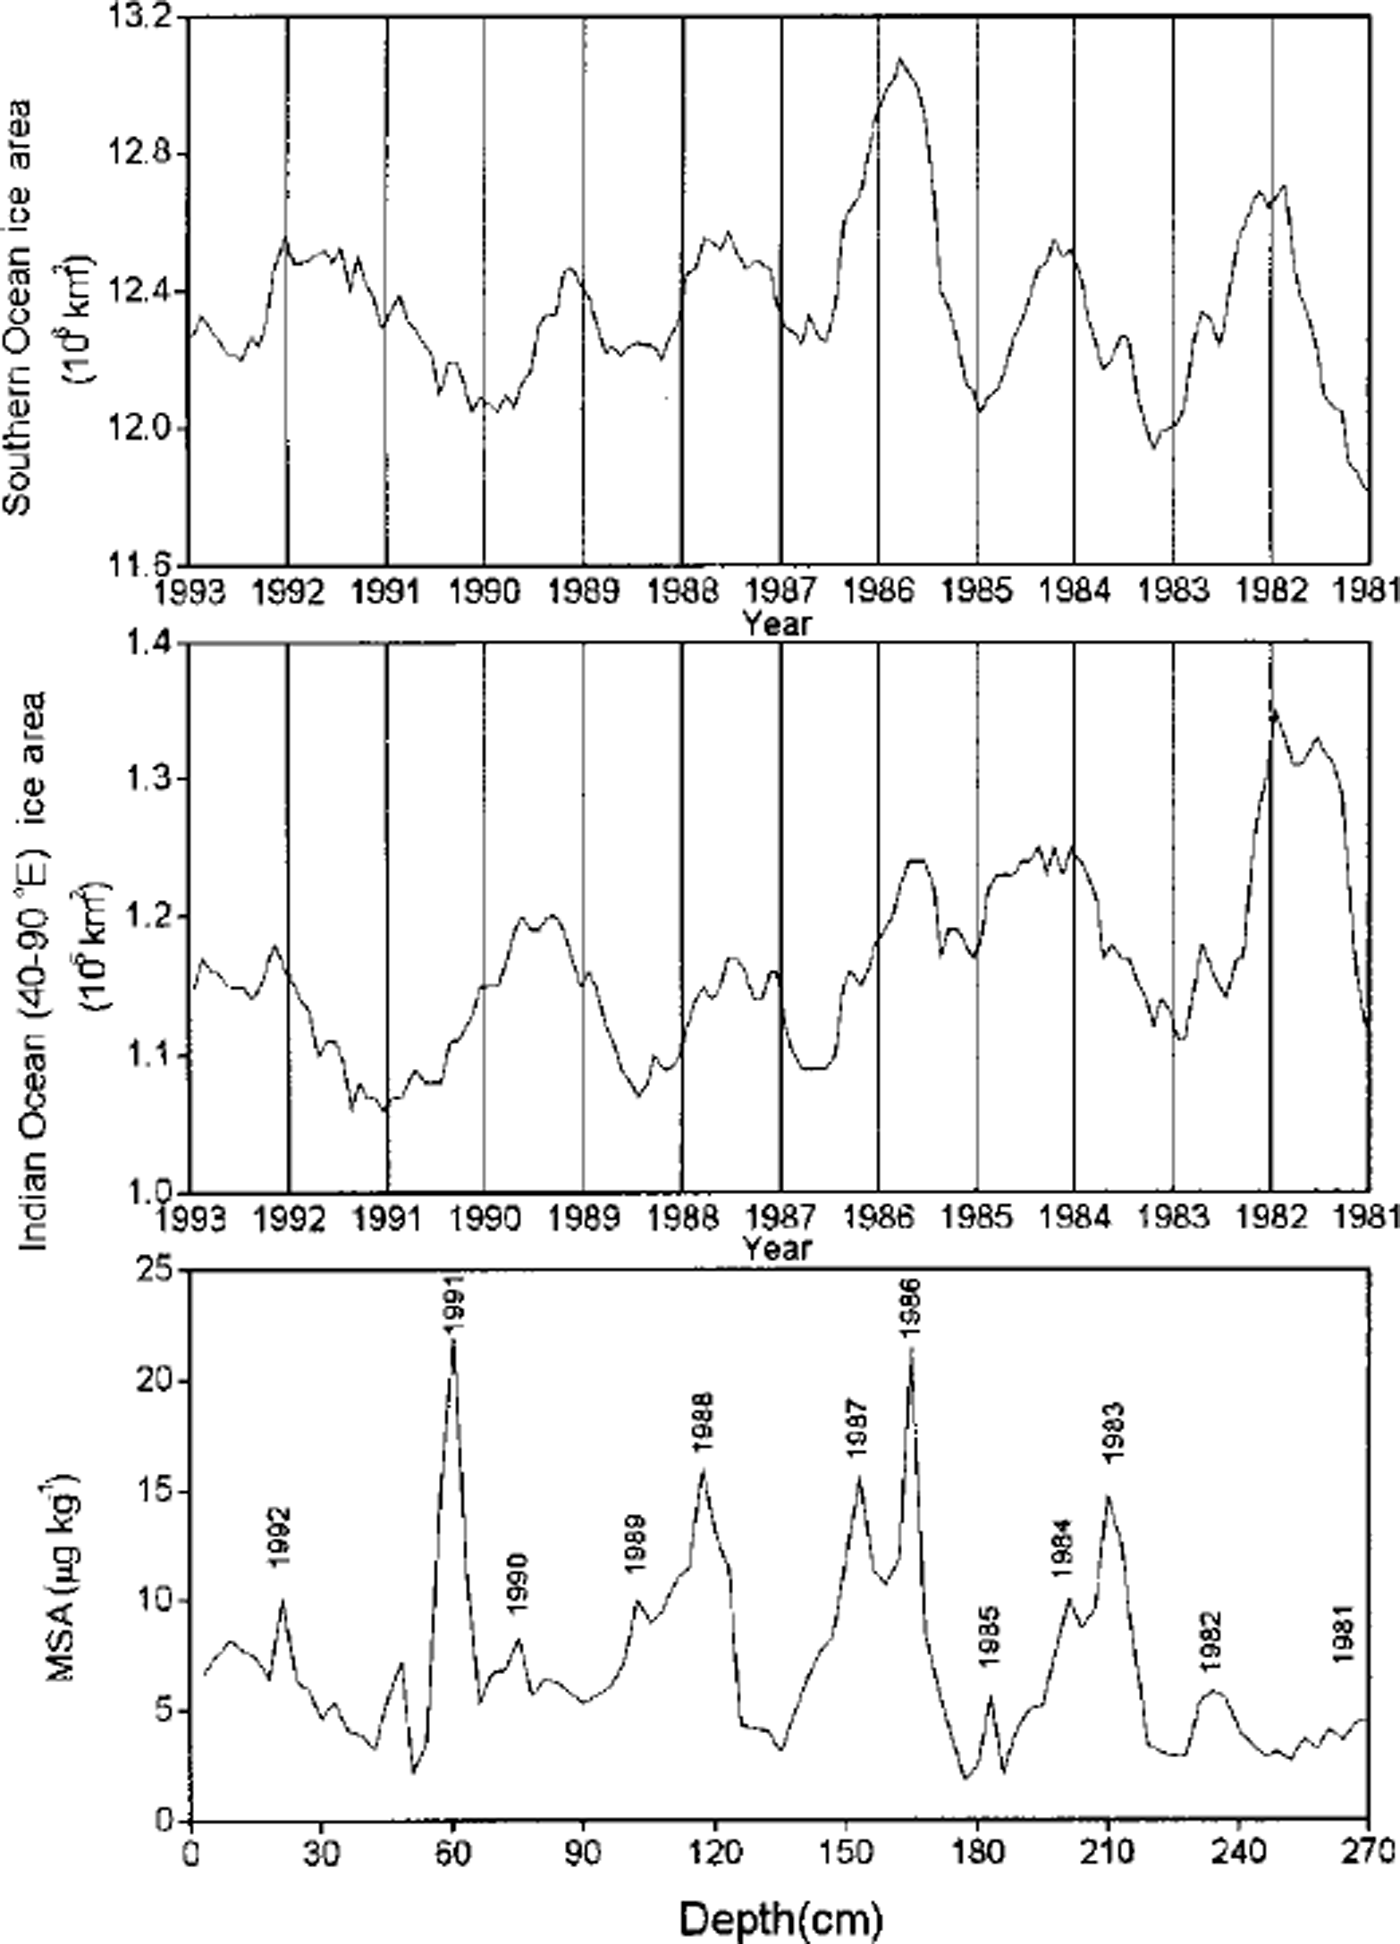
MSA and SO2 (which is oxidized to nssSO4 2- in the atmosphere) are two major oxidation products (Reference Hatakeyama, Isumi and AkimotoHatakeyama and others, 1985) of DMS, a sulfur gas derived from the metabolism of some types of marine phytoplankton in the ocean (Reference Welch, Mayewski and WhitlowWelch and others, 1993). Unlike nssSO4 2-, MSA is exclusively derived from the oxidation of DMS. Thus, MSA in ice cores has been used as a proxy of biological production in the Southern Ocean (Reference Saigne and LegrandSaigne and Legrand, 1987). Reference Welch, Mayewski and WhitlowWelch and others (1993) found a positive relationship between MSA in a snow pit on Newall Glacier and the sea-ice area of the Ross Sea and the Southern Ocean. High MSA concentrations in a South Pole firn core are closely correlated to major ENSO events (Reference Legrand and Feniet-SaigneLegrand and Feniet-Saigne, 1991). However, the MSA records in ice cores drilled on Dolleman Island on the east coast of the Antarctic Peninsula show a small and significant anticorrelation with sea-ice duration recorded at Scotia Bay, Laurie Island in the South Orkney Islands, and no significant link with El Niño events (Reference Pasteur, Mulvaney, Peel, Saltzman and WhungPasteur and others, 1995). We have compared our snow-pit MSA record with the sea-ice area record for the Southern Ocean and the South Indian Ocean sector between 40° and 90° E (Fig. 4). There is no relationship between our mean annual MSA concentrations and the mean annual sea-ice areas for the Southern Ocean (r = -0.08), but there is significant anticorrelation (r = -0.67, confidence level 95%) between mean annual MSA concentrations and mean annual sea-ice areas for the South Indian Ocean sector between 40° and 90° E. Over the 1981-95 time period, ENSO events occurred in 1982-83, 1986-87-88 and 1990-95, of which the 1982-83 event is the strongest (Reference AsselAssel, 1998), while the 1990-95 event is the longest on record during this century (Reference Trenberth and HoarTrenberth and Hoar, 1996). According to the multivariate ENSO index, ENSO in late 1982 is stronger than in 1991, which is stronger than in 1986. MSA concentration in snow shows no clear relationship with the timing and strength of the ENSO events. The anticorrelation of MSA concentration and sea-ice extent in the South Indian Ocean sector suggests that low sea-ice cover may favor biological production of DMS, hence MSA, in this region.

Fig. 4. MSA concentrations vs depth, and sea-ice areas for the Southern Ocean and the South Indian Ocean sector (40-90° E) vs tine. Since the amplitude of the seasonal change in sea ice is much larger than theyear-to-year variability, records 4sea-ice area were smoothed using a 12 month running mean to compare them visually to the MSA record.
Conclusion
This study has shown that MSA and nssSO4 2- concentrations pose distinct variations in snow from a snow pit in the Lambert Glacier basin. MSA shows clearer seasonal variations than nssSO4 2-. The range of MSA concentration is similar to that reported for other regions in Antarctica, except at Dolleman Island, which is thought to be close to a region of high biological productivity. nssSO4 2- in snow at this site does not record the El Ghichon and Hudson eruption signals which are recorded in the snow at South Pole. This suggests either that the atmospheric circulation does not favor the transport of volcanic SO4 2– from the stratosphere to this site, or that high accumulation rates may dilute the volcanic SO4 2- signal. We observed a significant anticorrelation between MSA concentration in snow and sea-ice area for the South Indian Ocean sector (40-90° E), but no clear relationship between MSA and ENSO events. This suggests that low sea-ice cover favors biological production of DMS in this region.
Acknowledgements
We thank the Australia Antarctic Science Foundation and the Australian Antarctic Division for providing support for one of the authors, Renjiawen, to join the ANARE LGB traverse expedition. We also thank T.H.Jacka for providing the sea-ice records and P. Sedwick and an anonymous reviewer for their useful suggestions. This research was supported by the Chinese Academy of Sciences (KZ951-A1-205), the State Commission of Sciences and Technology of China (98-927-01-05 and 98-927-01-07) and the National Natural Science Foundation of China (49271022).


