Background
It is well established that for polycrystalline ice under no (or very low) stress, the crystal size increases with time at a rate dependent on the temperature (Reference Stephenson and ŌuraStephenson, 1967; Reference GowGow, 1969, Reference Gow1970; Reference BuddBudd, 1972; Reference Gow and WilliamsonGow and Williamson, 1976, for Antarctic ice; Reference HerronHerron, 1982, for Greenland ice; Reference SeligmanSeligman, 1949, Reference Seligman 1950; Reference KambKamb, 1964, for laboratory observations). Results from deep ice cores collected from Byrd Station, Antarctica (Reference Gow and WilliamsonGow and Williamson, 1976), Dome C, Antarctica (Reference Duval and LoriusDuval and Lorius, 1980), Vostok, Antarctica (Reference Korotkevich Ye, Petrov, Barkov, Suchonosova, Dmitriev and PortnovKorotkevich and others, 1978), Law Dome, Antarctica (Reference Young, Xie, Qin and JackaYoung and others, 1985) and Camp Century, Greenland (Reference HerronHerron, 1982) indicate that the increase in crystal size with time and depth can be disturbed by other factors. Several explanations have been offered for these observed crystal-size variations (Reference PatersonPaterson, 1981), and Reference Petit, Duval and LoriusPetit and others (1987) examined the possibility of using the ice-core crystal-size variation as an indicator of past climatic temperatures. Reference Gow and WilliamsonGow and Williamson (1976) proposed that increased shear deformation could have inhibited the expected crystal growth. The results from Cape Folger, Antarctica, given by Reference Russell-Head and BudelRussell-Head and Budd (1979), also show a relation between ice deformation and crystal size varying through the ice-core depth. More recently, marked crystal-size variations have been noted in the new deep ice cores, e.g. at Dye 3, Greenland (Reference Fisher and KoernerFisher and Koerner, 1986) and at DSS on Law Dome, Antarctica (Reference Jun and JackaLi and Jacka, 1994). These crystal-size variations have been associated with the contemporaneous preferred crystal-orientation fabric development and with zones of high shear in the ice sheets.
For laboratory ice-deformation experiments to strain sin excess of ˜15%, it has been observed that, together with the development of a crystal-orientation fabric pattern (which depends on the stress configuration), there are also systematic changes in the mean crystal size, leading to an equilibrium crystal size at high strains (Reference Jacka and MaccagnanJacka and Maccagnan, 1984). Reference JackaJacka (1984) found that the change in mean crystal size could involve a decrease (if the initial crystal size was larger than the equilibrium crystal size) or an increase (if the initial crystal size was smaller than the equilibrium crystal size). Reference Gao and JackaGao and Jacka (1987) further studied this equilibrium crystal-size development. They found that the equilibrium crystal size seemed dependent only on the deformation-test parameters (temperature, stress, stress configuration). It was independent of (i) whether the test specimen was laboratory-prepared or cut from an ice core drilled from a natural ice mass, (ii) whether the ice was initially isotropic or initially anisotropic, although this affected the amount of strain required for the development of the equilibrium size, or (iii) the initial crystal size. Gao and Jacka concluded that, together with the attainment of a constant tertiary strain rate (for constant-stress experiments), the establishment of an unchanging preferred crystal-orientation fabric pattern and an unchanging equilibrium crystal size was indicative of steady-state ice flow.
It is interesting to note that similar results to those outlined above were found by Reference SteinemannSteinemann (1958).Crystal sizes in tertiary creep were determined as a function of stress and temperature by Steinemann for high stresses. In this paper, we use some already published results and some new results to examine further the dependence of steady-state tertiary crystal size on temperature and stress.
Some authors (see, for example, the review by Reference PatersonPaterson (1991)) have proposed that the presence of impurities (both soluble and insoluble) may inhibit crystal growth in natural ice masses. It should be noted that this proposition is not examined in this paper
A Theoretical Approach
Observations from surface snow, firn and ice cores have shown that in the absence of non-hydrostatic stress, the crystal linear dimension D will increase with time t at a temperature θ-dependent rate estimated by the relation (Reference Stephenson and ŌuraStephenson, 1967; Reference GowGow, 1969, Reference Gow1970):
where D 0 is an initial crystal linear dimension, K 0=1.86 × 10⁻²mm2 a1 at 17°C, and the form of f(θ) is discussed later. It follows immediately that the crystal growth rate (the increase in average crystal area within across-section of a sample of polycrystalline ice) under little or no deviatoric stress can be expressed in the form:

For ice that is subject to a non-hydrostatic stress, the relationship between strain rate and deviatoric stress on individual crystals of polycrystalline ice has the same form as that for the bulk sample (Reference WeertmanWeertman, 1983) and can be written:

where τ is the deviatoric stress.
The observations indicate that, in steady-state tertiary creep, the crystal size remains constant while the sample deforms. It is therefore hypothesized that the rate of change of crystal size due to strain is balanced by change due to differential crystal growth or grain-boundary migration. Therefore, equating dD/dt from Equations (1) and (2), and designating the equilibrium linear dimension D e,
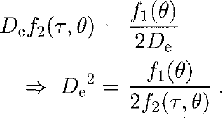
f1(θ) has the form (usually referred to as the Arrheniusrelation):
where Q′ is the activation energy for crystal growth and R is the gas constant.
Equation (2) is an expression for the crystallographic strain rate. The temperature-dependence of this flow law also obeys the Arrhenius relation (Reference GleGlen, 1955), i.e.
where Q″ is the activation energy for ice creep and n is a power-law constant, usually considered equal to 3 for ice in the stress and temperature range under consideration.
From Equation (3), then
It might therefore be expected firstly that at any specified temperature,
and secondly, that if the activation energies for the two processes are similar, the term
will be near I and the temperature dependence on the equilibrium steady-state crystal size will be small.
Reference Weertman, Whalley, Jones and GoldWeertman (1973) observed that the activation energies for these two processes were similar. We now investigate this similarity in more detail with some new data, particularly at temperatures near the melting point.
The Activation Energies For Creep And For Crystal Growth
Activation energies for ice creep at an octahedral stress of 0.1 MPa have been presented by Reference Budd and JackaBudd and Jacka (1989)for the temperature range -0.05° to -50°C. Further ice-creep data at the same stress have been presented since then (Reference MorganMorgan, 1991), from which we can estimate activation energies at temperatures higher than -1°C.
While these data are at one stress of 0.1 MPa, Reference Budd and JackaBudd and Jacka (1989) showed in addition that the minimum strain rate versus temperature plots are parallel, therefore resulting in the same activation energies, over a large range of stress.
Table 1 shows the calculation of ice-creep activation energies from a set of data compiled from Reference Budd and JackaBudd and Jacka (1989) and Reference MorganMorgan (1991). The activation energy is calculated (e.g. Reference PoirierPoirier, 1985) by

where ⋵1 and ⋵2 are steady-state creep (or crystal-growth)rates at two similar temperatures, T 1 and T 2(K), and k = 1.38 ✗ 10-23 J mole-1K-1 is Boltzmann’s constant. Usually, in order to obtain the energy per mole, k is replaced by R (the gas constant) where R = kN and N= 6.024 ✗ 1023 is Avogadro’s number. Thus, R = 8.31.1 J mole-l K-1.
Table 1 Calculation of activation energy for ice creep at minimum strain rate
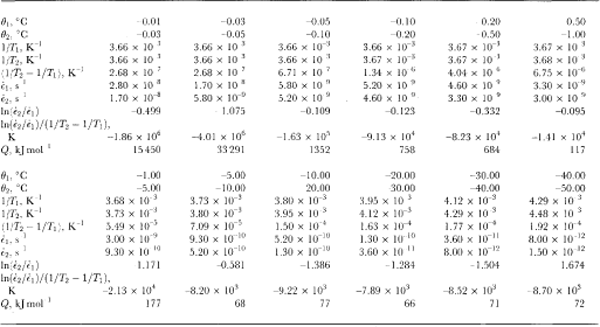
These calculations have been carried out in Table 1 for minimum isotropic creep rates. Minimum creep rates are not steady-state. It seems, however, over a wide range of temperature and stress, that the steady-state tertiary creep is related to the minimum creep rate (for a given stress configuration) by a constant enhancement factor (e.g. Reference Budd and JackaBudd and Jacka, 1989). Thus, the activation energies in steady-state tertiary creep will be similar to those at minimum.
Reference Jun and JackaLi (1994) has carried out a set of laboratory tests to examine ice-crystal growth (under no stress) over the temperature range -0.1°to -5.0°C. Li's test samples were both laboratory-prepared (Reference Jacka and LileJacka and Lilc, 1984) and cut from an Antarctic ice core. Samples were placed in a plastic bag which was then immersed in a silicon oil bath with accurate temperature control. After different time intervals (ranging from days to months), samples were removed, thin sections cut, then replaced for a further time. Thin sections were measured for crystal-size and growth rates calculated for the range of temperatures. Li's calculation of activation energies for crystal growth are shown in Table 2. Also shown in Table 2 are calculations of crystal-growth activation energies for temperatures down to -60°C. These calculations are based on smooth curves through the field data (shown in Figure 1) of Reference Jun and JackaLi(1994) and Reference GowGow (1969).
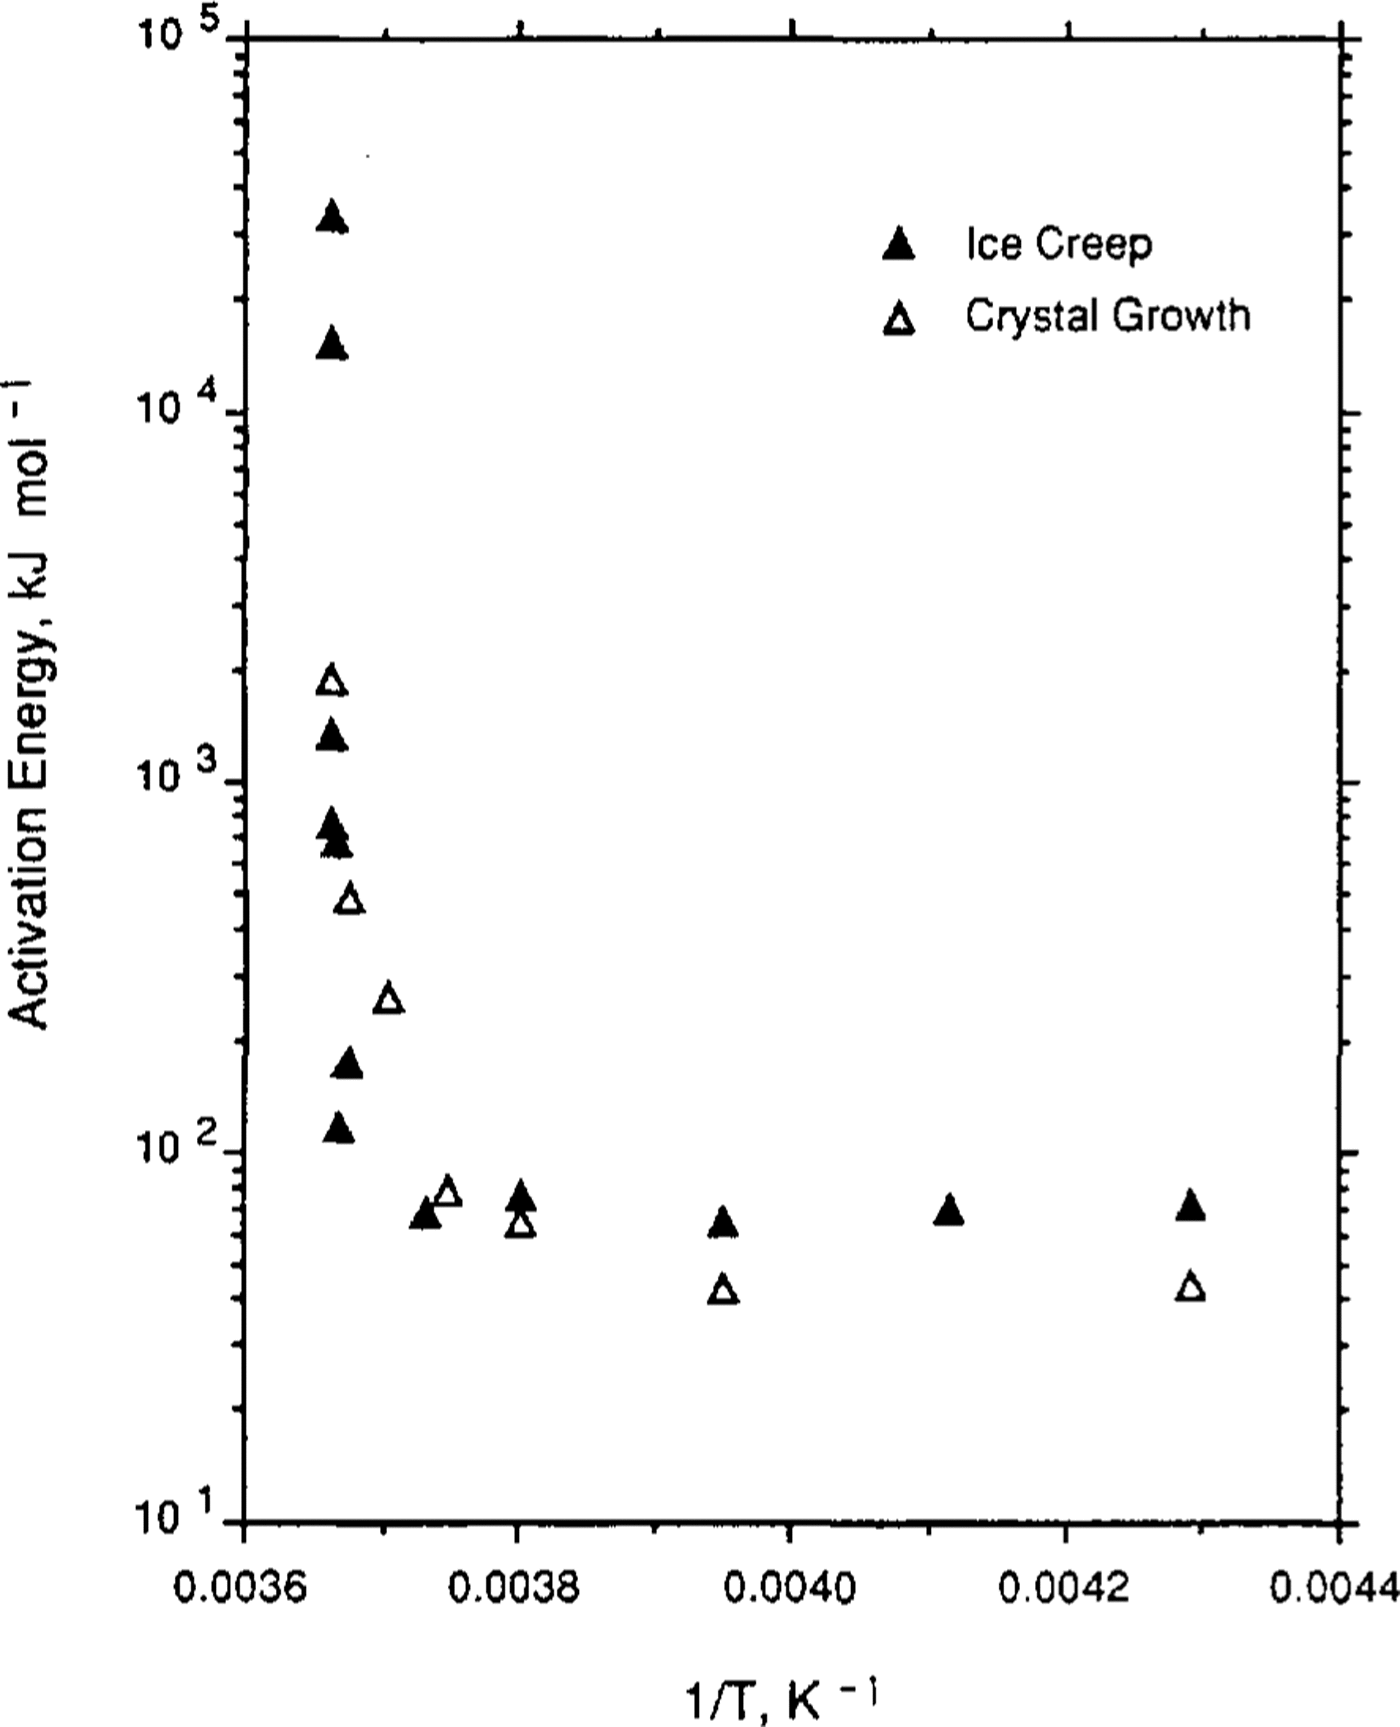
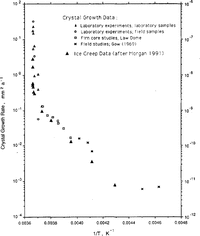
Fig.1 Ice-Crystal growth rates (after Reference GowGow (1969) and Reference Jun and JackaLi(1994)) and creep rates (after Reference MorganMorgan (1991)) as a function of the inverse of the temperature (K) for a range of laboratory and field experiments.
Reference Jun and JackaLi (1994) also examined some field data from Law Dome, Antarctica, and from Reference GowGow's (1969, Reference Gow1970) work. The agreement between the laboratory and the field data is excellent and both are shown in Figure 1, a plot of crystal-growth rate as a function of 1/T where T is ice temperature (K). To compare the shape of the curves, minimum strain rate (after Reference MorganMorgan, 1991) is plotted on the same scale. The similarity of these two data sets, neither of which has been subjected to any smoothing, is remarkable.
Figure 2 is a plot of the two activation energies, also as a function of 1/T. It is seen that the activation energies for the two processes, ice-crystal growth and ice creep appear, over this temperature range, to be particularly similar. It remains now to test the hypothesis that equilibrium steady-state crystal size is a function of stress alone.
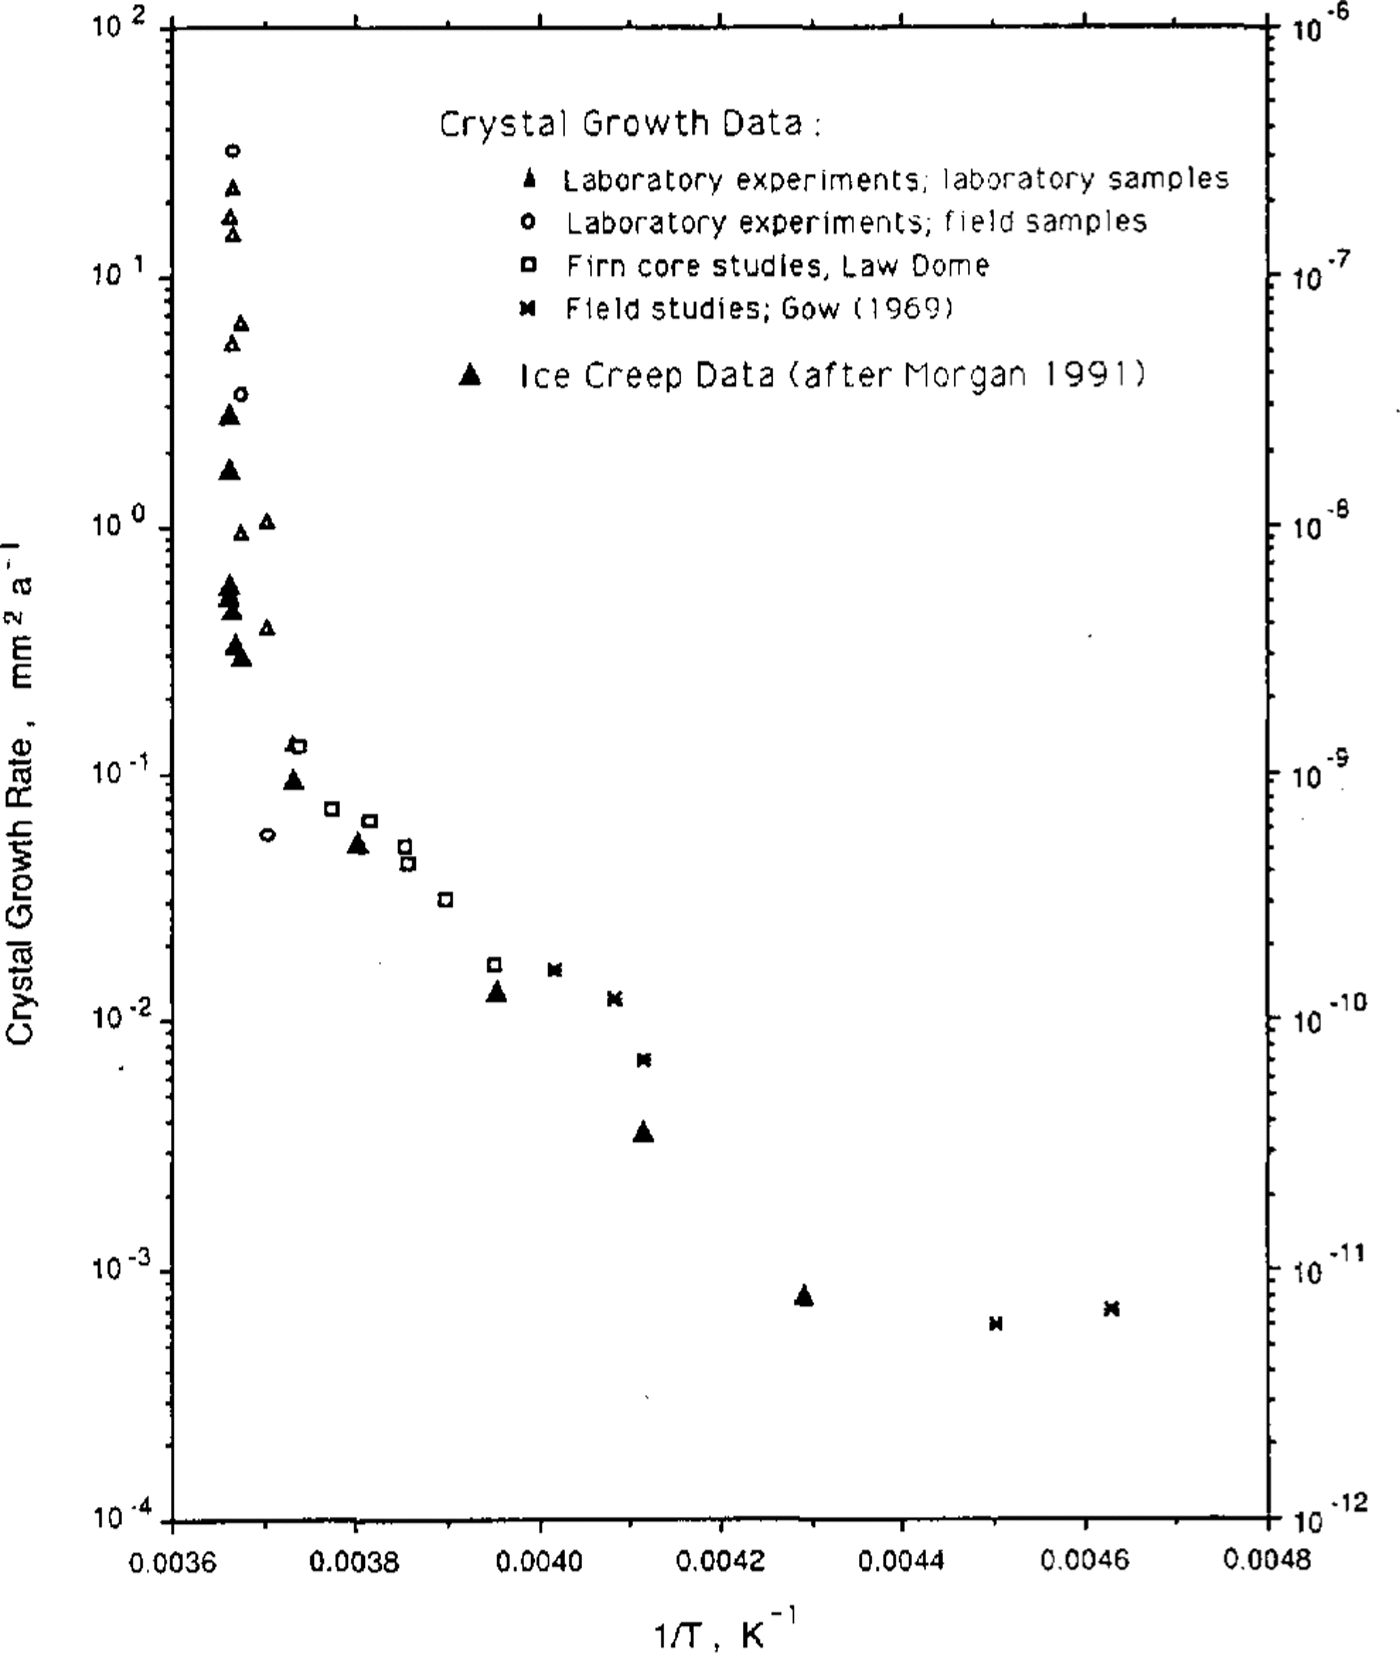
Fig.2 Activation energy for the two processes, ice-crystal growth and ice creep, as a function of the inverse of the temperature (K).
Table 2 Calculation of activation energy for ice-crystal growth

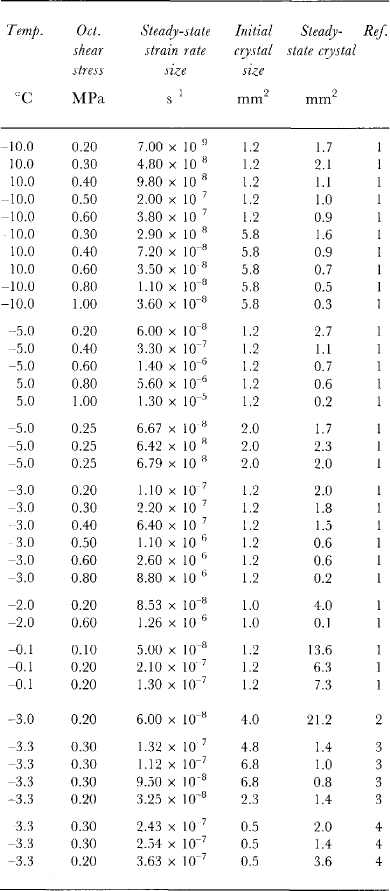
Table 3. Equilibrium stead)i-state crystal size for a range of temperatures, octahedral shear stresses, steady-statetertiary strain rates and initial crystal sizes
References:
-
This study.
-
Reference Gao and JackaGao and Jacka (1987); Law Dome ice-core samples
-
Reference Gao and JackaGao and Jacka (1987); laboratory-prepared samples
Steady-State Crystal Size As A Function Of Stress
Table 3 shows steady-state crystal sizes achieved from several ice-deformation tests carried out in uniaxial compression over a range of stresses and temperatures. For each of these (constant-stress) tests, the total strain exceeded 15% and a constant tertiary creep rate (also shown in Table 3) was achieved. A preferred crystal orientation fabric (for compression, a small-circle girdle pattern) was established for each test.
Figure 3 is a plot on log scales of the square of the equilibrium crystal diameter (from the data of Table 3) as a function of the octahedral shear stress applied for each test. The straight line of Figure 3 has been drawn with a slope of -3. From the plot, there does not appear to be any trend with temperature (over the range -0.10 to-10.0°C) which is indicated by different symbols. Although the variability in the measure of crystal size is large, the plot provides strong support for the dependence of steady-state crystal size on stress alone. Furthermore, the data provide some support for the hypothesized relationship:

Fig.3 Fig.3. The square of the equilibrium steady-state crystal diameter, De, as a function of the octahedral shear stress for a range of ice-creep tests at several different temperatures. The straight line has been drawn with a slope of -3.
However, it is clear from the plot that more data are required to test fully the above relationship. In particular, data are required for crystal sizes greater than ˜10mm2 (requiring lower stresses and therefore extremely long times to attain steady-state ice flow) and for crystal sizes less than ˜0.2 mm2 (i.e. so small that size measurement is particularly difficult). It is expected that the imminent introduction of automatic computer-controlled and microscope-based ice-crystal thin-section analysers will all eviate the problems encountered in the routine and consistent measurement of crystal size.
With the exception of some early work by Reference SteinemannSteinemann(1958), to these authors’ knowledge, a dependence of crystal size on deviatoric stress has not previously been established for ice. However, this phenomenon is not new with respect to other crystalline materials. The relationship
where D is linear crystal dimension, τ is applied stress and r is a constant, has been found for a range of materials, e.g. quartzite, olivine, dunite, pyrite, halite and nickel(Reference PoirierPoirier, 1985), where ˜1.0 ≤ r ≤ ˜1.5. These values of r compare with r = n/2 = 1.5 found here for ice.
On the potential use of steady-state crystal size as a Piezometer
The existence of a relationship between crystal size and stress raises the possibility that crystal size might be useful as an indicator of the deviatoric stress within polar ice masses. While in-situ stress is not able to be directly measured, crystal size is measured routinely in the deep ice cores (e.g. Reference Gow and WilliamsonGow and Williamson, 1976; Reference HerronHerron, 1982; Reference Jun and JackaLi and Jacka, 1994).
Of course, it needs to be recognized that ice in the natural ice masses is not always steady-state and therefore that a relation such as that found here will not be applicable throughout the depth. In the firn layers, where the stress is near zero, the crystal-growth rate has been described by Reference GowGow (1969, Reference Gow1970). This relation also holds in the deep bedrock layers of near-stagnant (i.e. low-stressor, sometimes, stress-relaxation) ice at warmer temperatures where, on occasions, extremely large crystals have been found in ice cores down to bedrock. At intermediate depths, the ice is subject to changing stress, changing stress-configuration and changing temperature as it progresses deeper into the ice sheet. This is evidenced, for example, by variations in crystal-orientation fabric through the deep ice cores. However, the rate of change of these parameters is particularly slow, occurring over hundreds of years, and it must be said therefore that the ice throughout most of the depth of the polar ice sheets is in near-steady-state creep. For most of the depth, therefore, a relationship such as that found here between steady-state crystal size and deviat oric stress may provevaluable. Further work continues on this topic and will be published elsewhere.
Conclusions
On the basis of observations from field and laboratory studies, it is known that ice-crystal size is a result of deformation to high strains. Crystal size seems to be independent of the structural (crystal size and orientation) or deformational (stress, stress-configuration and strain-rate) history. Rather, it is a product of the in-situ contemporaneous conditions.
Under no stress, the mean ice-crystal size increases at a rate dependent on temperature. If a stress is applied, the crystal growth is modified and at large strains, as the ice attains steady-state creep, an equilibrium crystal size is reached. This equilibrium steady-state mean crystal size is considered as a "balance" between the growth as a function of temperature and the deformation due to strain. This approach reveals a dependence of equilibrium crystal size on the ratio of the temperature effects, i.e. of the activation energies for the two processes – ice crystal growth and ice creep. The temperature-dependence for ice creep has been examined by several authors and is now well understood. Similarly, the temperature dependence for ice-crystal growth is well understood. Recent observations of both these processes at temperatures nearer to the melting point (-2.0° to > -0.1 °C), where crystal-growth/deformation rates are higher, have now made it possible to compare these processes in more detail. It appears from the data that the activation energies (i.e. the temperature-dependence) for the two processes are similar. Therefore, that the dependence of steady-state crystal size on temperature is small, and that crystal size is a function of deviatoric stress alone. Furthermore,
where n is the power-law constant. The value of n has also been the subject of much study and is generally accepted to have a value of 3. The experimental data of steady-state crystal size as a function of stress provides support for this relation. A dependence similar to that above, of crystal size on stress, is known for other crystalline minerals and values of r for these minerals have generally been found empirically to be in the same range as found here for ice.
The use of crystal size in natural ice masses as a piezometer may prove particularly valuable as a glaciological tool for investigations of the dynamics of the polar ice sheets. This is the subject of investigations currently in progress.


