1. Introduction
The spatial heterogeneity of sea ice has been studied in polar and subpolar areas (e.g. Reference Gosselin, Legendre, Therriault, Demers and RochetGosselin and others, 1986; Reference Eicken, Lange and DieckmannEicken and others, 1991; Reference Swadling, Gibson, Ritz and NicholsSwadling and others, 1997; Reference S., Kühl, Glud and HansenRysgaard and others, 2001; Reference Granskog, Kaartokallio, Kuosa, Thomas, Ehn and SonninenGranskog and others, 2005b), and sea-ice properties have been shown to vary on scales from <1m (Reference Tucker, Gow and RichterTucker and others, 1984; Reference Spindler, Dieckmann, Lange, Kerry and HempelSpindler and others, 1990; Reference Eicken, Lange and DieckmannEicken and others, 1991) to many kilometres (e.g. Reference Gosselin, Legendre, Therriault, Demers and RochetGosselin and others, 1986; Reference Swadling, Gibson, Ritz and NicholsSwadling and others, 1997).
On a large scale, the horizontal distribution of sea-ice algae has been attributed to latitudinal gradients in solar irradiance (Reference Cota and SmithCota and smith, 1991) and differences in ice growth processes resulting in a varying ice structure (Reference Clarke and AckleyClarke and ackley, 1984; Reference Eicken, Lange and DieckmannEicken and others, 1991). small-scale patchiness of ice algal productivity was found to be largely influenced by snow cover (Reference Gosselin, Legendre, Therriault, Demers and RochetGosselin and others, 1986; Reference Grossi, Kottmeier, Moe, Taylor and SullivanGrossi and others, 1987) which is the main factor controlling under-ice irradiance (Reference G.A. and HornerMaykut, 1985; Reference Palmisano, Soohoo, Moe and SullivanPalmisano and others, 1987). local differences in brine drainage, stability of brine-channel surfaces and exchange processes across the ice–water interface may also cause small-scale variability of ice-associated algae (Reference Krembs, Mock and GradingerKrembs and others, 2001, Reference Krembs, Tuschling and Juterzenka2002). in addition, variability of ice algal biomass can be influenced by other factors such as nutrient availability (Reference Gosselin, Legendre, Demers and IngramGosselin and others, 1985, Reference Gosselin, Legendre, Therriault and Demers1990) and the hydrographic regime of the underlying water column (e.g. stratification, salinity, currents) (Reference Monti, Legendre, Therriault and DemersMonti and others, 1996; Reference Robineau, Legendre, Kishino and KudohRobineau and others, 1997; Reference Granskog, Kaartokallio, Thomas and KuosaGranskog and others, 2005a).
Since sea-ice samples are usually obtained as point data, any attempts to extrapolate these point data to a larger area may be rendered inaccurate if the investigated parameters exhibit considerable patchiness on a small scale and the magnitude of this spatial variation is not known (Reference Eicken, Lange and DieckmannEicken and others, 1991). thus, the estimation of spatial variability helps to increase confidence in extrapolation and allows identification of the spatial scales at which variation is significant and where sampling effort should be concentrated (Reference Andrew and MapstoneAndrew and mapstone, 1987; Reference Morrisey, Howitt, Underwood and StarkMorrisey and others, 1992; Reference Swadling, Gibson, Ritz and NicholsSwadling and others, 1997).
While spatial variability of sea-ice properties was investigated by several studies in the arctic and antarctic, in the baltic sea the topic has only recently been addressed (Reference Granskog, Kaartokallio, Kuosa, Thomas, Ehn and SonninenGranskog and others, 2005b). since baltic sea ice differs substantially from polar sea ice, dedicated variability studies are needed to determine the patchiness of sea ice in this area and to support large-scale evaluation of the contribution of sea ice to the annual primary production in the baltic sea.
In comparison to polar sea ice, baltic sea ice is generally thinner and features considerably lower salinities and brine volumes due to the brackish nature of the baltic sea (Reference Weeks, Gow, Kosloff and Digby-ArgusWeeks and others, 1990; Reference Meiners, Fehling, Granskog and SpindlerMeiners and others, 2002; Reference Granskog, Martma and VaikmäeGranskog and others, 2003a). furthermore, baltic sea ice is usually characterized by a high proportion of meteoric ice resulting from the formation of snow ice and superimposed ice (Reference Granskog, Martma and VaikmäeGranskog and others, 2003a, Reference Granskog, Leppäranta, Kawamura, Ehn and Shirasawa2004). despite these differences, processes of baltic sea ice formation are comparable to polar sea ice (Reference Leppäranta, Tikkanen and ShemeikkaLeppäranta and others, 1998). while baltic pack ice is often characterized by dynamic ice-growth processes such as ridging and rafting (Reference Weeks, Gow, Kosloff and Digby-ArgusWeeks and others, 1990), the growth of landfast ice is more static and its structure is generally composed of a granular surface layer and a columnar basal layer (Reference Weeks, Gow, Kosloff and Digby-ArgusWeeks and others, 1990; Reference Granskog, Martma and VaikmäeGranskog and others, 2003a).
Conditions between sub-basins in the baltic sea differ significantly (Reference Meiners, Fehling, Granskog and SpindlerMeiners and others, 2002; Reference Granskog, Kaartokallio and ShirasawaGranskog and others, 2003b). thus, in order to obtain a representative picture for the baltic sea as a whole, estimates of spatial variability in sea-ice properties must be made separately for the different areas and ice types of the baltic sea. in an effort to contribute to this goal, the present study estimates the spatial variation of physical and biogeochemical parameters in landfast sea ice of the gulf of bothnia, baltic sea, and identifies the main factors structuring the investigated ice habitat.
2. Materials and Methods
2.1. Study site and sampling
Sampling was conducted in march 2004 on landfast sea ice in the vicinity of the umeå marine sciences centre (university of umeå) located on the swedish coast of the gulf of bothnia (fig. 1).
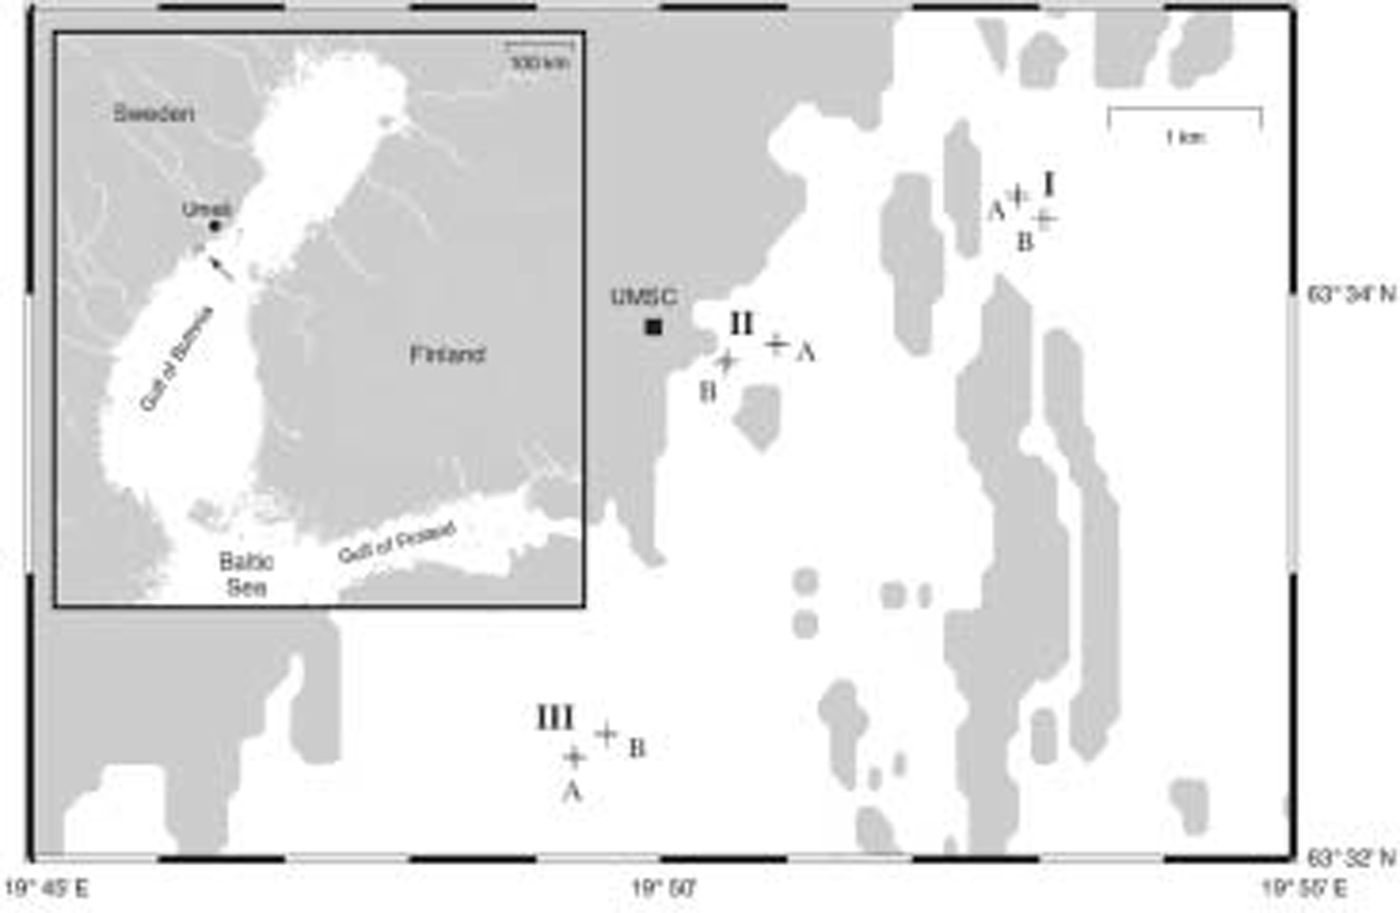
Fig. 1. Map of Baltic Sea coastline in the vicinity of Umeå Marine Sciences Centre (UMSC) located ∽40km south of Umeå. The location of the study site is indicated by an arrow (inset map). Cross marks denote position of sampling Sites; upper-case letters indicate Areas (I–III) and Locations (A and B), respectively. See text for further explanation.
A total of 72 ice cores were collected using a hierarchical sampling design with five spatial scales ranging from decimetres to several kilometres (fig. 2). (throughout this paper, we use the following words as a categorical classification: area, location, site and triangle.) the largest scale included three areas, each 2.5 km apart, which were chosen in places that appeared to be representative for the landfast sea ice in the study area. within each area, two locations were chosen at a distance of 250 m. two sites, 25 m apart, were nested within each location, and each site contained two triangles, 2.5 m apart. finally, from each triangle, three replicate ice cores, located 10cm apart from each other, were collected. sampling positions for all nested scales (location, site, triangle) were selected randomly.
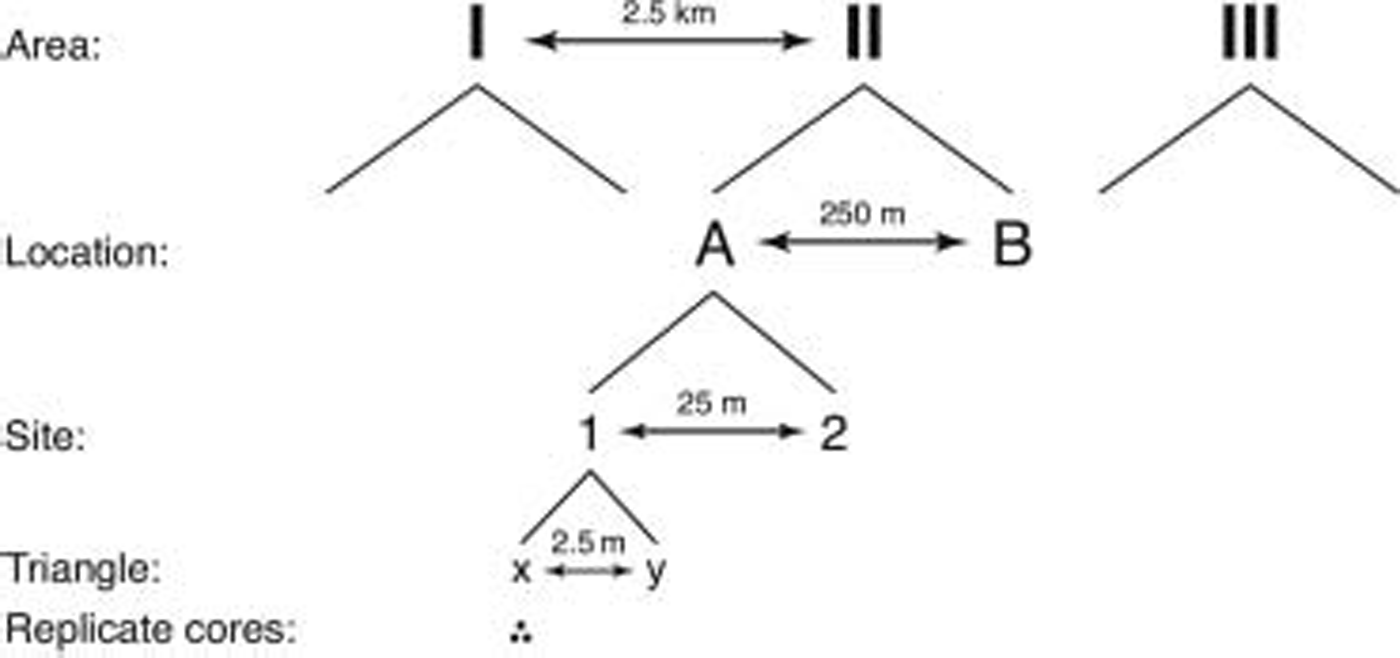
Fig. 2. Hierarchical sampling design used in the study.
The use of a hierarchical sampling design allows for estimation of variability at multiple spatial scales and permits unconfounded comparisons among the measured parameters at any of the chosen scales (Reference Morrisey, Howitt, Underwood and StarkMorrisey and others, 1992). thus, the combination of a nested sampling design with appropriate replication at each scale enables identification of differences at a chosen spatial scale without the risk of overlooking equally high, or even higher, variation at spatial scales smaller than the chosen one.
Ice cores were taken during four consecutive days using a mark ii corer (9cm internal diameter, kovacs enterprises, lebanon, nh, USA), and snow depth as well as ice thickness were recorded for each core. after retrieval, the entire cores were immediately sealed into a plastic foil and melted at +4˚c in the dark. cores were processed directly after complete melting.
2.2. Analytical methods
The meltwater from each core was mixed thoroughly, then subsampled for measurement of salinity, chlorophyll a (chl a), phaeophytin (phaeo), dissolved organic carbon (doc), dissolved organic nitrogen (don) and dissolved inorganic nitrogen (din).
The salinity of melted ice samples was determined with a wtw lf 196 conductometer (wtw, weilheim, germany, accuracy 0.2). for determination of chl a and phaeo concentrations, samples were filtered through whatman gf/f (glass-fibre f grade) filters. the filters were extracted in 90% acetone, homogenized and analyzed fluorometrically with a turner designs 10-au digital fluorometer according to Reference Evans, O’Reilly and ThomasEvans and others (1987). the detection limit of this method was 0.1 mg chl a l–1. for calculation of depth-integrated algal biomass, we assumed an average meltwater volume of 56 ml per cm of ice, which was based on accurate volume measurements of four cores taken separately.
Samples for doc, don and dissolved nitrate plus nitrite (hereafter referred to as din) were filtered through syringe filters (whatman gd/x GMF (borosilicate glass microfibre), pore size 0.45 μm) and were stored at –18˚c until later analysis. doc was determined after acidification of the samples using high-temperature combustion using an mq1001 toc analyzer as described in Reference Qian and MopperQian and mopper (1996), and din was determined with standard colorimetric methodology (e.g. Reference Grasshoff, Ehrhardt and KremlingGrasshoff and others, 1983) using a lachat qc 8000 autoanalyzer. the concentration of don was determined from total dissolved nitrogen (tdn) and din by difference. tdn was determined as din after persulphate wet oxidation at 100˚c (Reference Kattner and BeckerKattner and becker, 1991).
2.3. Statistical analysis
All recorded parameters were analyzed by four-factor nested analyses of variance (anova). in order to improve normality of the data, all parameters were transformed using log10(x+1) or fourth-root transformation. homogeneity of variances was checked using the brown–forsythe test. the relative contribution of each spatial scale towards the total variance was calculated from the mean squares (ms; Reference Sokal and RohlfSokal and rohlf, 1981) by subtracting the ms of the nested scale from the ms of each scale and dividing by the sample size at each scale. calculation of these variance components was based on the untransformed data, and negative estimates were assumed to be zero (Reference UnderwoodUnderwood, 1981).
Pairwise relationships between parameters were studied using non-parametric spearman rank-order correlation. coefficients were tested for significance after bonferroni correction (Reference ChandlerChandler, 1995), and only correlations between independent variables with significant coefficients of ρ > 0.6 were considered. in order to analyze multivariate relationships between the measured parameters and discriminate between the main regulating factors, a principal component analysis (pca) was performed on the data. all statistical analyses were performed using the jmp software package (sas institute inc., nc, USA).
3. Results and Discussion
3.1. Range of variation in physical and biogeochemical parameters
All sampling sites were covered by a 5.5–23cm (median: 10 cm) thick layer of snow, and ice thicknesses of cores varied from 26 to 58 cm (median: 47.5 cm), with bulk-ice salinities ranging between 0.2 and 0.7 (median: 0.4) (table 1). the observed snow and ice thicknesses as well as the comparatively low bulk-ice salinities are typical for coastal baltic sea ice as described by other studies (e.g. Reference Weeks, Gow, Kosloff and Digby-ArgusWeeks and others, 1990; Reference Haecky and AnderssonHaecky and andersson, 1999; Reference Granskog, Martma and VaikmäeGranskog and others, 2003a, Reference Granskog, Leppäranta, Kawamura, Ehn and Shirasawa2004).
Table 1. Summary of measured parameters (given as median and range) for ice cores grouped on the 2.5 km scale (Areas I–III, 24 cores per Area). DIN means nitrate plus nitrite

Concentrations of chl a measured for the entire cores peaked at 6.0 mg chl a l–1 (median: 2.9 mg chl a l–1), with phaeo/chl a ratios varying between <0.1 and 0.5. values for doc ranged from 37 μm to 397 μm (median: 95 μm), and don values varied between 0.6 μm and 26 μm (median: 6.6 μm). resulting doc/don ratios varied between 4.1 and 77.2 (median: 16.7). measured din concentrations ranged from 1.2 μm to 13.0 μm (median: 3.2 μm). the observed ranges for chl a, doc, don and din were comparable to values reported by previous sea-ice studies from the baltic sea (Reference Norrman and AnderssonNorrman and andersson, 1994; Reference Mock, Meiners and GiesenhagenMock and others, 1997; Reference Haecky and AnderssonHaecky and andersson, 1999; Reference Meiners, Fehling, Granskog and SpindlerMeiners and others, 2002; Reference KaartokallioKaartokallio, 2004; Reference Granskog, Kaartokallio, Thomas and KuosaGranskog and others, 2005a).
Calculations of depth-integrated ice algal biomass (median: 1.4 mgchl am–2, range: 0.2–2.6 mgchl am–2) were similar to values reported by others from the same region and season (Reference Haecky, Jonsson and AnderssonHaecky and others, 1998; Reference Haecky and AnderssonHaecky and andersson, 1999). for the gulf of finland, considerably higher values (mean: 5.5 ±4.4mgchl am–2, max.: 14 mgchl am–2) were observed by Reference Granskog, Kaartokallio, Kuosa, Thomas, Ehn and SonninenGranskog and others (2005b). contrastingly, Reference Meiners, Fehling, Granskog and SpindlerMeiners and others (2002) found very low algal biomass (<0.6 mgchl am–2) in pack ice of the bothnian bay and at nearshore stations in the gulf of finland, attributing these low values to below-average ice thicknesses and low phosphate concentrations in the under-ice water.
Chlorophyll measurements are often used to estimate the ice algal biomass within a given area. however, knowledge of the spatial variation in the study area is required to evaluate the quality of estimation and the representativeness of individual point measurements. assessing the calculations of depth-integrated ice algal biomass for the three investigated areas, our results revealed pronounced deviations of individual cores from their area means. relatively high coefficients of variation (cv) were found for areas i (cv = 41%) and iii (cv = 53%), while deviation of individual measurements from their group mean was less pronounced in area ii (cv = 23%). when comparing individual triangle means with their area mean, lower coefficients of variation were found for areas i (cv = 34%) and ii (cv = 19%), while in area iii deviation of triangle means from their group mean (cv = 52%) was similar to that of individual cores. maximum deviations of individual triangle means from their area mean were recorded in area iii for triangles iiia1x (65%) and iiia2x (78%).
Variation among replicate cores within each triangle is shown in figure 3. as a general trend, area i was characterized by a comparatively high median value for salinity, while median values of all other parameters (with the exception of don) were lowest in this area. the opposite trend was observed for area ii which had highest median values for ice thickness, phaeo, doc, don and phaeo/chl a.
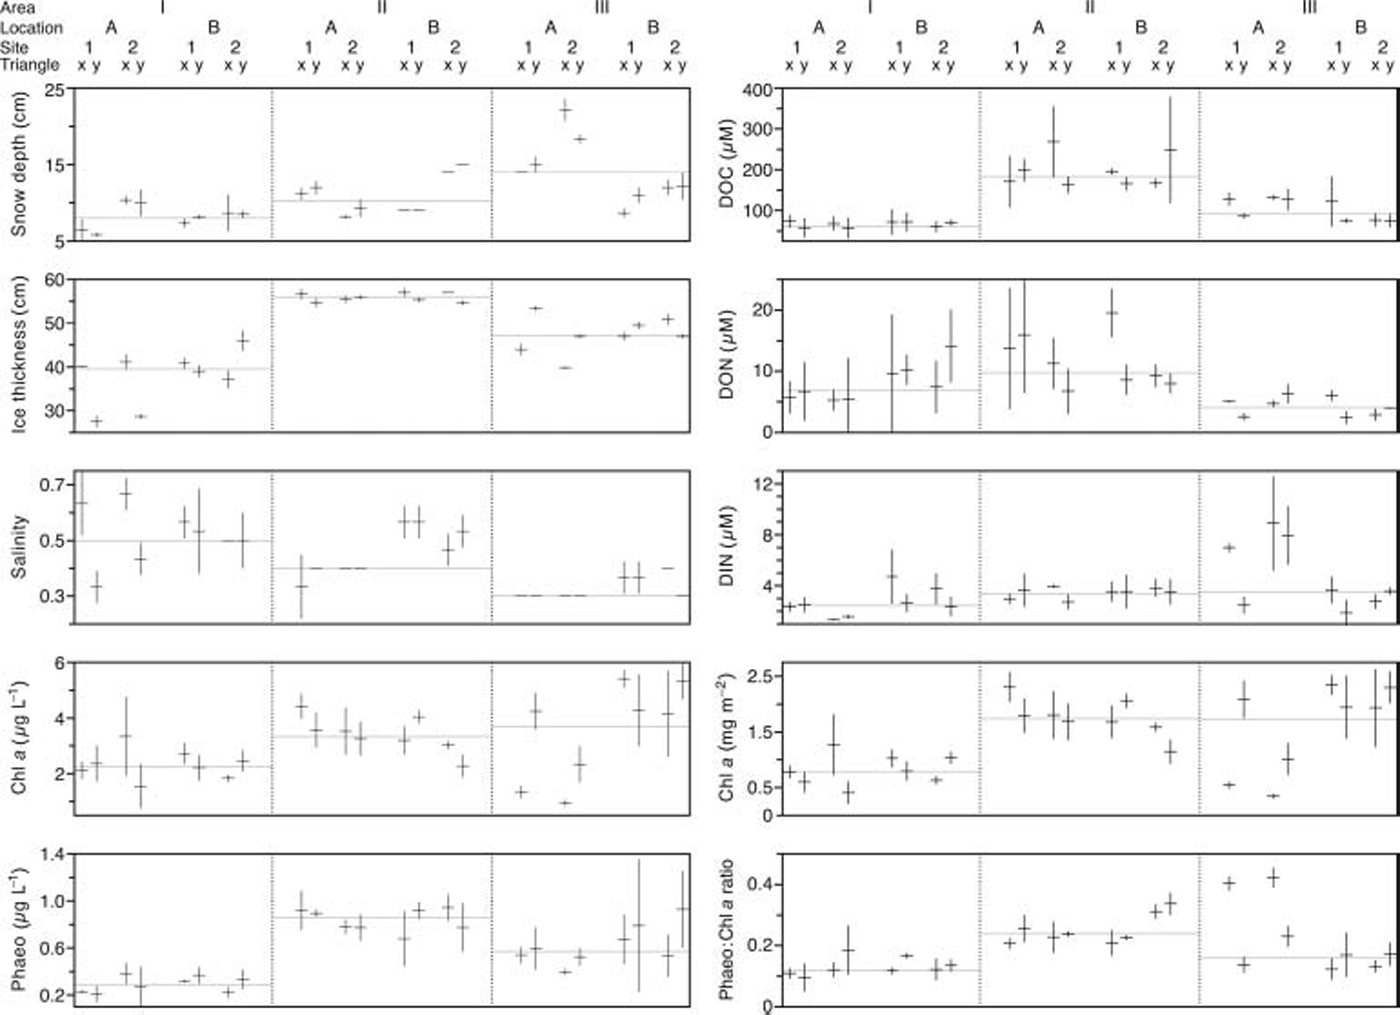
Fig. 3. Variability of replicate cores within each Triangle. Horizontal bars represent the mean of the three cores within a Triangle; vertical bars depict standard deviation; grey horizontal lines indicate the group median on Area level; DIN means nitrate plus nitrite.
3.2. Analyses of variance
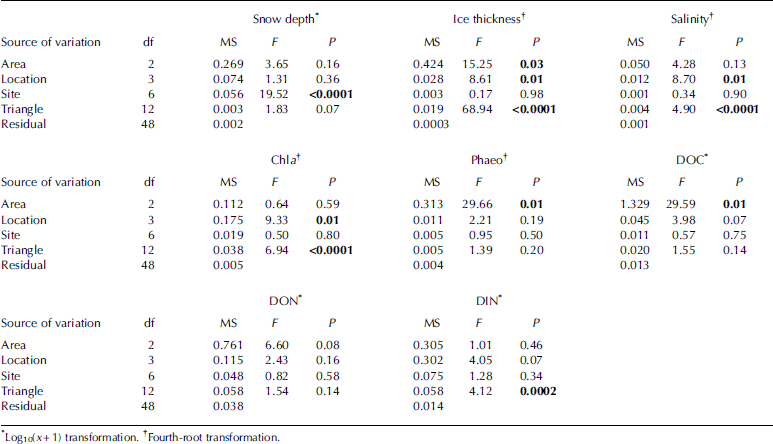
Nested anova revealed significant differences for all of the spatial scales investigated, but the pattern of differences at various spatial scales was not the same among the examined parameters (table 2). significant differences at the 2.5 km scale (area) were found for ice thickness, doc and phaeo, while for salinity and chl a the 250m scale (location) was found to be the largest scale where significant differences could be detected. snow depth only varied significantly on the 25 m scale (site). variability on the 2.5 m scale (triangle) contributed significantly to the total variation for ice thickness, salinity, chl a and din. for don, no significant differences were found at any of the investigated spatial scales. there were more significant differences at the smallest spatial scale (triangles; four out of the nine analyses) than at the larger spatial scales of locations (three out of nine) and areas (three out of nine). however, the observed magnitude of variation was not the same among these spatial scales.
Table 2. Summaries of Anova. Significant values (P < 0.05) are shown in bold. df: degrees of freedom; MS: mean square (sum of squared deviations divided by df); F: ratio of a factor’s MS divided by the MS of its nested factor; P: resulting significance level for testing the hypothesis that each variance component equals zero
The differences in ice thickness observed between areas may largely be caused by different age of the ice. we suppose that the inner bay where area ii was situated (see fig. 1) froze over first, while areas i and iii froze later because these areas are more affected by open water with higher salinities and more pronounced wave action. this is supported by the fact that the variation in ice thickness in areas i and iii was higher than in area ii (fig. 3), which may be attributed to differences in growth processes between these regions. for example, a higher degree of wave action would cause ice growth to be less static and more dynamic, which, in turn, would cause higher variability in ice thickness.
3.3. Variation among investigated spatial scales
The contribution that each spatial scale made to the total variance was calculated for each of the parameters analyzed (table 3). the area scale made the largest contribution to the total variance for ice thickness, doc and phaeo, while variation for salinity, chl a and din was of similar magnitude on larger spatial scales (tens of metres up to kilometres) and on the small scale (metres and below). with the exception of snow depth, the site level did not contribute substantially to the total variance for any of the investigated parameters.
Table 3. Variance estimates (%) derived from the ANOVA. Parameters are ordered according to their highest variance component. Variance components detected as being significant by the ANOVA are shown in bold
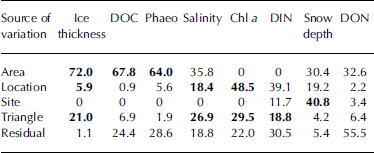
Interpretation of variance components is not straightforward since the magnitude of the residual variance can affect the size of the variance components of the different spatial scales (Reference Morrisey, Howitt, Underwood and StarkMorrisey and others, 1992). the large differences in the contribution of the residual variance to the total variance observed in this study complicates comparison of the relative importance of different spatial scales among parameters. however, estimation of variance components indicates considerable residual variation for all parameters except ice thickness and snow depth. this implies that there is patchiness at smaller scales than triangle, i.e. between replicate cores. variation among replicates was especially high for don, accounting for more than half of the total variation.
The variance components also indicate that some scales are important although they were not detected as being significant by the anova. for example, apparent differences among areas for salinity were not significant. detection of significance on the area scale might have been affected by significant variation on smaller spatial scales and the small power of the test for differences between areas (two degrees of freedom; Reference Sokal and RohlfSokal and rohlf, 1981). in the case of don and din, it is possible that the large residual (i.e. within-triangle) variation together with the lack of power on area/location level did prohibit differences on larger spatial scales from being detected by the anova.
3.4. Correlations between studied parameters
Pairwise correlations between all measured parameters revealed significant positive relationships between ice thickness and phaeo (ρ = 0.80, p < 0.01) as well as ice thickness and doc (ρ = 0.72, p < 0.01). in addition, doc was positively correlated with phaeo (ρ = 0.65, p < 0.01). these correlations support the conjecture that the age of ice was different among investigated areas and that area ii, which was characterized by comparatively high values for ice thickness, phaeo and doc, may represent a more developed ice algal community. this latter supposition is based on previous studies which indicated that elevated concentrations of pigment degradation products such as phaeopigments as well as dissolved organic matter resulting from death and lysis of organisms are frequently associated with senescent populations (Reference HornerHorner, 1985; Reference Thomas, Papadimitriou, Thomas and DieckmannThomas and papadimitriou, 2003).
Pairwise correlations on area level revealed different correlations between the investigated areas and in comparison to the overall dataset. while for areas i and ii only doc and don were positively correlated (ρ > 0:72, p < 0.01), seven correlations were found for area iii, with strongest relationships between ice thickness and din (ρ = –0.82, p < 0.01) and between snow depth and chl a (ρ = –0.72, p < 0.01).
The negative correlation of snow depth and chl a in area iii may be due to the adverse effect of thick snow cover on the under-ice light climate (Reference G.A. and HornerMaykut, 1985). this is supported by the observed conditions at triangle iiia2x which featured the highest snow depths (20.5–23 cm) among all investigated triangles, but was also characterized by the lowest chl a concentrations as well as the highest values for din and phaeo/chl a recorded among all triangles (fig. 3). there is evidence from other studies conducted on landfast sea ice in the baltic sea that ice algae are light-limited at the beginning of the growth season (Reference Haecky, Jonsson and AnderssonHaecky and others, 1998; Reference Haecky and AnderssonHaecky and andersson, 1999) and that even a thin snow cover negatively affects ice algal development due to the reduced light climate (Reference Kuosa and KaartokallioKuosa and Reference KaartokallioKaartokallio, 2006). this supports the conjecture that the accumulation of ice algal biomass in our study area may have been adversely affected at patches where snow depths >14cm existed for a longer time period.
In baltic sea ice, snow can act as a source of din through atmospheric deposition of nitrogenous nutrients and snow-ice formation (Reference Granskog, Kaartokallio and ShirasawaGranskog and others, 2003b). snow-ice formation is a typical feature of baltic sea ice, and meteoric ice can contribute up to one-third to the total ice thickness (Reference Granskog, Kaartokallio and ShirasawaGranskog and others, 2003a, 2004). snow ice is formed when a snow layer is flooded with sea water and subsequently refrozen (Reference KawamuraKawamura and others, 2001). this implies that snow-ice formation can only take place after the snow/ice interface has been depressed below water level, resulting in a negative freeboard. we observed negative freeboards at more than half of the investigated triangles, which indicates that snow cover likely contributed to the sea-ice development in our study area, thus acting as a source of nitrogen. this is supported by the negative relationship between ice thickness and din in area iii and is exemplified by high din values observed at triangle iiia2x in conjunction with high snow depths and comparatively low ice thicknesses (fig. 3). however, din was also positively correlated with doc (ρ = 0.64, p = 0.03) and don (ρ = 0.67, p = 0.01) in area iii, which suggests that din is also controlled by biological effects.
Multivariate relationships among the investigated parameters were studied by use of a principal component analysis (table 4) which performs a linear transformation of (possibly) correlated variables into a smaller set of uncorrelated variables (principal components). the first principal component (p1) accounts for as much of the variability in the data as possible, and each succeeding component accounts for as much of the remaining variability as possible. principal components greater than p3 had eigenvalues <1 and were thus not considered since their contribution to the total variance would be less than that of the original variables (Reference KaiserKaiser, 1960). eigenvectors summarize the weightings of each of the variables on each component, and eigenvectors further from zero indicate a greater contribution of its variable to the particular component.
Table 4. Results of the principal component analysis showing characteristic properties of the first three principal components (P1–P3). Parameters are ordered according to the approximate ranks of their eigenvectors. Within each principal component the three highest eigenvectors are shown in bold
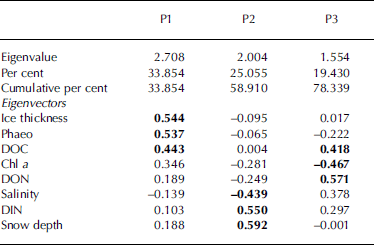
For our dataset, the contributions of the first two principal components were comparatively low, and together accounted for only 59% of the total variance. this suggests that the relationships among the studied variables are complex and that the observed variation cannot be attributed to a few of the parameters. for the first principal component, the highest eigenvectors were found for ice thickness, phaeo and doc, indicating a pronounced contribution of these variables to the total variance. the second principal component incorporated large contributions by snow depth, din and salinity, while the third component was mainly characterized by don, chl a and doc.
In combining the results from tables 3 and 4, it is evident that those parameters which had their largest variance components on area level (ice thickness, doc and phaeo) also contributed most to the first principal component. this suggests that differences on the kilometre scale are mostly represented by the first principal component, which contributed approximately one-third to the total variance. since doc and phaeo were correlated with ice thickness we propose that ice thickness, acting as an indirect indicator of age of ice and ice growth processes, was the main element structuring the investigated ice habitat on a large scale.
The large contribution of snow depth to the second principal component highlights the importance of snow cover with regard to the observed spatial variability. this result, together with the fact that snow depth varied mostly on the scale of tens of metres, is in agreement with Reference Gosselin, Legendre, Therriault, Demers and RochetGosselin and others (1986) who found that snow cover, which was distributed in patches of approximately 20 m, was one of the main factors controlling ice algal biomass at a smaller scale.
3.5. Consequences of spatial variability for sampling
The fact that significant variation in physical and biogeochemical sea-ice properties occurs at various spatial scales and that the pattern of spatial variability can be different for individual parameters has important consequences for sampling design. as an example, sampling efforts for doc (which only exhibited significant variation on area level) could be concentrated on the kilometre scale, with a few randomly placed samples within each area. for ice thickness, however, more samples would be needed to account for small-scale variability when assessing the overall variability in a large region.
While it is possible that large-scale variation (hundreds of metres to kilometres) exists for salinity, chl a and din, this study corroborates that small-scale patchiness (metres and below) can contribute significantly to the total variation of these parameters and that it may even exceed the observed large-scale variation. similar results were found by other patchiness studies from both fast ice and pack ice (Reference Eicken, Lange and DieckmannEicken and others, 1991; Reference Swadling, Gibson, Ritz and NicholsSwadling and others, 1997) where the latter may exhibit even more pronounced small-scale patchiness due to strong sea-ice deformation and corresponding ridge formation and rafting (Reference Eicken, Lange and DieckmannEicken and others, 1991). this clearly emphasizes the importance of replicate samples on a small scale in heterogeneous ice environments and suggests that scales of patchiness in sampled ice should be taken into account when comparing ice-core samples taken along a transect without replication.
Since sampling of ice cores is invariably destructive and subsequent samples must be taken at a certain distance from the previous sampling location, any core-based study of temporal sea-ice processes will likely include some degree of spatial variation. this implies that it may not be possible to reliably assess temporal variation of sea-ice properties without estimating their spatial variation in the study area.
Finally, it is important to note that the scales of variation as well as the relationships between parameters may substantially differ between locations and seasons. while several sea-ice studies did not find significant differences in chl a distribution at spatial scales <20m in fast ice off hokkaido, japan, (Reference Robineau, Legendre, Kishino and KudohRobineau and others, 1997) east antarctica (Reference Swadling, Gibson, Ritz and NicholsSwadling and others, 1997), ellesmere island, canada, (Reference Wiktor and SzymelfenigWiktor and szymelfenig, 2002) and in the gulf of finland, baltic sea (Reference Granskog, Kaartokallio, Kuosa, Thomas, Ehn and SonninenGranskog and others, 2005b), Reference S., Kühl, Glud and HansenRysgaard and others (2001) found ice algal biomass to be distributed in patches of 5–10m in fast ice off northeast greenland.
Regarding the small-scale distribution of microalgal biomass, patches of 20–90m were observed by Reference Gosselin, Legendre, Therriault, Demers and RochetGosselin and others (1986) in first-year ice of southeastern hudson bay, canada, whereas Reference Robineau, Legendre, Kishino and KudohRobineau and others (1997) identified patches of chl a distribution of 70, 100 and 500 m. Reference Gosselin, Legendre, Therriault, Demers and RochetGosselin and others (1986) also showed that the relationship between snow depth and microalgal biomass changed over the season. at the beginning of the growth season, maximum algal biomass was observed under areas with minimum snow cover, while the opposite relationship was found later in the season where the snow cover caused protection from photoinhibition at increased bottom-ice irradiances.
These results suggest that, unless the spatial scales of patchiness are known for the study area, it would be best to conduct a pilot study in order to identify spatial scales at which variation is significant. in addition, a pilot study would help in designing a more accurate and economical sampling strategy for the region of interest (Reference UnderwoodUnderwood, 1981; Reference Andrew and MapstoneAndrew and mapstone, 1987).
4. Conclusions
The present study confirms that considerable patchiness in biogeochemical parameters of landfast sea ice can occur at various spatial scales ranging from centimetres to several kilometres. spatial scales of variation were different for the investigated parameters, and small-scale patchiness contributed significantly to the total variation for half of the studied variables. our findings suggest that ice thickness, as an indirect measure of age of ice and ice growth processes, was the major factor structuring the investigated ice habitat on a large scale, while snow depth, nutrients and salinity seemed to be of secondary importance. the results of our study further emphasize the need for appropriate sampling design when assessing differences among areas and highlight the importance of replicate samples on a small scale.
Acknowledgements
We are grateful to u. båmstedt and a. andersson for providing financial support and access to research facilities at umeå marine sciences centre. further financial support was provided by the walter and andrée de nottbeck foundation. we thank l. norman for technical assistance in the measurement of nutrients and dom parameters. the statistical advice of d. piepenburg, and his helpful comments on the manuscript, are gratefully acknowledged.


