Introduction
In the ongoing discussion of climatic change, the mass balance of Antarctica has received increasing attention during recent decades, since its reaction to global warming will strongly influence sea-level change. Many different compilations of Antarctic mass balance, using models and measurements, have been published (Reference Giovinetto and BentleyGiovinetto and Bentley, 1985; Reference Bentley, Giovinetto, Weller, Wilson and SeverinBentley and Giovinetto, 1991; Reference Van LipzigVan Lipzig, 1999; Reference Giovinetto and ZwallyGiovinetto and Zwally, 2000). However, the uncertainties are still relatively large due to the size of the continent and a lack of measurements in some parts of it. Additionally, the response time of the enormous ice sheet to a change in climate is very large. Thus it is difficult to relate changes in the extent or height of the ice sheet to climatic change on time-scales of decades or centuries. Accumulation rates were found to be sensitive to changes in air temperature (Reference Giovinetto, Waters and BentleyGiovinetto and others, 1990) and thus are more suitable for studying possible changes in climate. A decrease in air temperature usually leads to a decrease in accumulation rates since colder air can hold less moisture than warmer air, so precipitation amounts tend to decrease, even if the number of precipitation events does not change. There are, however, other possible reasons for accumulation-rate changes, such as changes in the mean atmospheric circulation that alter storm tracks, frequency of storms or origin of precipitation. In different parts of Antarctica, opposite accumulation-rate trends were observed (Reference Morgan, Goodwin, Etheridge and WookeyMorgan and others, 1991; Reference Peel, Bradley and JonesPeel, 1992; Reference Isaksson, Karlén, Gundestrup, Mayewski, Whitlow and TwicklerIsaksson and others, 1996; Reference OerterOerter and others, 2000; Reference GrafGraf and others, 2002).
In this study, we present accumulation and stable-isotope data from three firn cores taken close to the German Antarctic base ``Neumayer’’, on Ekströmisen, on the coast of Dronning Maud Land. the first mass-balance studies in western Dronning Maud Land were carried out by members of the Norwegian–British–Swedish Antarctic Expedition in 1949– 52 (Swithinbank, 1957; Reference SchyttSchytt, 1958a, Reference Schyttb). from their wintering base ``Maudheim’’ on Quarisen the members of this expedition undertook long sledge journeys during which they also crossed Ekströmisen.
Glaciological studies have been carried out on Ekströmisen since the pre-site survey for the first German base ``Georg von Neumayer’’( 70˚37’ S, 8˚22’ W) in 1979/80 (Reference Reinwarth, Rauert, Stichler and MoserReinwarth and others, 1982,Reference Reinwarth, Graf, Stichler, Moser and Oerter1985). These included accumulation-stake measurements, snow-pit and shallow firn-core studies, at first in order to obtain information about accumulation rates at the construction site of the base, and later for isotope and chemical investigations. In this study, three cores taken between 1982 and 1998 are presented. Different dating methods, accumulation rates and stable-isotope ratios of these cores are compared and discussed.
Data
A stake array was installed 700m south of the Georg von Neumayer station (GvN) in March 1981. Since then, the number of stakes and the site of the array have changed only slightly. When a new base, ``Neumayer’’ (70˚39’ S, 8˚15’W), was constructed in 1992, a new stake array was set up. the old and the new array were run simultaneously for 2 years. During this time, the new array showed the same accumulation events, but higher accumulation amounts than the old one. However, comparison with a firn core taken at the construction site in 1989, before the new base was built, shows a good agreement of accumulation rates at GvN and Neumayer, respectively. Thus we assume that the higher values observed during the first 2 years after the construction are due to the influence of the station building, which after 3 years should have disappeared, since the station was close to the level of the surrounding surface by that time. Today the array consists of 25 metal stakes of 2m length and is situated about 1km southeast of the station. Stakes are arranged in a quadrat with a distance of about 5m between stakes. Accumulation was measured on a weekly basis, except for 1983, when only monthly readings were carried out. Although some melting is observed at the surface in summer, the stakes remained frozen to the surrounding snow at lower levels and did not melt in. the snow surface was usually fairly rough, with sastrugi varying in size, but the mean of the snow-height changes should give a reasonable value for the accumulation. Settling of the snow cover is very small, and in the weekly measurements negligible compared to erosion due to wind influence (Reference SchlosserSchlosser,1999).
Another stake array was set up in 1987, about15 km south of GvN (now 10 km south of Neumayer), at the traverse route to the Ritscherflya south of Ekströmisen. It is similar to that at Neumayer, but consists of only 16 stakes, which are read once per month. Figure 1 shows monthly accumulation rates measured at stake arrays Neumayer and ``15 km South’’. the correlation of these two time series is fairly good (r = 0.71). Accumulation at ``15 km South’’ is higher than at Neumayer in many cases, which might be due to less erosion. More details about the stake measurements can be found in Reference SchlosserSchlosser (1999) and Reference Schlosser, Oerter and GrafSchlosser and others (1999).
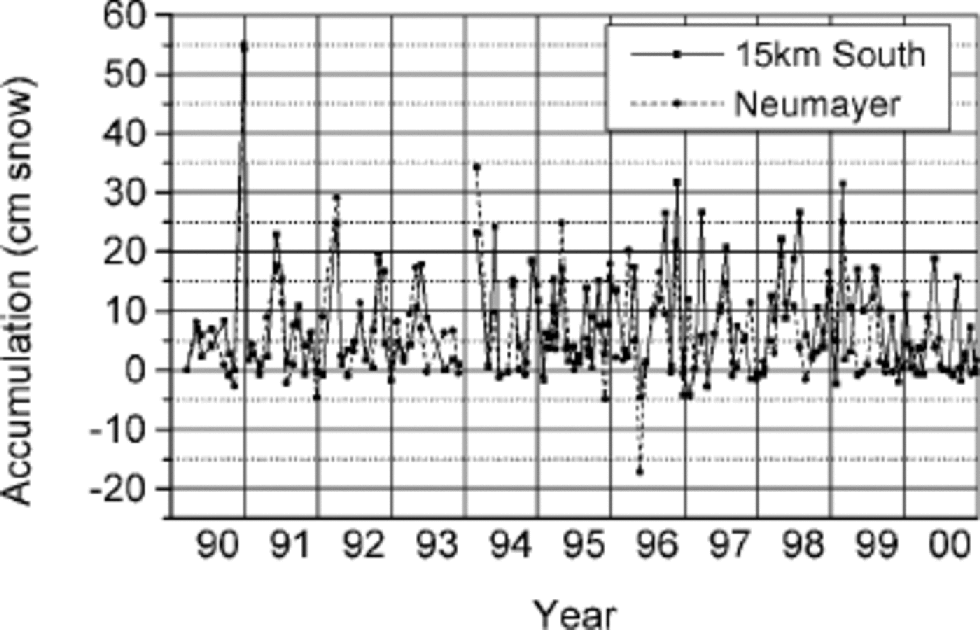
Fig. 1 Monthly accumulation measured at stake arrays Neumayer/GvN and “15 km South”, respectively. Values are given in cm snow to avoid errors in calculation of water equivalent due to uncertainties in density.
Snow density is required in order to calculate accumulation (mm w.e.) from the snow-height changes. Unfortunately, no density measurements of freshly fallen snow are available. Densities observed in the uppermost 10–20cm of snow pits are 300–460 kg m–3. Usually the highest values are found in pits dug in summer after a longer clear-weather period when the snow has had time to settle. In winter and immediately after a snow fall/drift event the density is lower. Usually, large amounts of accumulation mean less wind-packed snow, as previously observed at Maudheim (Swithinbank, 1957). Therefore we used a mean density of 360 kg m–3 to calculate accumulation rates.
Snow pits which usually covered1–2 years accumulation were dug, and shallow firn cores were taken at irregular time intervals, mostly during summer. the depth of the firn cores is 10–52m. Snow stratigraphy, chemical properties and stable-isotope ratios (δ18O), and in some cases tritium contents, were investigated. the cores were usually dated using the seasonal variations of stable isotopes. Detailed information about these data can be found in Reference Schlosser, Oerter and GrafSchlosser and others (1999). Additionally, samples of freshly fallen surface snow were taken after major snowfall events. These samples were also analyzed for isotope studies.
This study focuses on three cores:
B04, drilled at GvN in 1982 with a length of 52m;
FB0189, drilled in December 1989 at the planned construction site of Neumayer station to 10m depth (Reference Schlosser, Oerter and GrafSchlosser and others, 1999);
FB0198, drilled in December 1997 adjacent to stake array ``15 km South’’ with a length of 27.8m.
FB0198 was also dated using dielectric-profiling (DEP) measurements.
Figure 2 shows the δ18O and 3H profiles of B04. the dating of this core was cross-checked using the tritium profile (cf. Reference Graf, Reinwarth, Oerter, Mayer and LambrechtGraf and others, 1999; Reference Oerter, Graf, Wilhelms, Minikin and MillerOerter and others, 1999), resulting in a mean accumulation rate of 360 kg m–2 a–1 for the period 1952–82. This agrees well with the dating using the stable-isotope stratigraphy, which differed from the 3H dating by only 1 year. This yields a dating accuracy of about 5% (Reference Oerter, Graf, Schlosser and OerterOerter and others, 1997, Reference Oerter, Graf, Wilhelms, Minikin and Miller1999; Reference Graf, Reinwarth, Oerter, Mayer and LambrechtGraf and others, 1999).
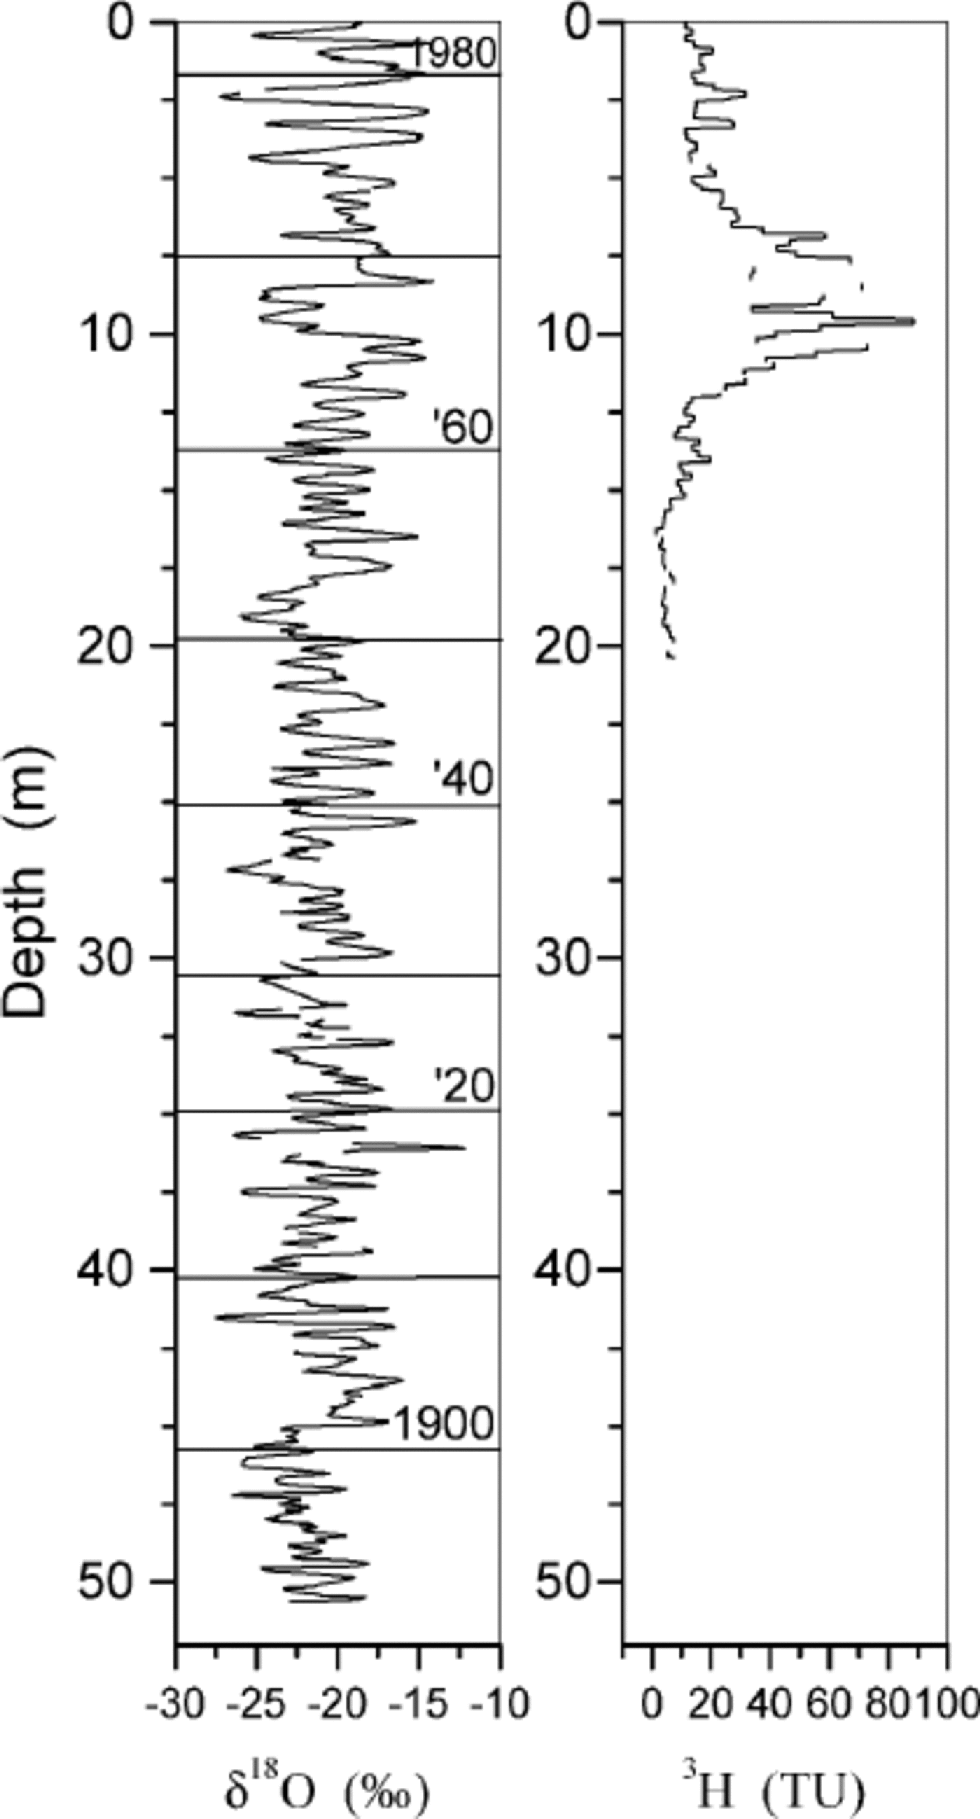
Fig. 2 δ18O and 3H profiles of the 52 m core B04 taken in 1982 (Reference Schlosser, Oerter and GrafSchlosser and others, 1999).
B04 covers the time period 1892–1981. the mean annual accumulation for this time period is 351kgm–2 a–1, with a standard deviation of the annual means of 91 kgm–2 a–1.
Figure 3 shows δ18O, electrolytical conductivity and density for FB0189. the δ18O profile does not show very regular seasonal variations, but the accumulation rates derived from it agree well with the accumulation measured at the stake array at GvN which is shown in Figure 4. the electrolytical conductivity does not show regular seasonal variations; the measured peaks are related to certain storm events.

Fig. 3 δ 18O, electrolytical conductivity and density for FB0189 (Reference Schlosser, Oerter and GrafSchlosser and others, 1999).

Fig. 4 Annual accumulation measured at stake array Neumayer (until 1991: GvN) and derived from FB0189, respectively.
FB0198 was taken at the stake array ``15 km South’’. the core is 27.8m long and covers the time period 1955–97. Figure 5 displays the profiles of electrical conductivity measured by means of DEP (Reference Wilhelms, Kipfstuhl, Miller, Heinloth and FirestoneWilhelms and others, 1998) and of the 18O content of this core.
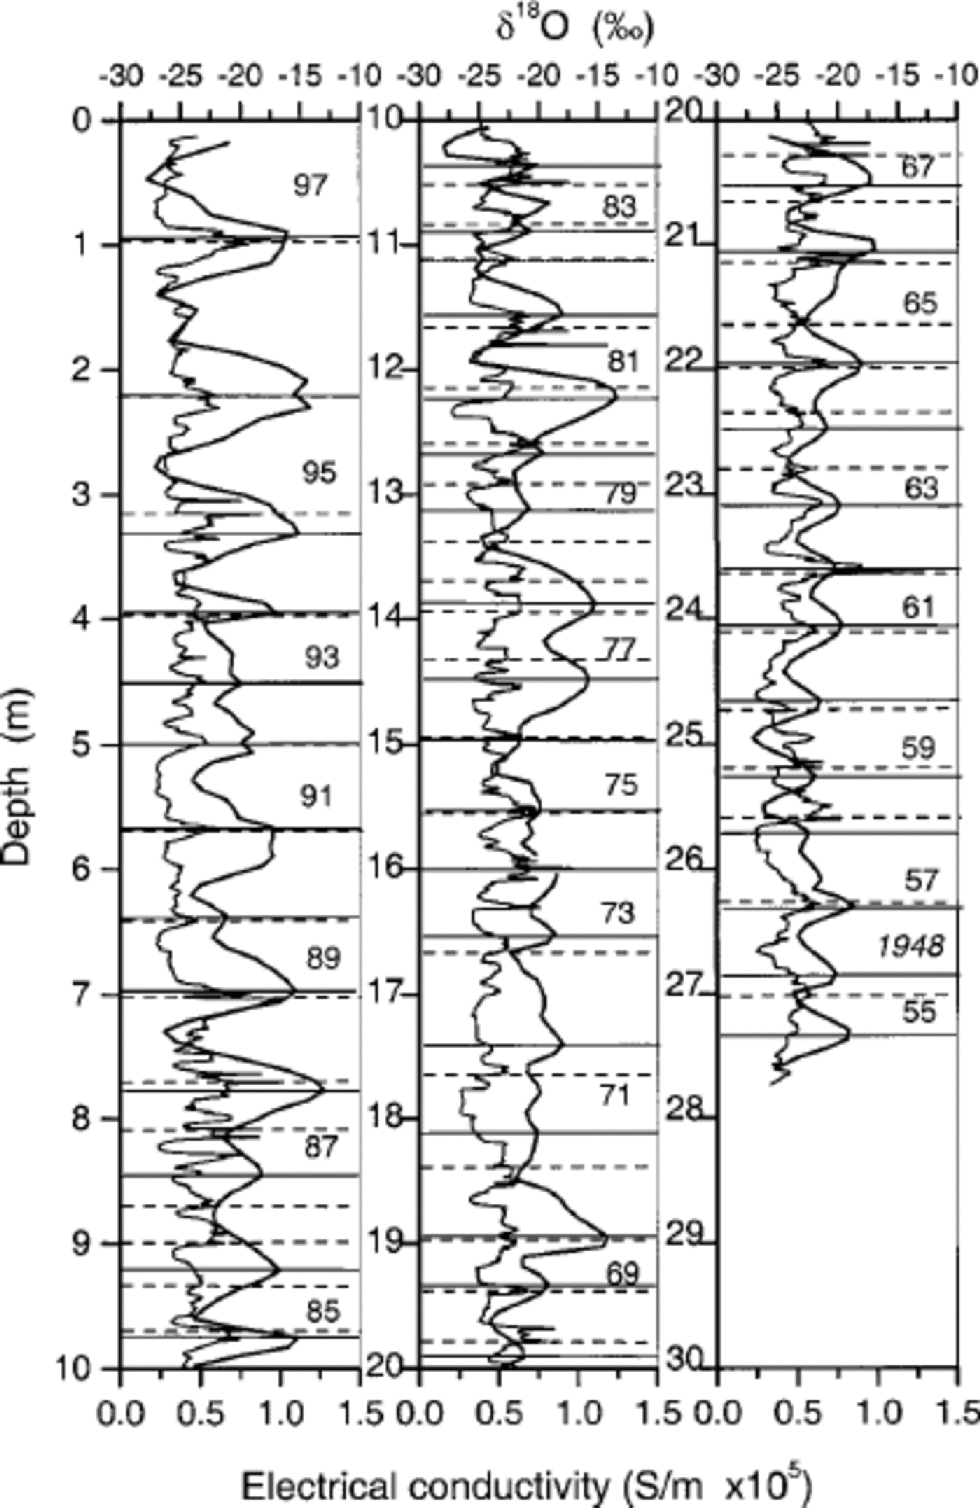
Fig. 5 Electrical conductivity (from DEP) (thin line) and δ 18O (bold line) profiles of FB0198, with the corresponding dating (dashed and solid lines, respectively). Normal numbers correspond to the δ 18O dating; 1948 (italic) is the first year of the DEP dating.
Dating of The Cores
FB0198 was first dated using DEP measurements (Reference Wilhelms, Kipfstuhl, Miller, Heinloth and FirestoneWilhelms and others, 1998). Dating by means of DEP profiles was also carried out on several cores from Amundsenisen by Reference Oerter, Graf, Wilhelms, Minikin and MillerOerter and others (1999, 2000). on the inland ice plateau, strong volcanic signals provided good time markers in addition to the seasonal signal. Unfortunately, a pronounced signal coinciding with the eruption of Mount Agung, Indonesia, in 1963 is missing in FB0198, which was drilled in the coastal region. Therefore layer counting within the DEP profile is more uncertain. Due to the high accumulation rate at this coastal site, the seasonal δ18O signal is well preserved.
Figure 5 shows the electrical conductivity and δ18O profiles for FB0198 together with the corresponding dating. for comparison, the DEP dating was first done independently of the δ18O dating. the numbers correspond to the δ18O dating; the first year of the DEP dating is 1948. the two dating methods yield different results.
Differences are largest in those parts of the core in which the conductivity is fairly irregular, whereas the isotope profile shows clear seasonal variations. In these cases the δ18O signal is more reliable than the DEP signal, which can be disturbed by single precipitation events (like the electrolytical conductivity shown above for core FB0189). for the past two decades, we used the stake measurements to check this dating. Since the spatial variability of accumulation is high it is not possible to exactly prove the dating using the stake measurements, but the results support the assumption that for this core the seasonal variations of the δ18O provide a more exact dating tool than the DEP. There are still some uncertainties in the lower part of the core. Unfortunately, the stake measurements did not start until 1981.
The DEP dating is reliable when it can be checked using marked layers from well-known volcanic eruptions. Usually a combination of different dating methods yields a reliable result.
Accumulation Rates
Figure 6 shows the accumulation rates derived from B04, FB0189 and FB0198 for the time period covered by all three cores, 1955–97. All three cores show high interannual variability of accumulation and do not agree well because of the high spatial variability of accumulation due to the extreme wind influence (Reference Schlosser, Oerter and GrafSchlosser and others,1999).
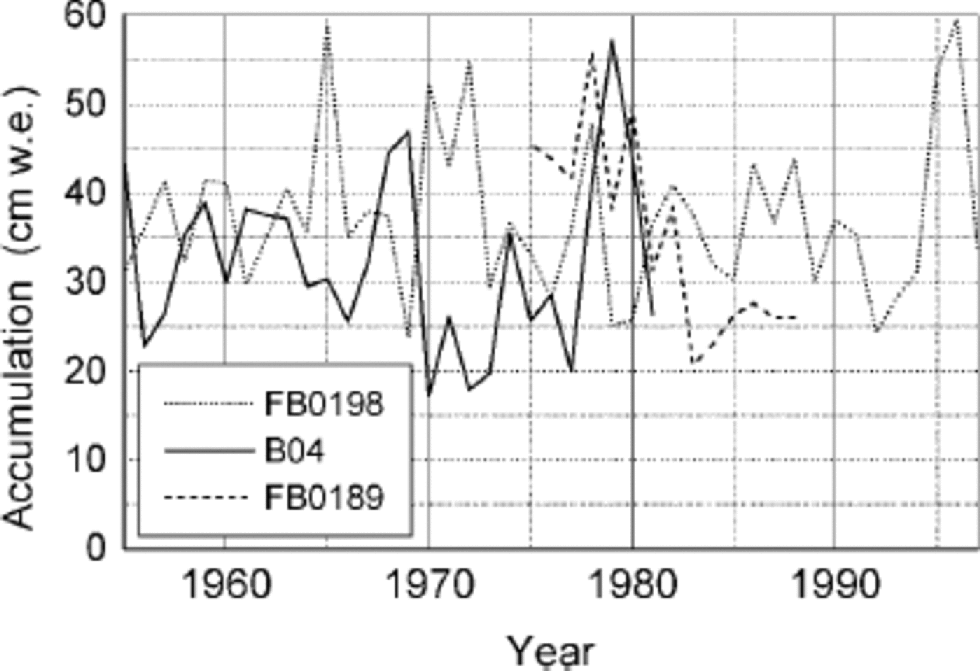
Fig. 6 Annual accumulation derived from B04, FB0189 and FB0198 for the time period 1955–97.
Figure 7a and b show the complete time series of accumulation for the two longer cores. Whereas in B04 a decreasing trend (significant at the 95% level) can be found between 1892 and 1980 (Fig. 7a), FB0198 (Fig. 7b) shows no significant trend for the time period 1955–97. the time period covered by both cores, 1955–80, is too short for a statistically significant trend to be calculated.
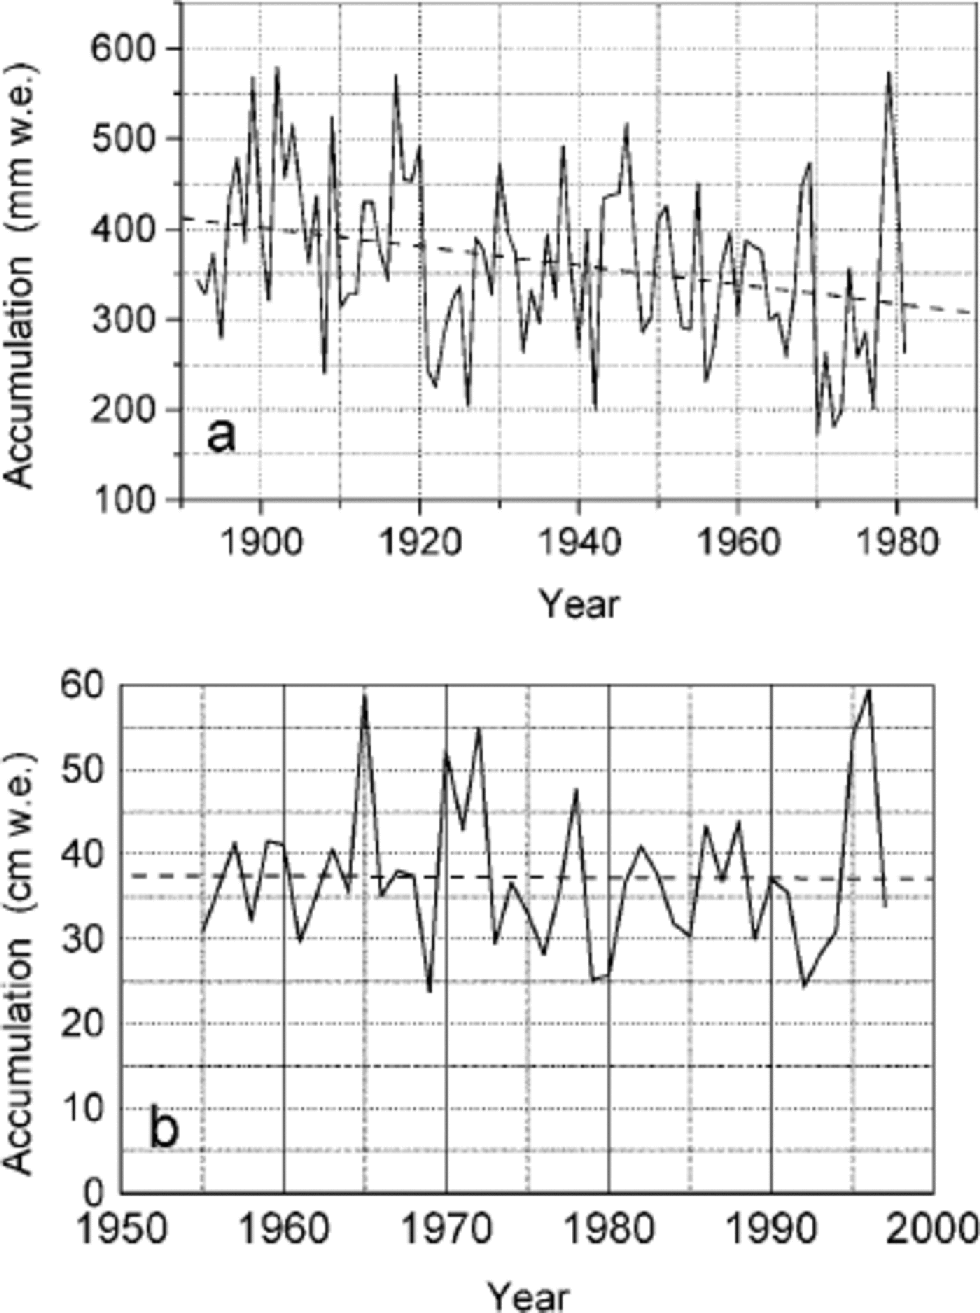
Fig. 7 (a) Annual accumulation derived from B04 for the time period 1892–1981. (b) Annual accumulation derived from FB0198 for the time period 1955–97.
The mean accumulation rate for 1892–1980 (B04) is 362 kg m–2 a–1 (σ = 95 kg m–2 a–1), and for 1955–97 (FB0198) is 374 kg m–2 a–1 (σ =87 kg m–2 a–1).
The origin of the deeper layers of B04 lies about 15 km south of the drilling site. Therefore accumulation rates of B04 were corrected for the thinning of the annual layers due to the ice flow. Horizontal strain rates at the drilling site amount to 1.2×10⁻³ a–1 and –0.5×10⁻³ a–1, respectively (IFAG, 1999). This yields a change in the annual-layer thickness of 0.07% a–1. for the shorter core the thinning of the annual layers was negligible.
The trend in the corrected time series for B04 amounts to 1.05mm w.e. a–1 (significant at the 95% level). However, the high spatial variability means that the data concerning trends must be interpreted with care.
Isotope Ratios
Figure 8 shows the mean annual δ18O for B04, FB0189 and FB0198 for the time period since 1955. the isotope values of the three cores agree much better than the accumulation rates. This was also found on Amundsenisen (Reference GrafGraf and others, 2002). We assume that this is because the isotope ratios are relatively uniform during single precipitation events, whereas accumulation is dependent on topography and can be altered even by extremely slight depressions or rises of the surface.
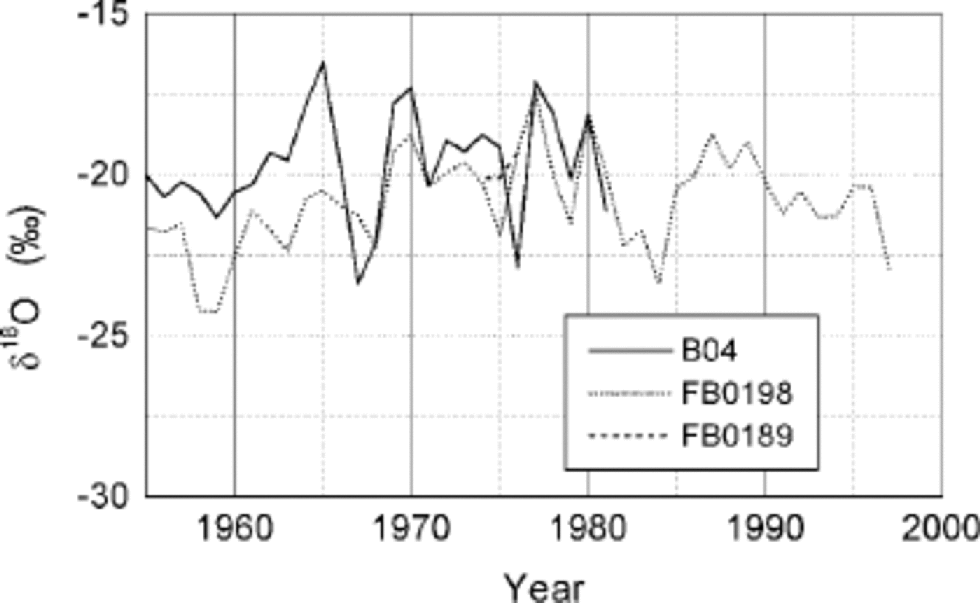
Fig. 8 Annual mean δ 18O for B04, FB0189 and FB0198 for the time period 1955–97.
Figure 9 shows the mean annual δ18O for B04 for the time period 1892–1981. B04 shows an increasing trend between 1892 and 1980 (significant at the 95% level). FB0198 also shows increasing δ18O values during this century until the 1980s; later it shows slightly decreasing values. for the time period since 1981, for which temperature measurements are available, no significant correlation is found between mean annual temperature and δ18O from FB0198, because at Ekströmisen the annual mean δ18O is strongly dependent on seasonal distribution of accumulation (Reference SchlosserSchlosser, 1999). the interannual variability of seasonality leads to a bias in the core, which makes it impossible to derive mean annual temperatures from mean annual δ18O. for smaller time-scales, which can be investigated using samples of freshly fallen snow, the δ18O at Neumayer is highly correlated to temperature. Reference PfaffPfaff (1993) found a good correlation of monthly means of air temperature and δ18O values of surface snow samples taken between 1981 and 1990. the best correlation between δ18O and temperature was found at the lifting condensation level (r =0.93, significant at the 95% confidence level).
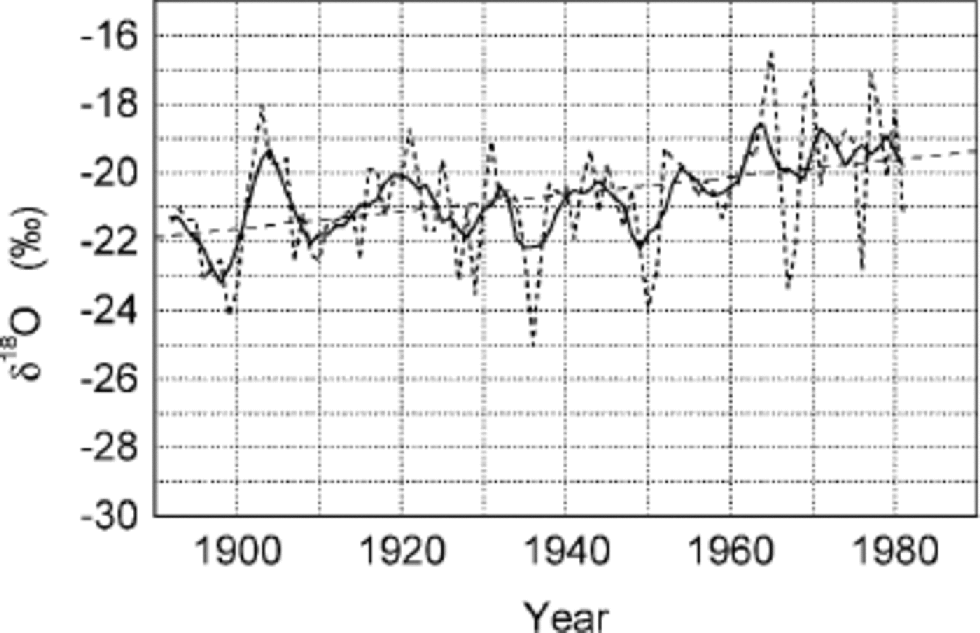
Fig. 9 Annualmean δ 18O for B04 for the time period 1892–1981 (thin line: annual values; bold line: 5 year running mean).
Figure 10 shows the annual mean temperature for the time period 1981–99 at GvN (until 1991) and Neumayer (since1992). the annual mean air temperature at Neumayer/GvN is –15.8˚C. Only small deviations from the mean are observed. Except for 1996, which was an exceptionally warm year, the mean annual temperatures differ <1˚C from the average. No variations corresponding to the large variations of δ18O in FB0198 since 1981 can be found in the temperature curve.
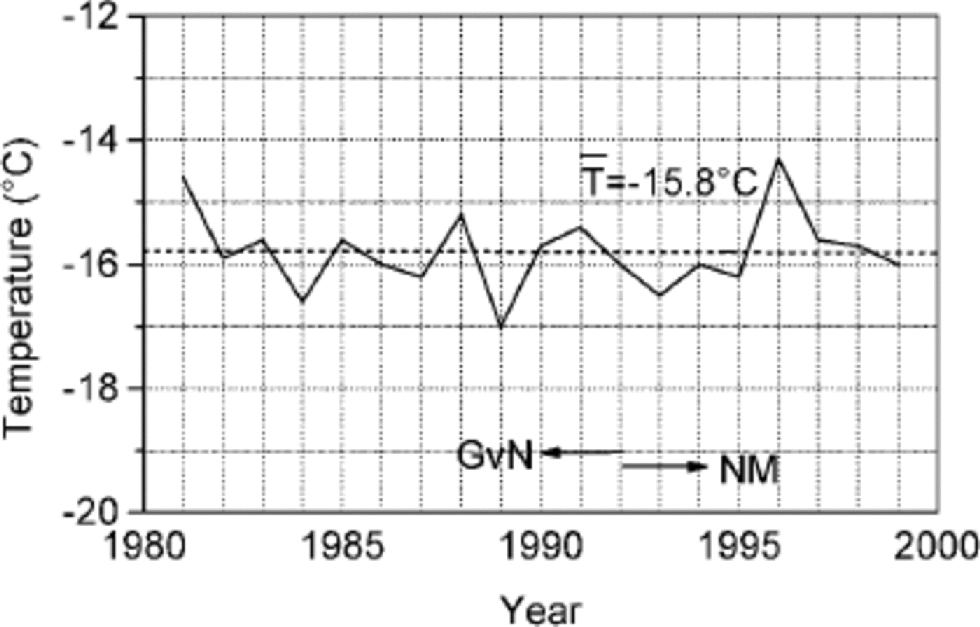
Fig. 10 Annual mean air temperature 1981–99, measured at GvN (1981–91) and Neumayer (1992–99).
Discussion
Different authors have studied changes in accumulation rates in various parts of Antarctica. An increase in accumulation during the second half of the 20th century was found at South Pole by Reference Mosley-ThompsonMosley-Thompson and others (1995). Reference Morgan, Goodwin, Etheridge and WookeyMorgan and others (1991) also found increasing accumulation values between 1960 and 1990. Reference Peel, Bradley and JonesPeel (1992) reports increasing accumulation for the peninsula region, too. Recent studies at the Ronne Ice Shelf and Amundsenisen have not shown the same trends. Reference OerterOerter and others (2000) investigated five cores at Amundsenisen, which covered the time period from the beginning of the 19th century. the stacked series of these cores showed an increasing trend in accumulation rates for the 20th century (6.3–7.4 kg m–2 a–1 since 1905). Reference Isaksson, Karlén, Gundestrup, Mayewski, Whitlow and TwicklerIsaksson and others (1996,Reference Isaksson, van den Broeke, Winther, Karlöf, Pinglot and Gundestrup1999) found no significant trends in accumulation rates in Dronning Maud Land. Reference Graf, Reinwarth, Oerter, Mayer and LambrechtGraf and others (1999) obtained the same result for the second half of the 20th century on Foundation Ice Stream, Ronne Ice Shelf. No significant trend in accumulation rates was found there. Obviously there is no uniform trend over Antarctica.
Reference Isaksson, van den Broeke, Winther, Karlöf, Pinglot and GundestrupIsaksson and others (1999) correlated accumulation rates from Fimbulisen to annual mean temperatures from the third South African National Antarctic Expedition (SANAE III), which was situated close to the coast of Fimbulisen. the year-to-year correlation is not significant, but the multi-year trends are similar. the accumulation rates from Neumayer show a different behaviour. Although SANAE III is situated only 200 km east of Neumayer and is influenced by the same synoptic systems, usually with a time lag of only a few hours, the annual mean air temperatures of Neumayer and SANAE III, respectively, are not well correlated, and the SANAE III temperature shows much higher variations than the annual temperature at Neumayer.
At Amundsenisen, Reference OerterOerter and others (2000) found an increasing trend in δ18O for the 20th century in the stacked time series mentioned above.
At Neumayer, the stable-isotope ratios show an increasing trend until 1980. for the next two decades, the δ18O shows large variations, with decreasing values towards the end of the 20th century. FB0198 is too short to calculate a statistically significant trend. However, the observed variations in δ18O cannot be explained using the temperature data. Factors other than temperature, such as changes in atmospheric circulation, must be involved.
Reliable interpretation of ice cores requires a better understanding of the precipitation conditions and of the general atmospheric circulation at present and for former climates.
Conclusions
Accumulation rates around Neumayer are about 360 kg m–2 a–1.The spatial distribution of accumulation is very uneven due to large wind influence. No trend was found in accumulation rates during the last 50 years. Earlier in the century, the accumulation decreased. Trends have to be interpreted very cautiously because of the high interannual variability of accumulation. In spite of the highly irregular spatial accumulation distribution, the stable-isotope ratios show little spatial variability, presumably because the isotope ratios are the same over a wider area during one precipitation event. δ18O values increased during the 20th century until 1980; since the late 1980s a decrease is observed. the δ18O variations during the last two decades of the 20th century are not directly related to temperature, since the mean annual temperature at Neumayer was nearly constant during this time period.
Acknowledgements
We would like to thank all of our colleagues who carried out fieldwork at Neumayer and analysis of the cores. This study has received financial support from the Austrian Science Fund (grant No. P13429-GEO). Analysis of B04 was carried out at the National Research Centre for Environment and Health (GSF), Neuherberg, Germany; thanks are due to W. Graf.


